1704
Abdominal Diffusion-Weighted Imaging with Stretched-Exponential Model: Phantom and Clinical StudiesTakeshi Yoshikawa1, Yoshiharu Ohno1,2, Seiya Kai3, Masao Yui3, Yoshimori Kassai3, Ryuji Shimada4, Katsusuke Kyotani4, and Shinichiro Seki1
1Advanced Biomedical Imaging Research Center, Kobe University Graduate School of Medicine, Kobe, Japan, 2Division of Functional and Diagnostic Imaging Research, Department of Radiology, Kobe University Graduate School of Medicine, Kobe, Japan, 3Canon Medical Systems Corporation, Otawara, Japan, 4Kobe University Hospital, Kobe, Japan
Synopsis
Abdominal DWI with stretched-exponential model was assessed in phantom and clinical studies. Our results suggest it is a useful tool for evaluating abdominal organs and diseases.
INTRODUCTION & PURPOSE
Stretched-Exponential Model
- Bi-exponential model can describe signal decay better than mono-exponential model, but requires many b values and longer acquisition time, causing misregistration, and makes calculation more complex.
- Stretched-exponential model can quantify signals arising from a multiplicity of sources with only two parameters.
Parameters
- Distributed diffusion coefficients (DDC)
- Water molecular diffusion heterogeneity index (alpha, α)
- α=1: heterogeneous intravoxel diffusion
- α=0: multi-exponential intravoxel signal decay Equation
Equation
- Sb/S0 = exp{-(b×DDC)α} cf. Sb/S0 = exp(-b×ADC)
The purpose of this study was to assess DWI with stretched-exponential model in evaluation of abdominal organs and diseases.
MATERIALS and METHODS
Phantom Study
- 8 bottled phantoms with polyethylene glycol diluted (PEG) with distilled water (concentrations of 10 to 150 mM), water, and fat were, scanned with SE-EPI-DWI with 10 b values (0, 50, 100, 150, 200, 250, 300, 500, 700, 1000).
- ADC, DDC, and alpha images were calculated using mono- and stretched-exponential models on a workstation (OleaSphere, Olea Medical).
- ADC and DDC with b values of 0, 500, 1000 were compared.
- DDCs and alphas with b values of 0, 500, 1000 and with all b values were compared.
Patients & Abdominal Lesions
- 125 patients (83 men and 42 women, mean: 67.6 years), who were suspected to have hepato-biliary-pancreatic malignancy and underwent 3T-MRI, were retrospectively analyzed.
- Maximum of 3 lesions per a patient and lesions with a diameter of >10 mm were chosen for analysis. •86 malignant and 80 benign lesions were confirmed and chosen for analysis.
- HCC: 44, liver meta:14, CCC:2, Combined liver Ca:1, bile duct Ca:4, GB Ca:1, panc Ca:13, pNET: 2, panc meta: 2, papillary Ca: 2, RCC: 1
- hepatic cyst:19, hepatic hemangioma:8, cholocyctitis:1, IPMN:16, panc cyst:5, pancreatitis:6, panc SCN:1, papillaryadenoma:1, renal cyst:19, hydronephrosis:1, LG-GIST:1
Imaging Technique, Post-Processing, & ROI placement
- All patients underwent MRI at a 3T scanner (Vantage Titan 3T; Canon Medical Systems, Otawara, Japan).
- Source DWIs were obtained with SE-EPI sequence (TR/TE/FA = 3000-6000/66/90, b values: 0, 500, 1000, matrix: 96 ×128, thickness: 7mm, NEX: 2, scan time: 10-12min, PASTA+SPAIR, PI: 2, MPG: x, y, z) as one of routine sequences in our institution.
- ADC, DDC, alpha images were calculated by using mono-exponential and stretched-exponential models on a workstation (OleaSphere, Olea Medical).
- Oval ROIs were placed in four liver segments, 3 pancreatic parts, spleen, gallbladder, bilateral kidneys, back muscle, and focal lesions.
Quantitative Analysis
- Mean ADC, DDC, and alpha values of each organ were calculated.
- Correlation coefficients among the parameters were assessed for each organ and lesion.
- Mean values of malignant and benign lesions were compared for each parameter.
- Lesion contrasts to background organs (=(lesion -background) / (lesion + background)) were calculated and compared among the parameters.
- Lesion characterization was compared using ROC among the parameters and their combinations.
RESULTS
- Phantom DDCs had trends toward higher in high diffusivity range and lower in low range compared to ADCs.
- There was no significant difference in phantom DDCs and alphas between with 3 b values and with all (Figs. 1 & 2).
- DDCs showed similar trends to ADCs in all organs and were significantly correlated (p<0.05).
- Alphas of gallbladder and muscle were significantly higher than other solid organs (<0.0001).
- Correlations of focal lesion ADCs and DDCs were significantly lower than solid abdominal organs' ones.
- Malignant lesion ADC, DDC, and Alpha were significantly lower than benign ones (<0.0001, <0.0001, 0.0005) (Fig. 3).
- Malignant lesion contrast on DDC was significantly higher than ADC (0.015) (Fig. 4).
- Lesion characterization showed no significant difference between ADC and DDC, and was highest when using all of ADC, DDC, and alpha (Az: 0.985).
- An example case is shown on Fig. 5.
DISCUSSION & CONCLUSION
DISCUSSION
- Stretched-exponential model enables diffusion analysis considering diffusion varieties in each voxel.
- DDC can be used as an excellent alternative to ADC.
- Alpha may improve diagnostic performance of abdominal DWI.
Questions
- Clinical impact of alpha
- Optimal b values and its number
- Effects of misregistrations among source images
- Effects of tissue perfusion
- Signal intensity patterns in benign cystic lesions
CONCLUSION
- DWI with stretched-exponential model is a useful tool in evaluation of abdominal organs and diseases.
Acknowledgements
No acknowledgement found.References
Many papers reported in the brain, head & neck, breast, and prostate.
Very few in the abdomen.
- HCC xenograft. Chen X, et al. JMRI 2017.
- Liver fibrosis. Anderson SW, et al. JMRI 2014.
Figures
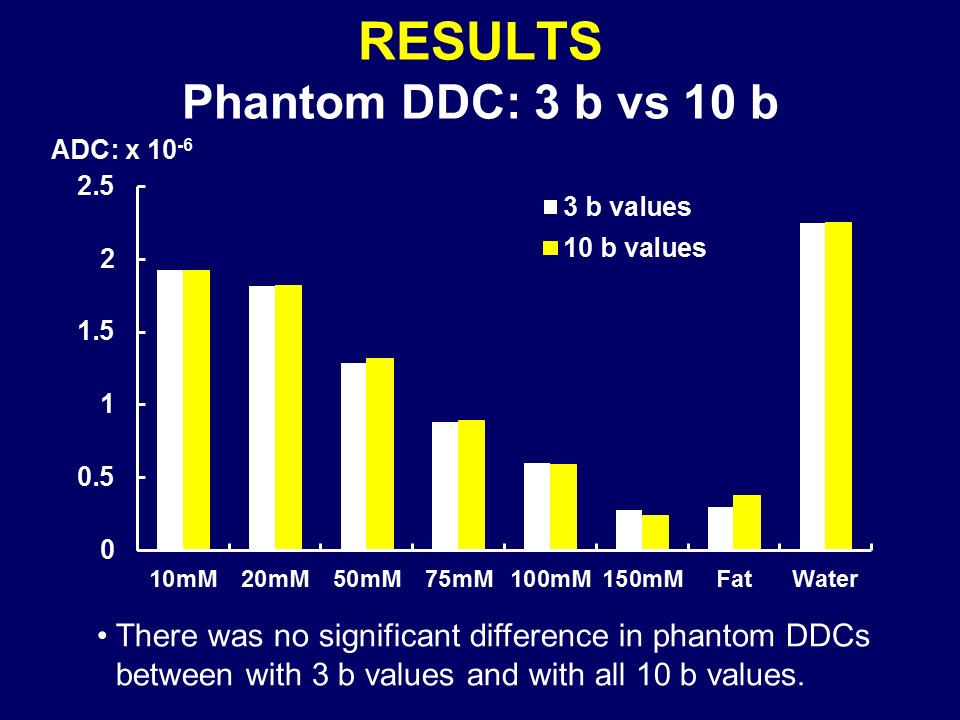
Figure 1. Phantom DDC: 3 b vs 10 b
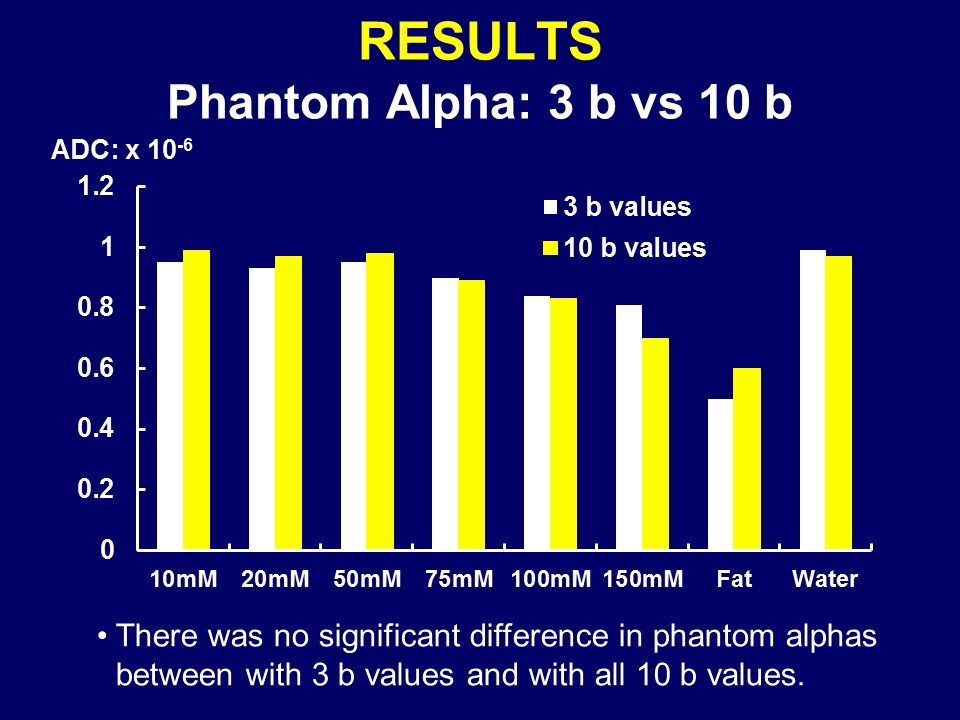
Figure 2. Phantom Alpha: 3 b vs 10 b
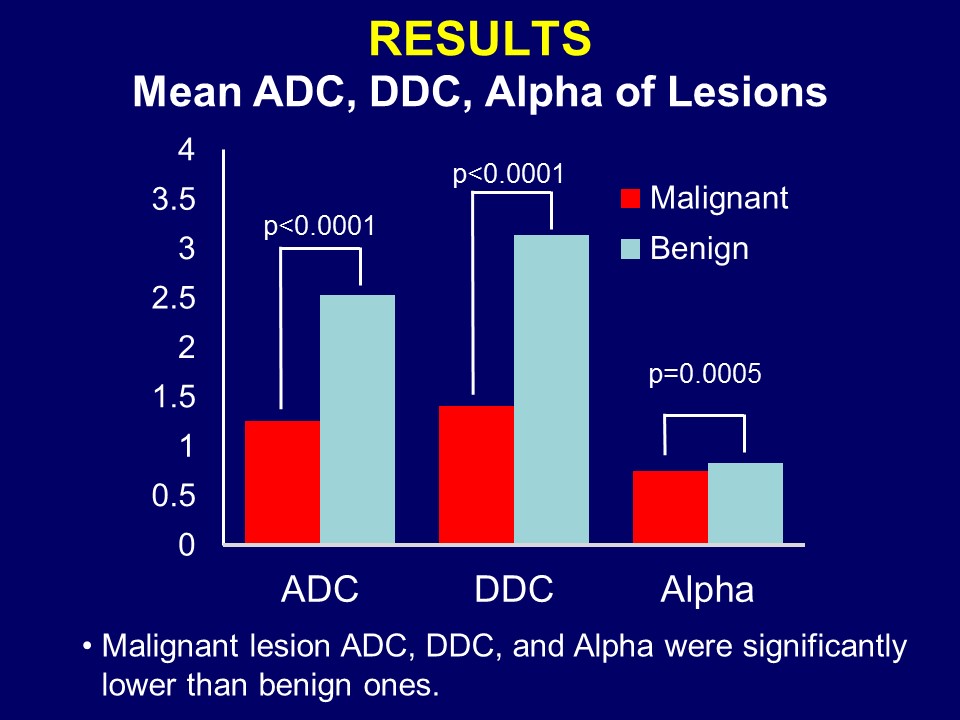
Figure 3. Mean
ADC, DDC,
Alpha of Lesions
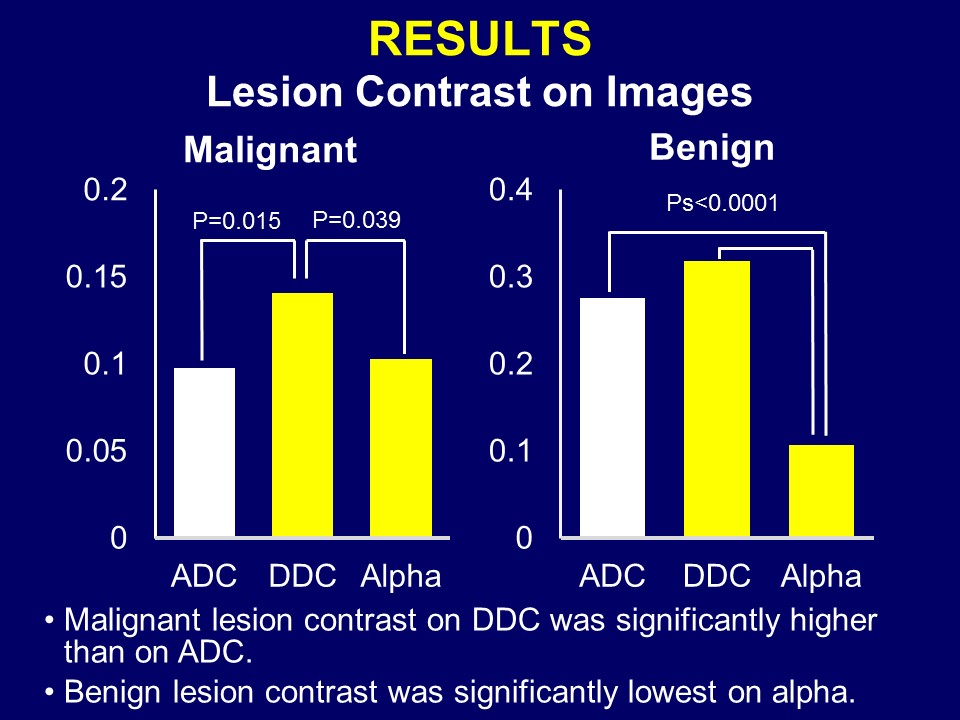
Figure 4. Lesion Contrast on Images
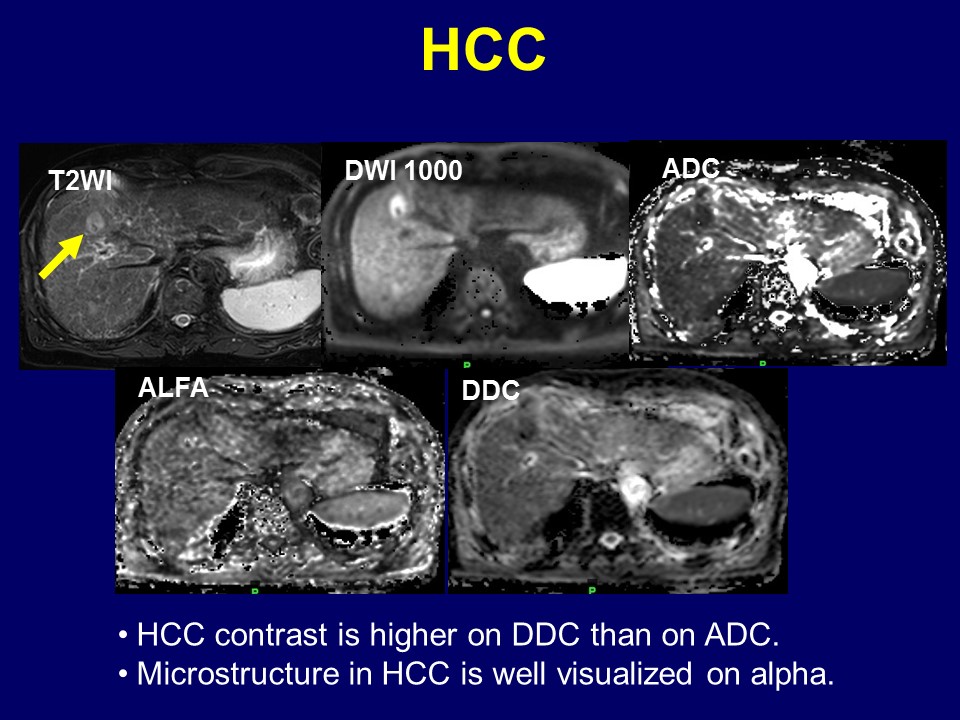
Figure 5. A case of HCC