1699
Metabolic biomarkers associated with occurrence of hepatocellular carcinoma in patients with liver cirrhosis: in vivo 1H magnetic resonance spectroscopy1National Institute of Biomedical Imaging and Bioengineering, National Institutes of Health, Bethesda, MD, United States, 2Radiology, Chonnam National University Medical School, Gwangju, Korea, Republic of, 3Radiology, Chonnam National University Hospital, Gwangju, Korea, Republic of, 4Radiology, Chonnam National University Hwasun Hospital, Gwangju, Korea, Republic of
Synopsis
Liver cirrhosis (LC) secondary to chronic hepatitis can lead to serious complications. More severely, liver cirrhotic patients may eventually develop hepatocellular carcinoma (HCC), thus monitoring disease progression is clinically important. The purpose of this study was to investigate the utility of 1H magnetic resonance spectroscopy (1H-MRS) with long echo time to quantify the differences in hepatic metabolites of normal, cirrhotic liver with and without HCC, and HCC. These findings would be helpful for understanding of liver metabolic changes related with developing HCC in the cirrhotic liver.
Purpose
Liver cirrhosis (LC) secondary to chronic hepatitis can lead to serious complications. More severely, liver cirrhotic patients may eventually develop hepatocellular carcinoma (HCC), thus monitoring disease progression is clinically important. The purpose of this study was to investigate the utility of 1H magnetic resonance spectroscopy (1H-MRS) with long echo time (TE) to quantify the differences in hepatic metabolites of normal, cirrhotic liver with and without HCC, and HCC.Materials and Methods
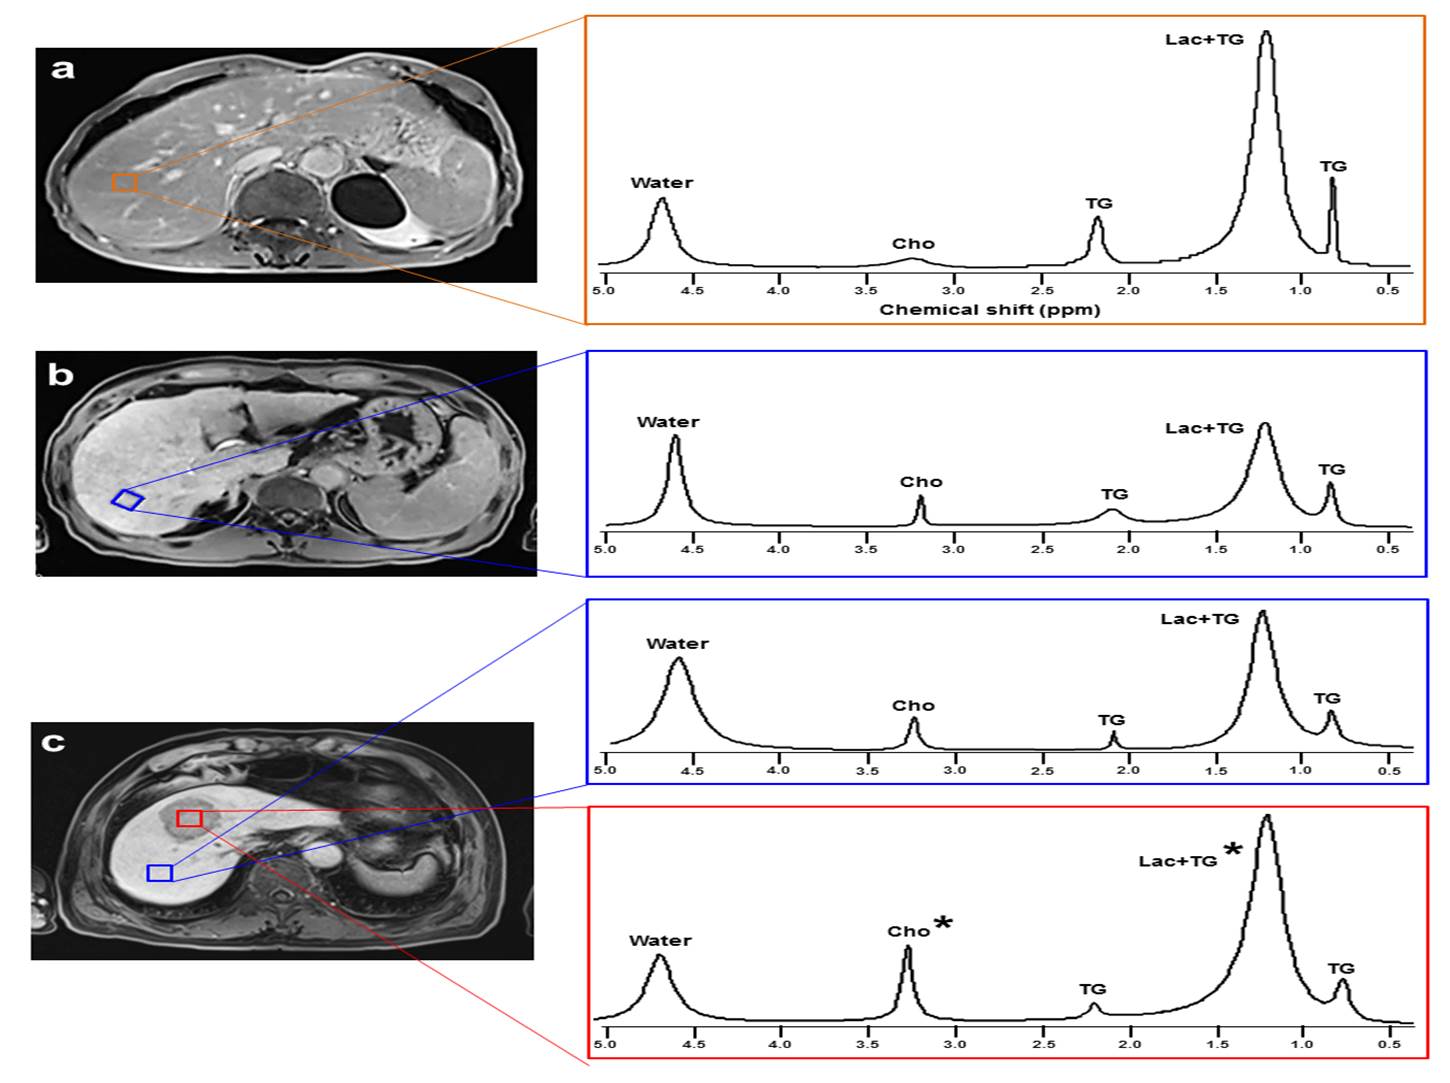
This study included 30 healthy controls (age: 49.0±22.1; male/female: 12/18), 30 patients with LC (age: 54.5±20.4; male/female: 19/11), and 30 patients with HCC secondary to cirrhosis (age: 64.6±24.6; male/female: 19/11). Sagittal, coronal, and axial images were acquired on a 3 Tesla Magnetom TimTrio MR scanner (Siemens Medical Solutions, Erlangen, Germany) with a 32-channel receiver body matrix coil to provide the reference anatomic images for voxel localization of 1H-MRS. Together with a single breath-hold technique, 1H-MRS with long TE measurements were performed on a localized voxel (Fig. 1) of the liver which was selected trying to avoid visible blood vessels and bile ducts using a point-resolved spectroscopy sequence (PRESS) with the following parameters: TR/TE=2000/288 ms; 6 acquisitions; voxel size=2×2×2 cm3.
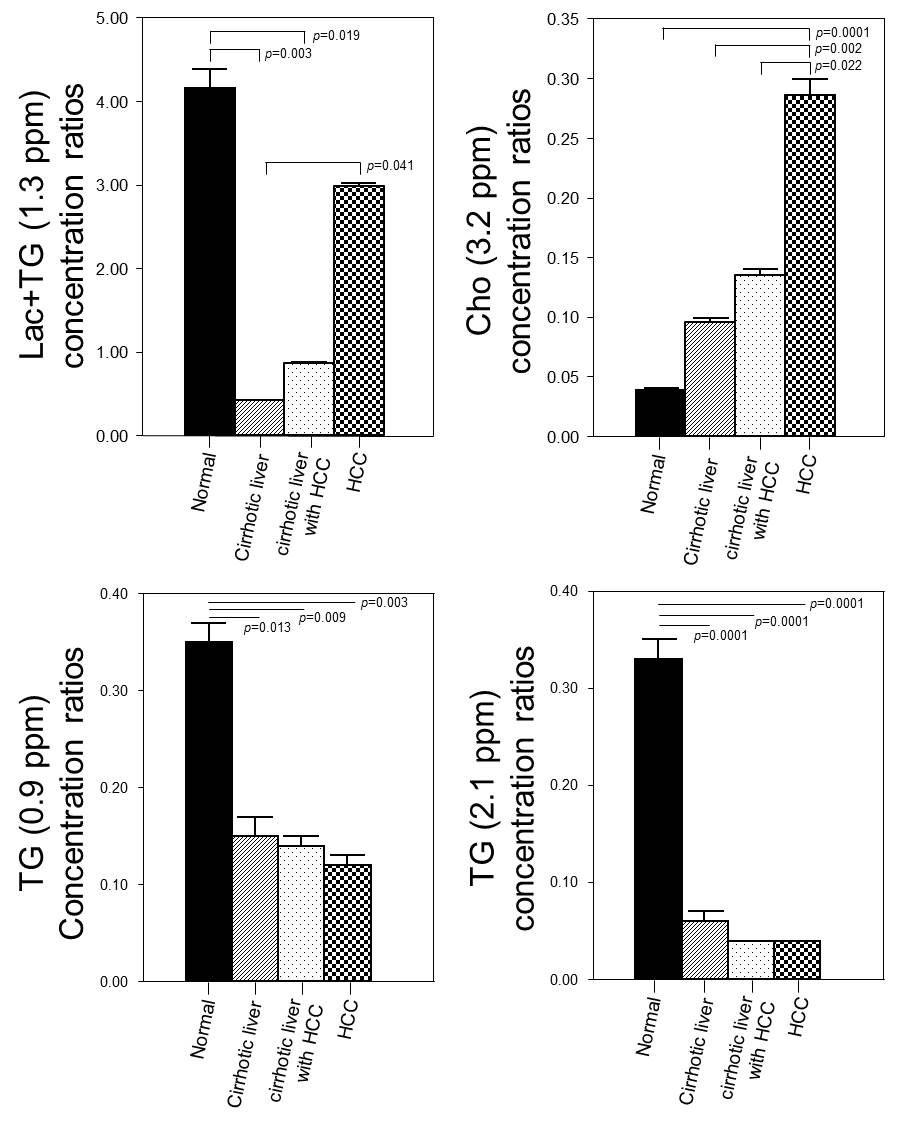
Triglyceride (TG) (0.9 ppm), lactate (Lac)+TG (1.3 ppm), TG (2.1 ppm), and choline (Cho) (3.2 ppm) levels were compared among normal, cirrhotic liver with and without HCC, and HCC using analysis of covariance (ANCOVA) adjusting for age and gender. In addition, diagnostic accuracy was determined by calculating the area under the receiver operating characteristics (ROC) curve.
Results and Discussion
Lac+TG level was significantly different between the normal and the cirrhotic liver without and with HCC, and between the cirrhotic liver without HCC and the HCC (P < 0.05) (Fig. 2). Cho level was significantly different between the normal liver and the HCC, and between the cirrhotic liver without and with HCC and the HCC (P < 0.05) (Fig. 2). There was also a significant difference in levels of TGs (0.9 and 2.1 ppm) among the normal, cirrhotic liver, and the HCC (P < 0.05) (Fig. 2).
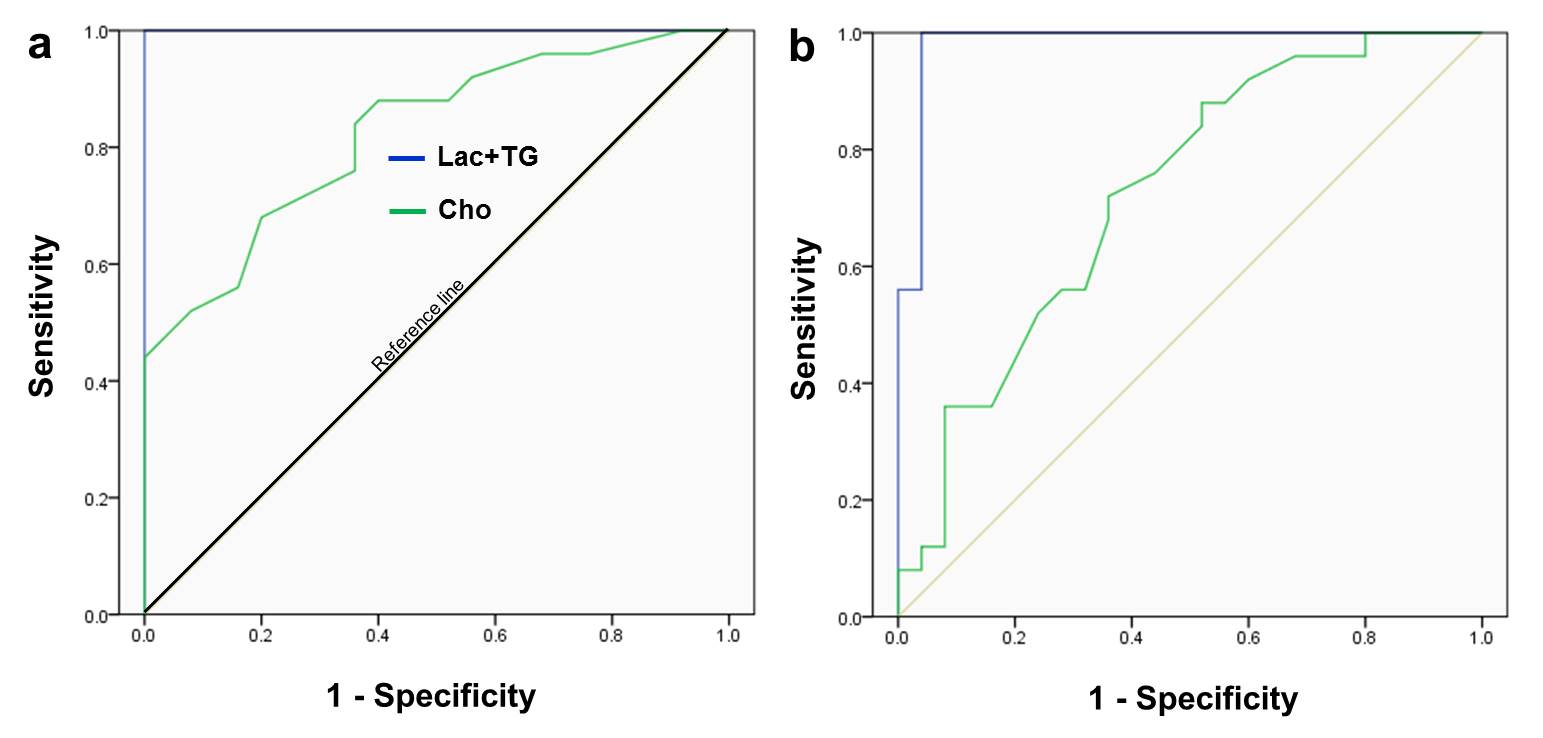
The areas under the ROC curve to distinguish HCC from cirrhotic liver without HCC was 1.00 (P=0.0001) with a cut-off value of 0.93 for Lac+TG and 0.82 (P=0.001) with a cut-off value of 0.12 for Cho, and to distinguish HCC from cirrhotic liver with HCC was 0.98 (P=0.001) with a cut-off value of 1.22 for Lac+TG and 0.73 (P=0.006) with a cut-off value of 0.14 for Cho (Fig. 3).
The interesting features of hepatic metabolite differences in the HCC are elevations of Lac+TG and Cho. On the basis of previous studies, the increased Cho peak with Lac+TG might be considered to reflect a hepatic disease specific metabolism in the anaerobic condition and the synthesis of membrane phospholipids, and long TE 1H-MRS is a useful tool for assessing Cho and Lac metabolites on progression of liver disease.
Conclusion
We used 1H-MRS to reflect metabolic profiling in normal, cirrhotic liver without and with HCC, and HCC, suggesting that 1H-MRS might potentially useful for noninvasive diagnosis and monitoring of patients with LC regarding the development of HCC by hepatic metabolite quantification. These findings would be helpful for understanding of liver metabolic changes related with developing HCC in the cirrhotic liver.Acknowledgements
This work was supported by the funds from the National Research Foundation of Korea (2017R1A6A3A11030092; 2018R1D1A3B07043473), the Chonnam National University Hospital Research Institute of Clinical Medicine (CRI18091-2) and the Central Medical Service Co., Ltd. (CRE17181-7).References
1) Ouwerkerk R, Pettigrew RI, Gharib AM. Liver metabolite concentrations measured with 1H MR spectroscopy. Radiology. 2012;265(2):565-75.
2) Qayyum A. MR spectroscopy of the liver: principles and clinical applications. Radiographics. 2009;29(6):1653-64.
Figures