1689
Radiomics analysis of gadoxetic acid-enhanced MRI for the evaluation of HCC treatment response to Yttrium-90 radioembolization1Translational and Molecular Imaging Institute, Icahn School of Medicine at Mount Sinai, New York, NY, United States, 2Department of Radiology, Icahn School of Medicine at Mount Sinai, New York, NY, United States
Synopsis
The goal of our study was to assess the predictive value of radiomics features assessed on pre-treatment multi-phasic gadoxetic acid-enhanced (EOB-)MRI for prediction of response of hepatocellular carcinoma to 90Yttrium radioembolization (RE). We found that radiomics features measured at baseline were predictive of response assessed at 6 weeks and 6-12 months after treatment. These results indicate value of radiomics for prediction of RE response, which needs to be validated in a larger study.
Introduction
90Yttrium radioembolization (RE) is a locoregional therapy that can be used for downstaging or bridging patients with hepatocellular carcinoma (HCC) who are waiting for liver transplantation 1, also in patients with advanced HCC. Prediction of tumor response to RE is essential for clinical management of these patients. MRI is commonly used for the diagnosis and characterization of HCC, including for assessment of response to RE 2. It would therefore be of great value if MRI measurements obtained at baseline would be predictive of RE response. The goal of our study was to assess the predictive value of radiomics features of multi-phasic gadoxetic acid-enhanced (EOB-)MRI obtained at baseline for prediction of short-term and long-term RE response.Methods
This IRB-approved prospective single center study included 24 patients with HCC (M/F 18/6, mean age 69y) who had MRI at 1.5T (Siemens Aera) before RE. The average time between baseline MRI and RE was 27.5±23.4 days. RE was performed segmentally (n=19) or lobar (n=5). Regions of interest (ROIs) were drawn by a radiologist in the lesions on the portal venous (PVP) and hepatobiliary phases (HBP 20min) of EOB-MRI. Radiomics analysis quantified lesion characteristics in the ROIs using histogram (mean, median, standard deviation, kurtosis, skewness) and Haralick texture features. All patients had MRI follow-up at 6 weeks (6w) and 17 patients had follow-up at 6-12 months. Objective response was assessed at 6w and 6-12 months using modified RECIST (mRECIST) criteria 3. mRECIST was performed on the lesion level and classified up to two largest treated lesions per patient as progressive disease (PD), stable disease (SD), partial response (PR) or complete response (CR). ROC analysis was employed to assess the diagnostic performance of radiomics measurements at baseline for prediction of response at 6w and 6-12 months. The potential value of combinations of parameters for prediction of response was assessed using logistic regression with stepwise selection of features that showed an area under the curve (AUC) > 0.8 in the ROC analysis.Results
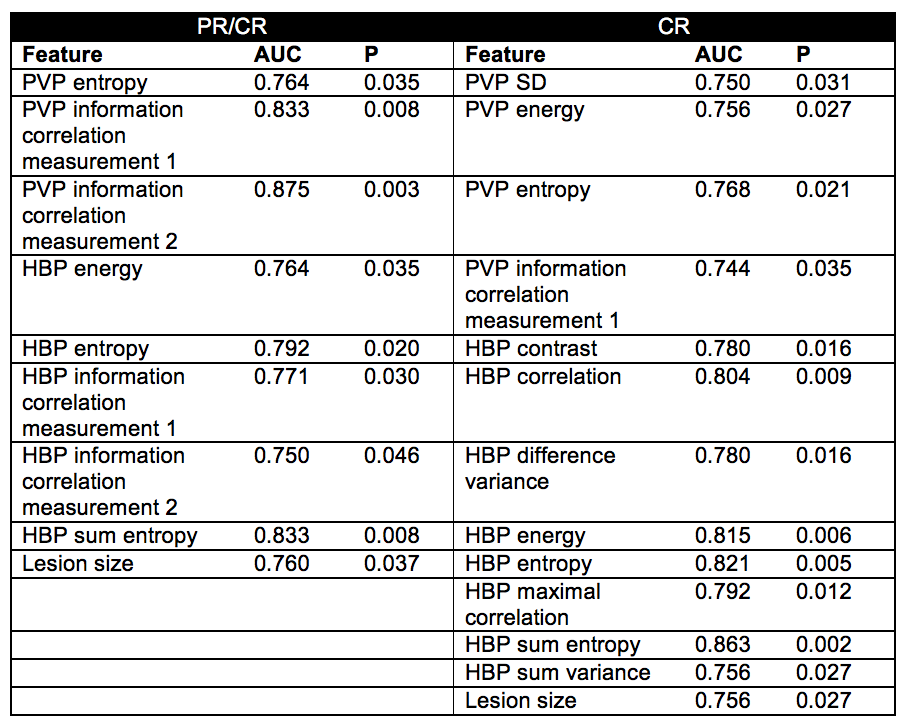
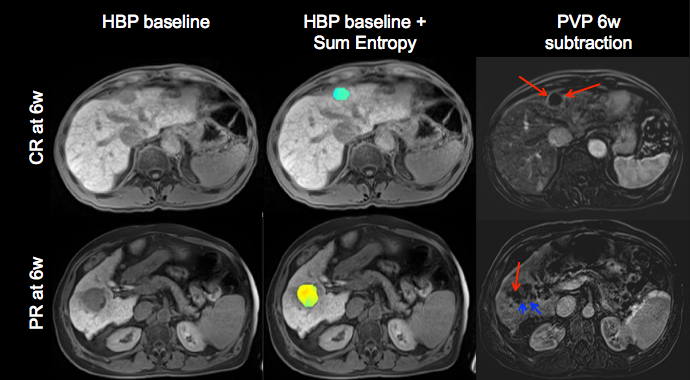
26 lesions were analyzed (mean lesion size 3.6 cm, range 1.1 – 8 cm). mRECIST response at 6w was as follows: SD (n=8), PR (n=6), CR (n=12). mRECIST at 6-12 months was analyzed in 18 lesions: PR (n=4), CR (n=14). Several texture features at baseline showed significant diagnostic performance for prediction of PR/CR at 6w (highest AUC for PVP information correlation measurement 2 and HBP sum entropy, AUC=0.83, P=0.008 for both; Table 1) and for prediction of CR at 6w (highest AUC for HBP sum entropy, AUC=0.86, P=0.002; Table 1, Figure 1). Lesion size at baseline also exhibited significant AUC for prediction of PR/CR and CR at 6w, but with lower diagnostic performance than the texture features (AUC=0.76 for both; Table 1). One texture feature at baseline (HBP maximal correlation) showed significant diagnostic performance for prediction of CR at 6-12 months (AUC=0.84, P=0.044). Logistic regression with stepwise feature selection indicated HBP Sum Entropy at baseline as independent predictor of PR/CR and CR at 6w. No added value of combined parameters was observed in the logistic regression analysis.Discussion
mRECIST is currently proposed as the standard methodology to assess radiological response of HCC 3. However, a unified consensus on an early imaging biomarker to assess HCC tumor response and outcome post RE has not been reached. In particular, the prediction of RE response using MRI biomarkers at baseline would be highly clinically relevant, as this could greatly aid in treatment stratification. Promising results of pretherapy PET/CT radiomics features for prediction of 90Yttrium RE have been described previously 4. In our study, we demonstrate potential value of baseline MRI radiomics features for prediction of 90Yttrium RE response. Baseline radiomics features were particularly predictive of short-term response at 6w, while only one radiomic feature showed predictive value of CR at 6-12 months. The lower performance for long-term response prediction may be due to the smaller cohort with long-term follow-up data. In addition, all patients with long-term follow-up data showed response, precluding analysis of prediction of PR/CR in this cohort.Conclusion
Our results indicate promising value of radiomics analysis of baseline EOB-MRI data in HCC for prediction of response to RE, in particular for assessment of short-term response. The exact utility of radiomics analysis of EOB-MRI for prediction of response to RE in HCC needs to be tested in a larger cohort of patients.Acknowledgements
This research was supported by NCI grant U01 CA172320.References
1. Salem R, Gordon AC, Mouli S, Hickey R, Kallini J, Gabr A, Mulcahy MF, Baker T, Abecassis M, Miller FH, Yaghmai V, Sato K, Desai K, Thornburg B, Benson AB, Rademaker A, Ganger D, Kulik L, Lewandowski RJ. Y90 Radioembolization Significantly Prolongs Time to Progression Compared With Chemoembolization in Patients With Hepatocellular Carcinoma. Gastroenterology 2016;151(6):1155-1163 e1152.
2. Semaan S, Makkar J, Lewis S, Chatterji M, Kim E, Taouli B. Imaging of Hepatocellular Carcinoma Response After (90)Y Radioembolization. AJR American journal of roentgenology 2017;209(5):W263-W276.
3. Lencioni R, Llovet JM. Modified RECIST (mRECIST) assessment for hepatocellular carcinoma. Seminars in liver disease 2010;30(1):52-60.
4. Mehta R, Cai K, Kumar N, Knuttinen MG, Anderson TM, Lu H, Lu Y. A Lesion-Based Response Prediction Model Using Pretherapy PET/CT Image Features for Y90 Radioembolization to Hepatic Malignancies. Technology in cancer research & treatment 2017;16(5):620-629.
Figures