1683
Differential Diagnosis of Intrahepatic Mass-forming Cholangiocarcinoma and Solitary Hypovascular Hepatic Metastasis Using Whole-Tumor Texture Features Based on Apparent Diffusion Coefficient and Fractional Anisotropy Signal Intensity Maps1Department of Radiology, The First Affiliated Hospital of Dalian Medical University, Dalian, China
Synopsis
This work aimed for ADC and FA texture features based strategy to identify intrahepatic mass-forming cholangiocarcinoma (IMCC) and solitary hypovascular hepatic metastasis (SHHM) which may represent a diagnostic challenge due to many overlapping MRI features. The results showed that ADC and FA texture features can differentiate IMCC and SHHM. The Grey Level Non-uniformity (GLN) achieved the best result (AUC: 0.820; sensitivity: 79.2%; specificity: 86.2%) on ADC signal intensity map, forming a valuable strategy for clinical practice.
Purpose
To investigate the value of apparent diffusion coefficient (ADC) and fractional anisotropy (FA), and their whole-tumor texture features in differentiation of intrahepatic mass-forming cholangiocarcinoma (IMCC) and solitary hypovascular hepatic metastasis (SHHM) using diffusion tensor imaging (DTI).Introduction
Intrahepatic cholangiocarcinoma (ICC) is the second most common primary liver malignant neoplasms, and IMCC is the most common histologic type. The liver is one of the most predilection sites of metastases. In most cases, it can be differentiated for IMCC and SHHM according to clinical history and typical imaging signs, such as intrahepatic duct dilatation and hepatic capsular retraction. However, there are many overlapping MRI features between IMCC and SHHM, which represents a diagnostic challenge1. It is crucial to discriminate these two types of lesions because the carcinomas and metastases require different treatments. The recently developed DTI is an imaging modality that detects the microstructural and pathological changes of organisms according to the diffusive characteristics of water molecules in the tissues. Routine ADC and FA measurements provide restricted information on mean values, which do not account for the underlying spatial distribution. Texture analysis is a new image analysis method, which has been used for malignant tumor grade or prognosis evaluations2-4. MR texture analysis can quantify the distribution of signal intensity of voxels within the tumor to reflect tumor heterogeneity. Moreover, three-dimension regions of interest (ROI) set across the entire lesion can lead to a more accurate diagnosis5. We hypothesize that it’s feasible to identify IMCC and SHHM by DTI texture features based strategy.Materials and Methods
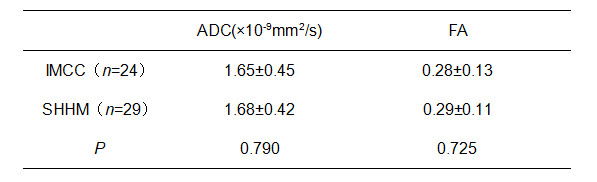
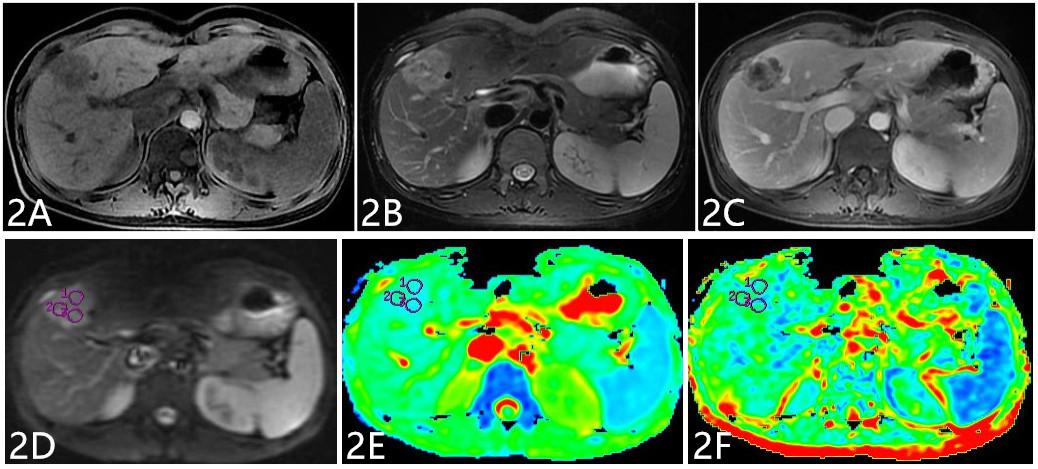
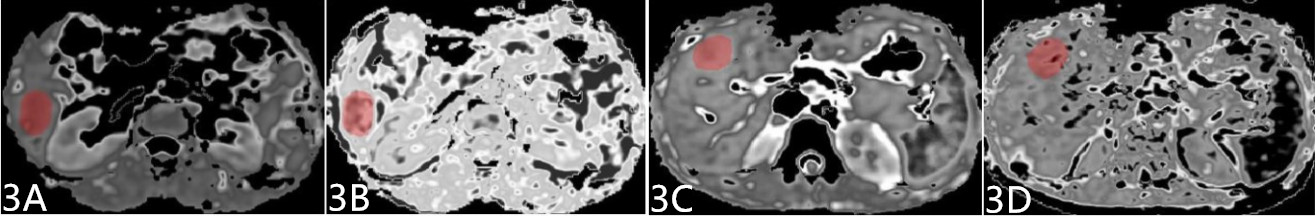
The present study retrospectively enrolled 53 patients who were pathologically or follow-up imaging confirmed as IMCC or SHHM, including 24 IMCCs and 29 SHHMs, respectively. All patients have underwent preoperative MR examinations, including routine scanning (T1WI, T2WI, and dynamic contrast-enhanced MR imaging) sequences and additional DTI sequence (b value=0, 600 (s/mm2), in 6 directions). ADC and FA maps were derived using Functool software on GE AW4.6 workstation, where ADC and FA values were measured. MR data were analyzed by Omni-Kinetics software (GE Healthcare). The radiologist reviewed the MRI images and manually outlined the region of interests (ROIs) at each slice of the lesion on ADC and FA signal intensity maps, then texture features were generated automatically after 3D ROIs covering the whole tumor. Texture related parameters consisted of GLCM (Energy, Entropy, Inertia, Correlation, Inverse Difference Moment (IDM), Cluster Shade, Cluster Prominence) and GLRL (Grey Level non-uniformity, Run Length non-uniformity). Data analyses were performed using SPSS19.0 statistical software. Independent sample t test was used for investigating routine ADC and FA value, and Mann-Whitney U test was used for texture features. Diagnostic performance was evaluated by receiver operating characteristic (ROC) analysis.Results
Discussion
Grey Level non-uniformity (GLN) measures the similarity of gray-level intensity values in the image, where a lower GLN value correlates with a greater similarity in intensity values. Run Length non-uniformity (RLN) measures the similarity of run lengths throughout the image, with a lower value indicating more homogeneity among run lengths in the images. The GLN and RLN in IMCC group was higher compared to SHHM group. One convincing explanation is that the composition of IMCC is heterogeneous, which contains cancerous cells and many fiber components. To our best knowledge, this is the first study of DTI based texture strategy to identify IMCC and SHHM, further study will be performed to verify its utility.Conclusion
It is not efficient for identifying IMCC and SHHM by routine ADC and FA values of DTI. In the current study, we proposed a DTI based texture strategy to preoperatively identify IMCC and SHHM, which will provide a more promising method for tumor differentiation in clinic and facilitate clinical management.Acknowledgements
No acknowledgement found.References
[1] Qian H, Li S, Ji M, et al. MRI characteristics for the differential diagnosis of benign and malignant small solitary hypovascular hepatic nodules. Eur J Gastroenterol Hepatol. 2016, 28(7): 749-56.
[2] Suo ST, Chen XX, Fan Y, et al. Histogram analysis of apparent diffusion coefficient at 3.0 T in urinary bladder lesions: correlation with pathologic findings. Acad Radiol, 2014, 21(8): 1027-1034.
[3] Ma X, Zhao X, Ouyang H, et al. Quantified ADC histogram analysis:a new method for differentiating mass-forming focal pancreatitis from pancreatic cancer. Acta Radiol, 2014, 55(7): 785-792.
[4] Woo S, Cho JY, Kim SY, et al. Histogram analysis of apparent diffusion coefficient map of diffusion-weighted MRI in endometrial cancer: a preliminary correlation study with histological grade. Acta Radiol, 2014, 55(10): 1270-1277.
[5] Moriya T, Saito K, Tajima Y, et al. 3D analysis of apparent diffusion coefficient histograms in hepatocellular carcinoma: correlation with histological grade. Cancer Imaging, 2017, 17(1): 1.
Figures