1678
Comparison of abdominal lymph nodes between healthy volunteers and patients with inflammatory gastrointestinal diseases.1Sir Peter Mansfield Imaging Centre, University of Nottingham, Nottingham, United Kingdom, 2Nottingham Digestive Diseases Biomedical Research Centre, University of Nottingham, Nottingham, United Kingdom
Synopsis
Inflammatory diseases of the gastrointestinal tract are likely to cause enlargement of the abdominal lymph nodes which could potentially act as a biomarker of local inflammation. Lymphatics have been identified using a range of MRI sequences but previous work has largely focused on changes in cancer rather than chronic inflammatory diseases. We present here the first comparison of quantitative non-invasive MRI measures of T2, Apparent Diffusion Coefficient (ADC) and size of lymph nodes in healthy volunteers and patients with a range of inflammatory gastrointestinal diseases.
Introduction
The lymphatic system forms a vital part of the immune system as well as providing a network to transport lipids and regulate interstitial fluid levels[1]. Inflammatory conditions such as Crohn’s disease cause changes in the lymphatics including enlargement and necrosis[2]. Markers of lymph node changes could provide novel markers of local inflammatory response. Lymphatics have been identified on T2 weighted, Dixon and diffusion weighted MRI scans [3, 4]. Diffusion weighted imaging (DWI) with Background Suppression (DWIBS) provides a powerful method to visualize the nodes which are otherwise hard to identify on 3T abdominal images unless they are significantly enlarged [5]. Recent studies have used DWIBS to show a difference in ADC between benign and malignant enlarged nodes but work has largely been focused in cancer rather than inflammatory diseases [3, 4, 6]. Quantitative T2 may provide an additional marker of changes occurring in inflamed nodes, but to our knowledge no quantitative T2 measures of mesenteric lymph nodes have been reported.
Aim: to measure the Apparent Diffusion Coefficient (ADC), T2 and size of abdominal lymph nodes in healthy volunteers and patients with a range of chronic/recurrent inflammatory gastrointestinal diseases.
Methods
Healthy participants (N=7), patients with Crohn’s disease (N=6), Diverticulitis (N=3) and liver cirrhosis (N=4) were scanned on a Phillips 3T Ingenia (Best, the Netherlands) (This study is ongoing with an aim to recruit 10 in each group). To reduce through plane motion, slices were orientated sagittally and respiratory triggering was used. The DWIBS sequence was used to highlight the lesions within the abdomen (diffusion weighted with pre inversion, TI=260ms, for background suppression). The diffusion weighting was varied to measure ADC. To measure the T2 of the nodes with DWIBS to enhance visualisation, the sequence was modified to fix the duration, amplitude and spacing of the diffusion gradients (b=300s/mm2 to attenuate any perfusion signal) as the echo time was changed (Figure 1). The scan parameters are summarized in Figure 1. For both the ADC and T2 calculation a linear fit was applied to the log of the signal plotted against diffusion weighting (b) or TE. To correct for motion (in the T2 data only as it was collected over a longer time period) if a point fell 10% away from the line of fit it was removed and then the fit was repeated and any T2 fitted data was discarded if the R squared was <0.9. The healthy volunteer data was acquired first allowing for a wide range of echo times to be collected. From these a smaller set of optimized echo times was used for the patients. The length of the major and minor axis of the lymph nodes were also recorded for the shortest TE and b value of 400 s/mm2.Results
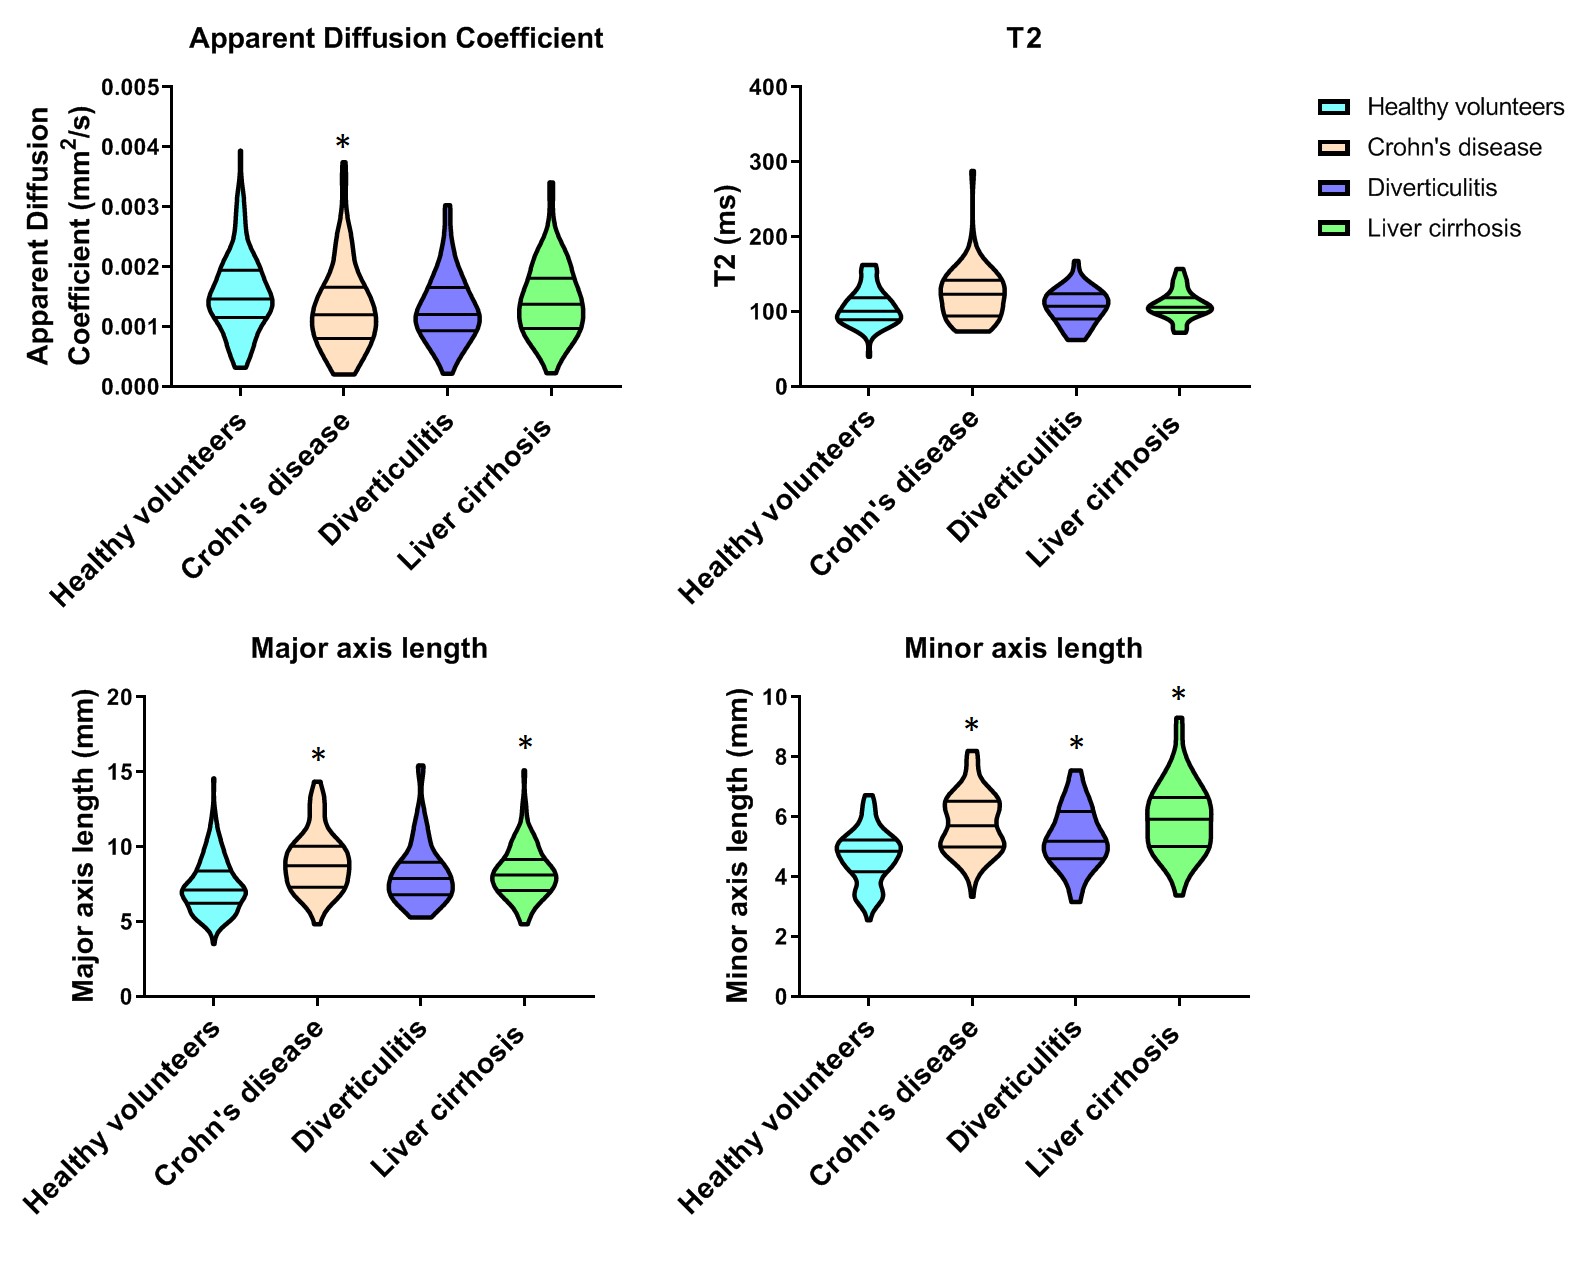
Figure 2 shows lymph nodes identified on DWIBS images at standard and long echo times in a healthy participant and a Crohn’s patient. On average 23 nodes were identified in patients and 29 in healthy volunteers, however the number of nodes seen was highly dependent on the quality of respiratory triggering. Figure 3 shows the ADC, T2 and length of the major and minor axis calculated for each group with the results summarised in violin plots for the groups as a whole (Figure 4) and for individuals within the groups (Figure 5).Discussion
As expected the size of the lymph nodes is increased in diseases associated with recurrent/chronic inflammation. There was a decrease in diffusion coefficient in Crohn’s disease probably indicating an increase in cellularity of inflamed lymph nodes that could be associated with migration of immune system cells to the active lymph nodes (similar changes have been reported in cancer). There was a trend for T2 to be increased in Crohn’s disease which could be due to fibrosis or other changes associated with lymph nodes in this condition, but this did not reach significance [7]. The main limitation of this study was that only a limited number of imaging slices could be acquired in a reasonable scan time, which could be addressed in future by using multiband acquisition to provide a more comprehensive evaluation of the abdominal lymph nodes.Conclusions
This is the first study we are aware of using MRI to study lymph nodes in chronic inflammatory conditions. This could provide a novel marker of local inflammatory response which could be valuable in assessing disease progression and response to therapy in a number of conditions.Acknowledgements
This work was funded by the Medical Research CouncilReferences
1. Tortora, G.J. and S.R. Grabowski, Principles of anatomy and physiology. 2000.
2. Alexander, J.S., et al., Gastrointestinal lymphatics in health and disease. Pathophysiology, 2010. 17: p. 315-335.
3. Akduman, E.I., et al., Comparison between malignant and benign abdominal lymph nodes on diffusion-weighted imaging. Academic radiology, 2008. 15: p. 641-6.
4. Arrivé, L., et al., Noncontrast Magnetic Resonance Lymphography. 2016: p. 80-85.
5. Takahara, T., et al., Diffusion weighted whole body imaging with background body signal suppression (DWIBS): technical improvement using free breathing, STIR and high resolution 3D display. Radiation medicine, 2004. 22: p. 275-282.
6. Van den Bergh, L., et al., Reliability of sentinel node procedure for lymph node staging in prostate cancer patients at high risk for lymph node involvement. Acta oncologica (Stockholm, Sweden), 2015. 54: p. 896-902.
7. Fonseca, D.M., et al., Microbiota-Dependent Sequelae of Acute Infection Compromise Tissue-Specific Immunity. Cell, 2015. 163(2): p. 354-66.
Figures

Top: Modified diffusion weighted sequence. All diffusion gradient parameters are fixed (G=gradient strength, δ=gradient duration, Δ=gradient interval).When the echo time is changed the red box remains centered on TE/2.
Bottom: Scan parameters for ADC and T2 acquisitions.

Top: Healthy volunteer, two lymph nodes shown by the red arrows on a standard diffusion weighted image on the left and the same two nodes on a long TE diffusion weighted image on the right. Below: Crohn's patient, two lymph nodes shown by the red arrows on a standard diffusion weighted image on the left and the same two nodes on a long TE diffusion weighted image on the right. Nodes in the Crohn's patient are larger and more spherical.