1675
Quantification of MT in the bowel wall from the z-spectrum1University of Nottingham, Nottingham, United Kingdom
Synopsis
We have developed a protocol able to measure and quantify MT in the bowel wall through acquisition of the z-spectrum at 3T, and have developed a protocol capable of eliminating respiratory artefacts which have the potential to invalidate MT abdominal imaging.
Purpose
Previous studies have measured MTR in the bowel wall as a marker for intestinal fibrosis1 however this measure can be seriously hampered by respiratory and motion artefacts2. Through acquisition of the full z-spectrum, we can overcome the effect of respiratory artefacts to provide a more reliable metric of MT, and potentially infer further information such as the exchange rate and T2 of the bound pool, to give additional physiological information.Aim
To assess the suitability of measuring MT in the bowel wall through fully sampling the z-spectrum.Methods
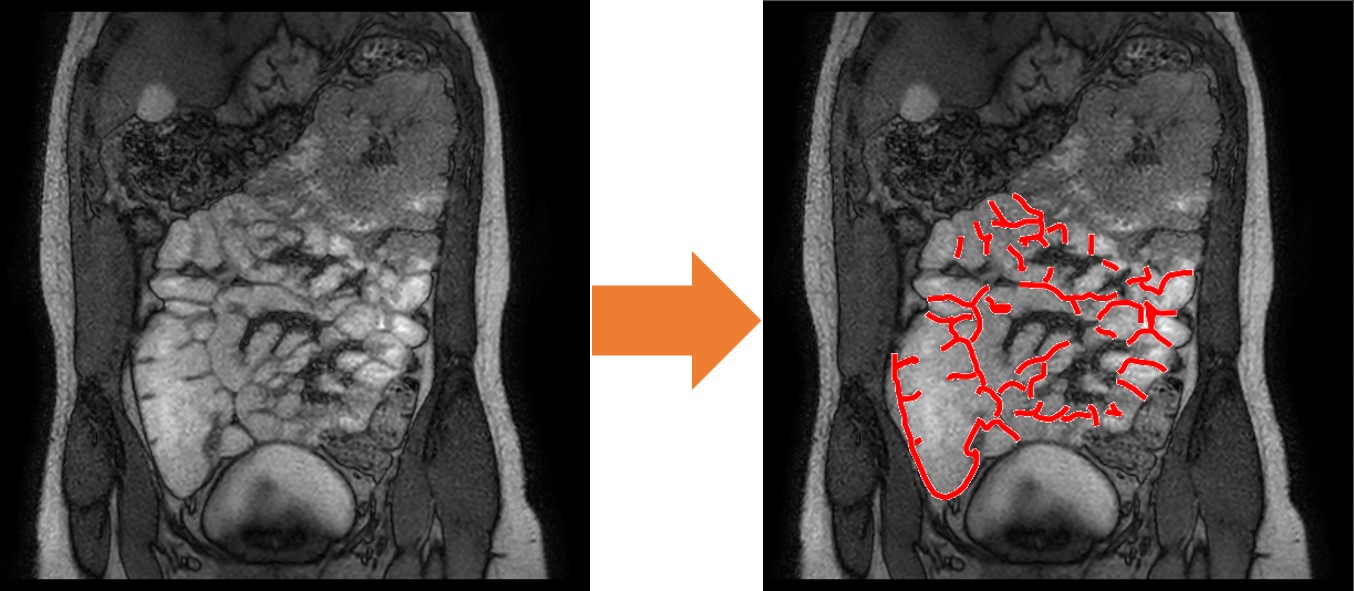
2 healthy volunteers (age=24,1F) were scanned using a 3T Philips Ingenia wide-bore system. Subjects ingested 1000ml of Mannitol solution prior to scan in order to increase contrast between the lumen and bowel wall. Two doses of Buscopan were injected into the subjects whilst in the scanner, at 15 minutes intervals to halt bowel motion. Z spectra were acquired using an MT-TFE sequence3 with 48 off-resonance dynamics. Subjects laid prone in the scanner, and visual triggers were shown to encourage breath holding at approximately the same phase of the respiratory cycle during the acquisition of each scan, in order to eliminate respiratory artefacts in the z-spectrum. Acquisition of one spectrum took 4 mins, and this was performed twice, once for each dose of Buscopan. The spectra were acquired by sampling 16 points from -100,000Hz to +100,000 Hz non-linearly, repeating the acquisition a different set of frequencies, so that if the effects of the Buscopan wore off, the whole of the z-spectrum would be sampled to some degree. The images were then examined to identify bowel movement, and points were discarded after motion began to occur. The bowel wall was masked manually by drawing around the ROI (Figure 1), and for comparisons masks of the liver and abdominal muscle were also created. Spectra from these regions were averaged and B0 corrected pixel by pixel using in house MATLAB scripts, and compared against each other. A two pool Lorentzian fit was performed in order to quantify the MT and water pools.Results
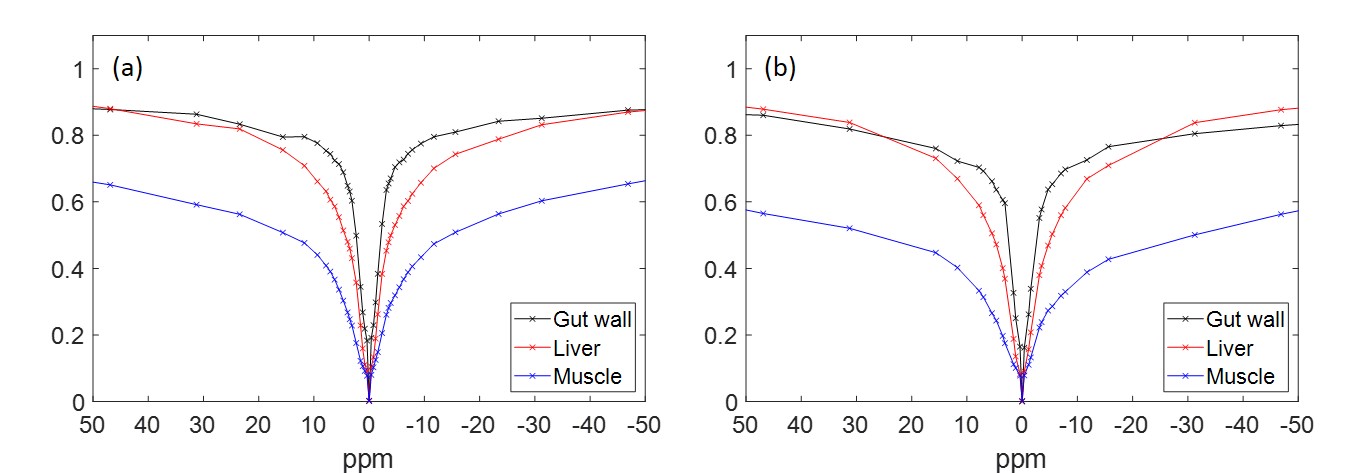
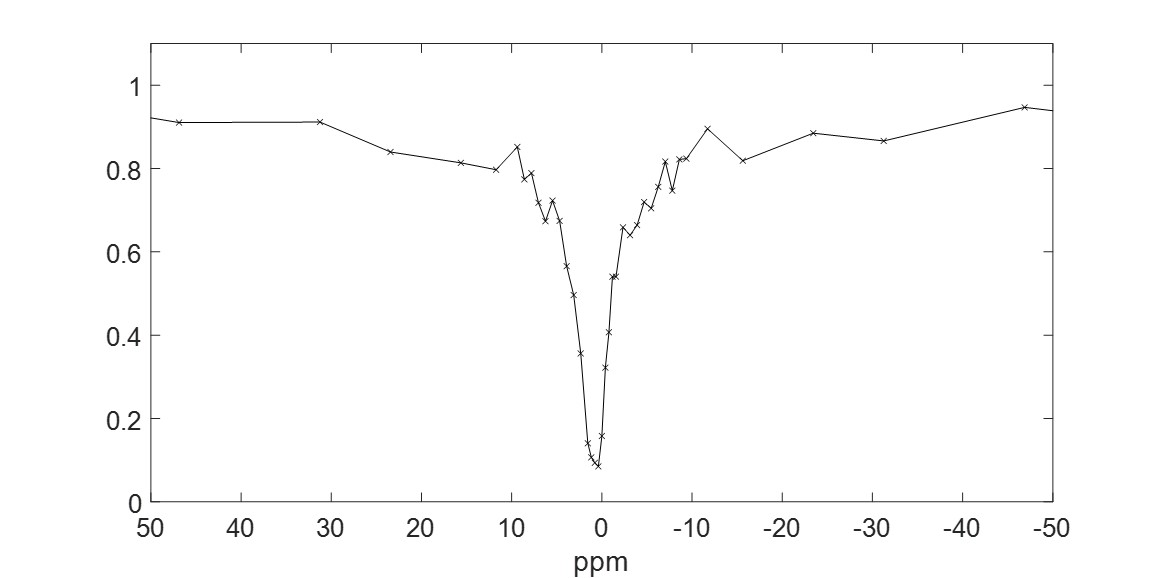
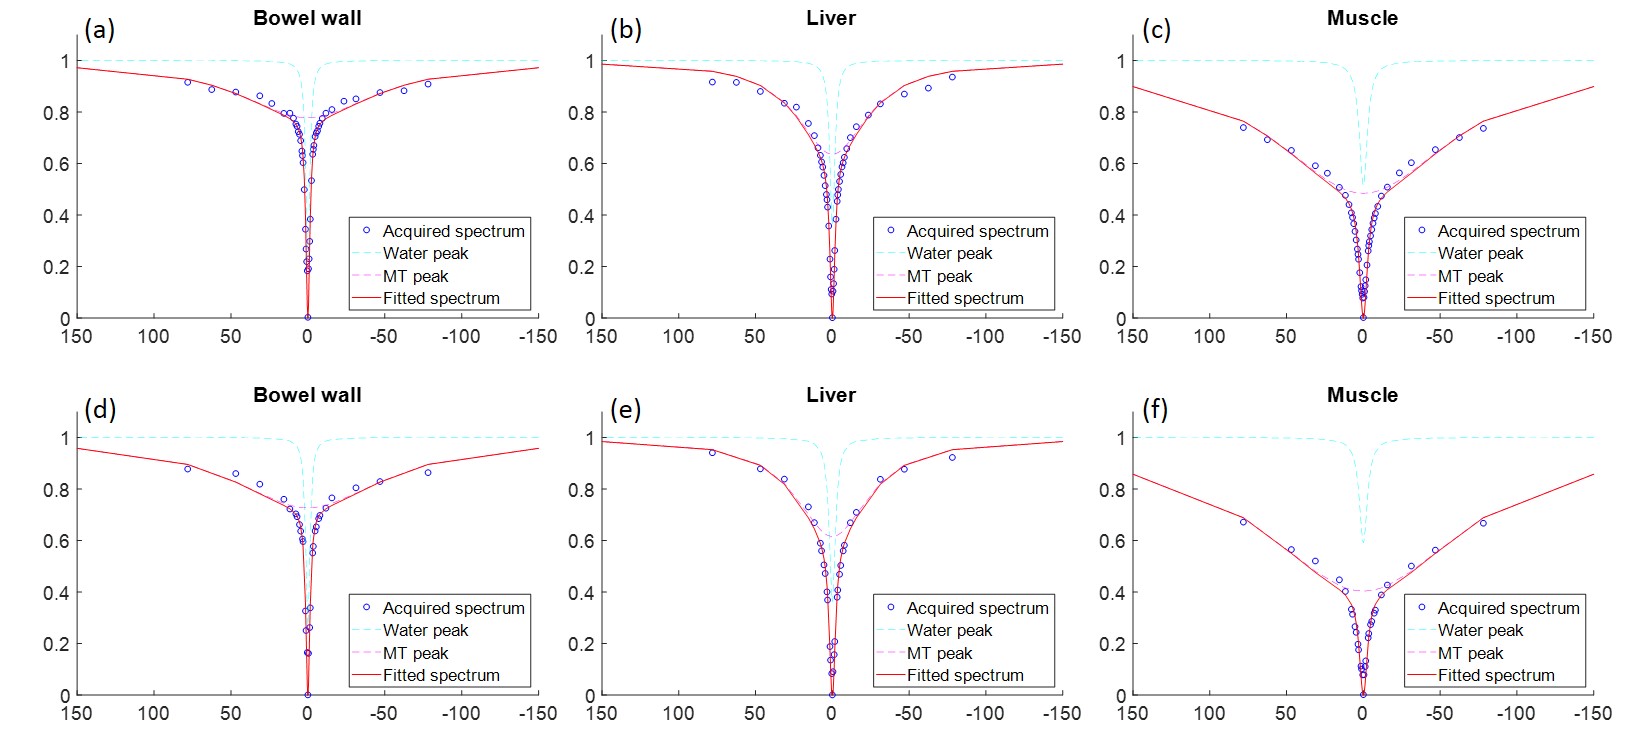
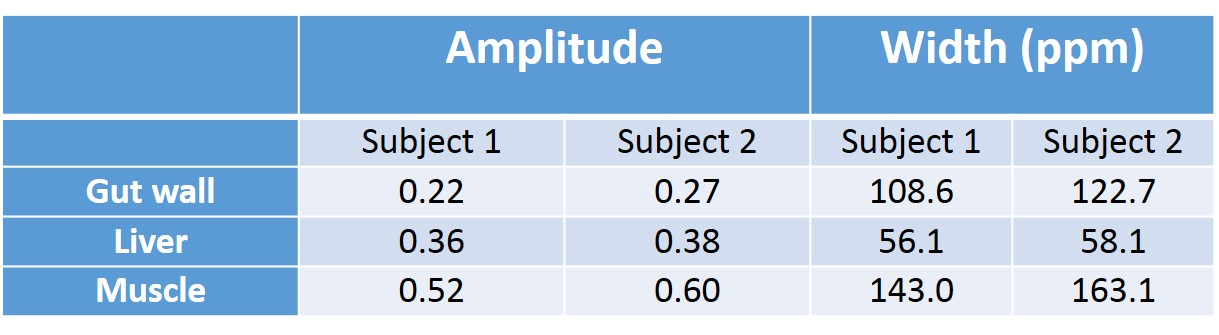
Figure 2 shows z-spectra from the 3 ROIs in both subjects, with a further spectrum in figure 3 from the liver illustrating a typical spectrum acquired with standard respiratory gating. Spectra were smooth and show little signs of respiratory or motion artefacts. Figure 4 shows the Lorentzian fit to the free water and the bound pool, and Table 1 shows the resulting parameters of this fit. The MT peak in various tissues was consistent across the two subjects.Discussion
We have developed a protocol for robust z-spectrum imaging in the abdomen and as far as we are aware we have presented the first z-spectrum of the gut wall and liver, optimized to assess MT, although an asymmetry spectrum has previously been presented for the liver at 3T. Specifically we have developed a pragmatic protocol to reduce motion artefacts and field offsets due to breathing. The results of the Lorentzian fit from 2 subjects suggest that we can reliably quantify MT in the gut wall using this breath-held acquisition of a z-spectrum. The z-spectra from each pixel needed to be B0 corrected by up to 2ppm and spectra acquired without breath holding were very noisy suggesting that conventional MT data acquired from the abdomen is likely to be noisy. While there is clearly more MT in abdominal muscle, the MT peak in the gut wall is of lower amplitude and wider compared to liver tissue, suggesting a smaller MT pool with a slower exchange rate, or shorter T2. It is however impossible to separate pool size and exchange rate without acquiring further saturation powers. The acquisition is limited by the Buscopan, which can only effectively freeze gut motion for ~10mins. Therefore if we wanted to acquire additional spectra with varying saturation powers, it would be necessary to decrease the spectral resolution, which would probably be reasonable for measuring MT.Conclusion
We are successfully able to measure and quantify MT in the bowel wall through acquisition of the z-spectrum, and have developed a protocol capable of eliminating respiratory artefacts which have the potential to invalidate MT abdominal imaging.Acknowledgements
Andrew Carradus holds a studentship from the Haydn Green FoundationReferences
1 Pazahr, S., Blume, I., Frei, P., Chuck, N., Nanz, D., Rogler, G., ... & Boss, A. (2013). Magnetization transfer for the assessment of bowel fibrosis in patients with Crohn’s disease: initial experience. Magnetic Resonance Materials in Physics, Biology and Medicine, 26(3), 291-301.
2 Andrew John Carradus, Simon Shah, Olivier Mougin, Caroline Hoad, Penny Gowland. Magnetisation transfer in human liver and kidney through acquisition of the z-spectrum. ISMRM abstract 2018
3 Mougin, O., Clemence, M., Peters, A., Pitiot, A., & Gowland, P. (2013). High‐resolution imaging of magnetisation transfer and nuclear Overhauser effect in the human visual cortex at 7 T. NMR in Biomedicine, 26(11), 1508-1517.
Figures