1672
Pulsatility and Resistivity Indices in Mesenteric Vasculature in Patients Suspected of Chronic Mesenteric Ischemia using 4D Flow MRI1Medical Physics, University of Wisconsin - Madison, Madison, WI, United States, 2Radiology, University of Wisconsin - Madison, Madison, WI, United States
Synopsis
Chronic mesenteric ischemia (CMI) causes blood flow reduction in the intestines, often due to atherosclerosis. This study uses 4D flow MRI to quantify and compare pulsatility (PI) and resistivity indices (RI) in
Introduction
Chronic mesenteric ischemia (CMI) is a rare disease caused by reduced blood flow to the intestines, often the result of atherosclerotic lesions occluding proximal segments of mesenteric vasculature (more than 95% of cases)1. CMI is characterized by postprandial abdominal pain, occurring 15-60 minutes after meal ingestion. It is theorized that the relatively early onset of pain (well before food has reached the small bowel) is caused by diversion of blood flow from the superior mesenteric artery (SMA) to the celiac artery (CA) to supplement increased gastric blood flow demand, termed “gastric steal” phenomenon2. In individuals with compromised splanchnic circulation, decreased flow in the SMA leads to downstream vasoconstriction, ischemia, and pain. 2D-PC has shown reduced postprandial splanchnic blood flow responses in CMI patients3–5. We recently introduced 4D Flow MRI with a meal challenge for a more comprehensive hemodynamic analysis for CMI6,7. Here, we expand the analysis of postprandial flow responses to measures of pulsatility and resistivity indices, which have been shown to reflect downstream vascular resistance in other vascular territories.Methods
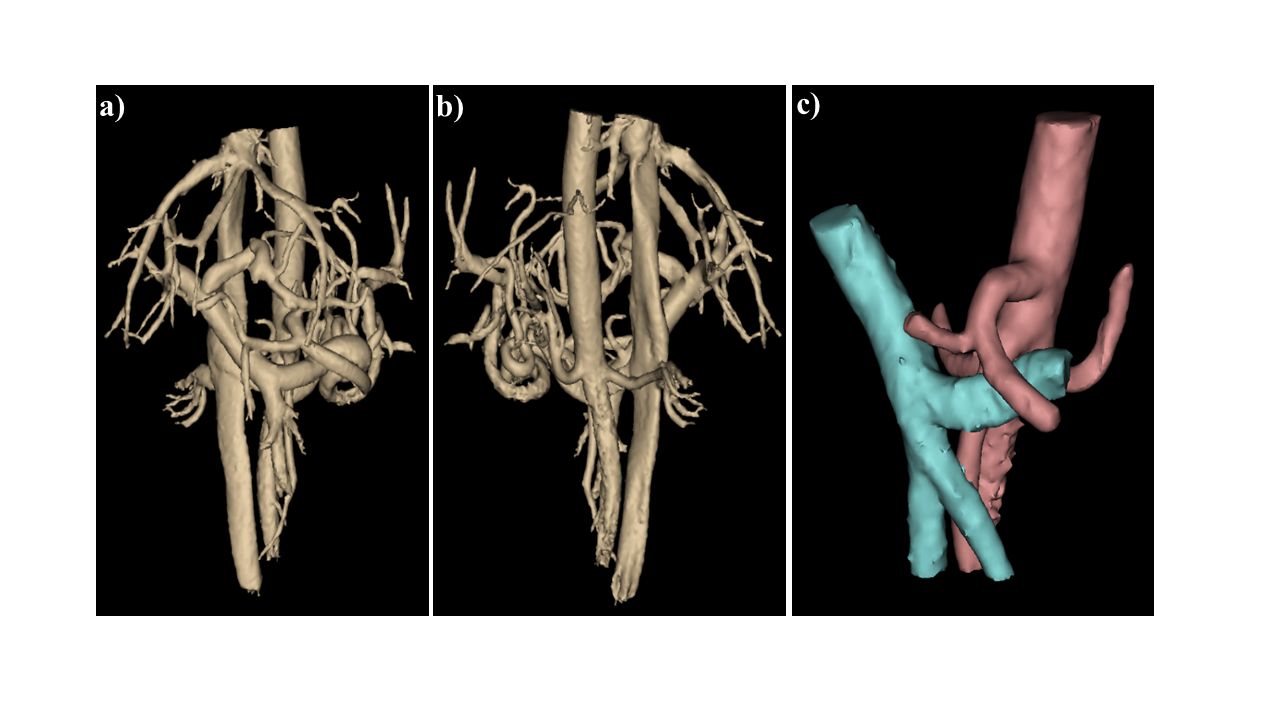
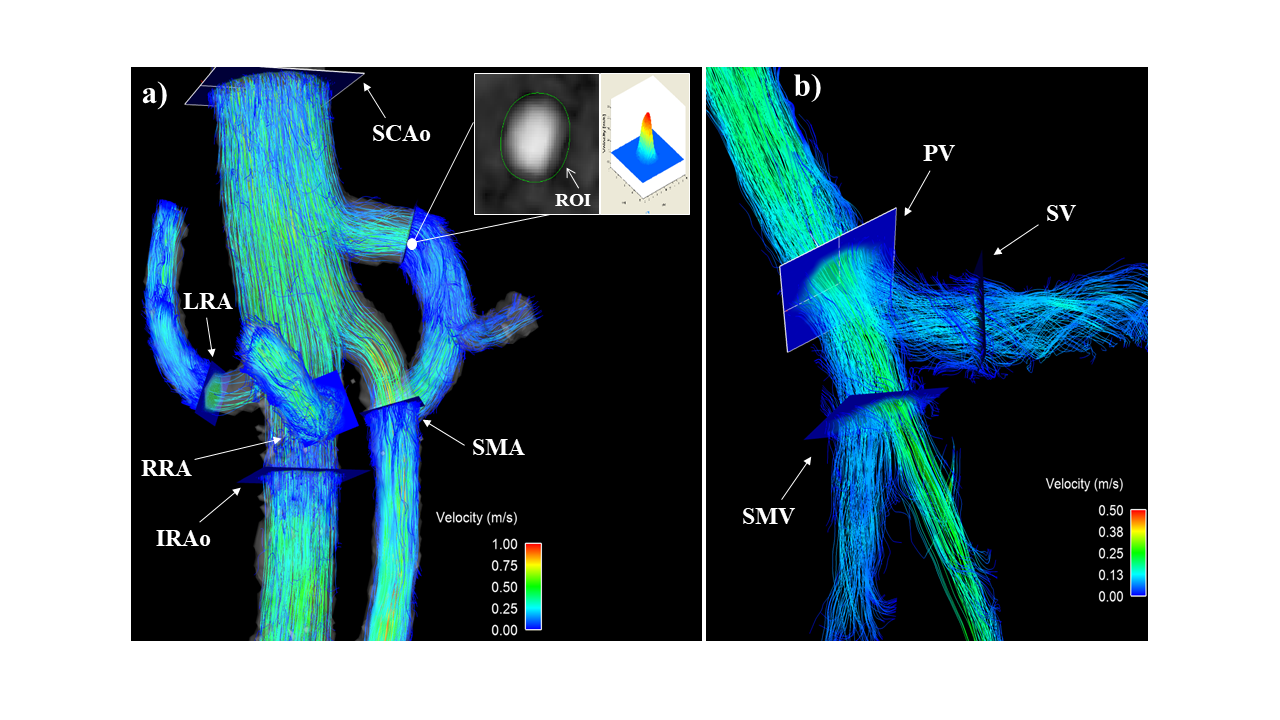
In this patient-compliant and IRB-approved study, 20 healthy volunteers (age range 19-73y, mean=44y, females=8) and 19 patients (age range 21-86y, mean=50y, females=14) with a suspicion of CMI were imaged on clinical 1.5T and 3.0T scanners (GE Healthcare, Waukesha, WI). For all subjects, 4D PC-MR data were acquired before and after ingestion of a meal using radially-undersampled PC-VIPR acquisition8,9 with full volumetric coverage of the upper abdomen: imaging volume: 32x32x24cm spherical; 1.25mm isotropic resolution; TR/TE=6.6-8.3ms/1.9-2.7ms; tip angle=6-15°; Venc=100-120cm/s; intravascular contrast agent (0.03mmol/kg gadofosveset trisodium (Lantheus, N. Billerica, MA)); with retrospective ECG and respiratory gating. Pre-prandial imaging was performed after 5 hours of fasting. After the first scan, subjects orally ingested 474 mL EnSure Plus® (Abbot Laboratories, Columbus, OH) and scanning was resumed 20 minutes after ingestion. 3D vessel segmentation from the PC data was performed using Mimics (Materialize, Leuven, Belgium), shown in Figure 2. Ensight (ANSYS, Canonsburg, PA) was used for plane placement and flow visualization (Figure 3). Cut planes were placed in 6 arterial vessels: supraceliac aorta (SCAo), infrarenal aorta (IRAo), CA, SMA, right renal (RRA), and left renal artery (LRA). Additionally, planes were placed in 3 venous vessels: splenic (SV), superior mesenteric (SMV), and portal vein (PV). Cut-planes were exported to a customized software package10 for manual temporal segmentation throughout the cardiac cycle. Pulsatility and resistivity indices were automatically computed from the flow waveforms and were calculated for each subject. After data analysis, diagnoses for the patient group were given. The patient group was then subdivided into a true CMI group (N=6) and negative diagnosis group (N=13) based on these diagnoses. RI and PI indices were compared between controls and patient subgroups using a two-tailed Welch t-test. For all statistical tests, p<0.05 was chosen to reflect statistical significance.Results
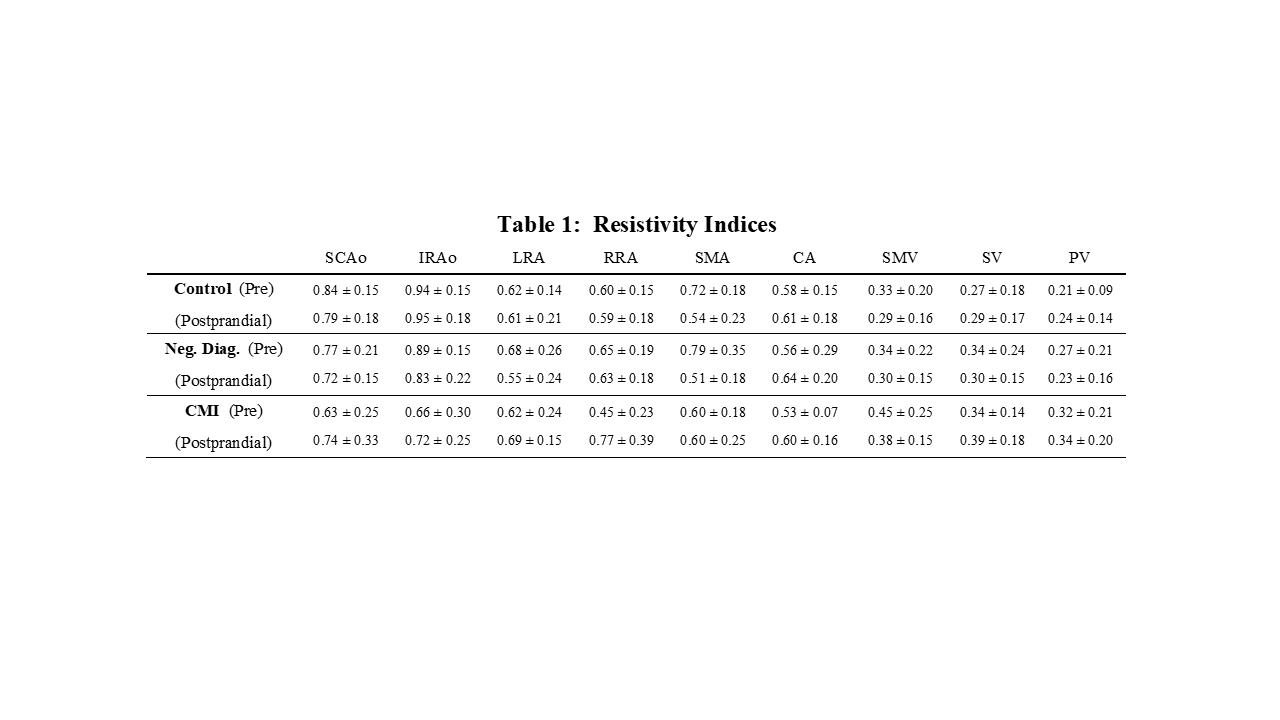
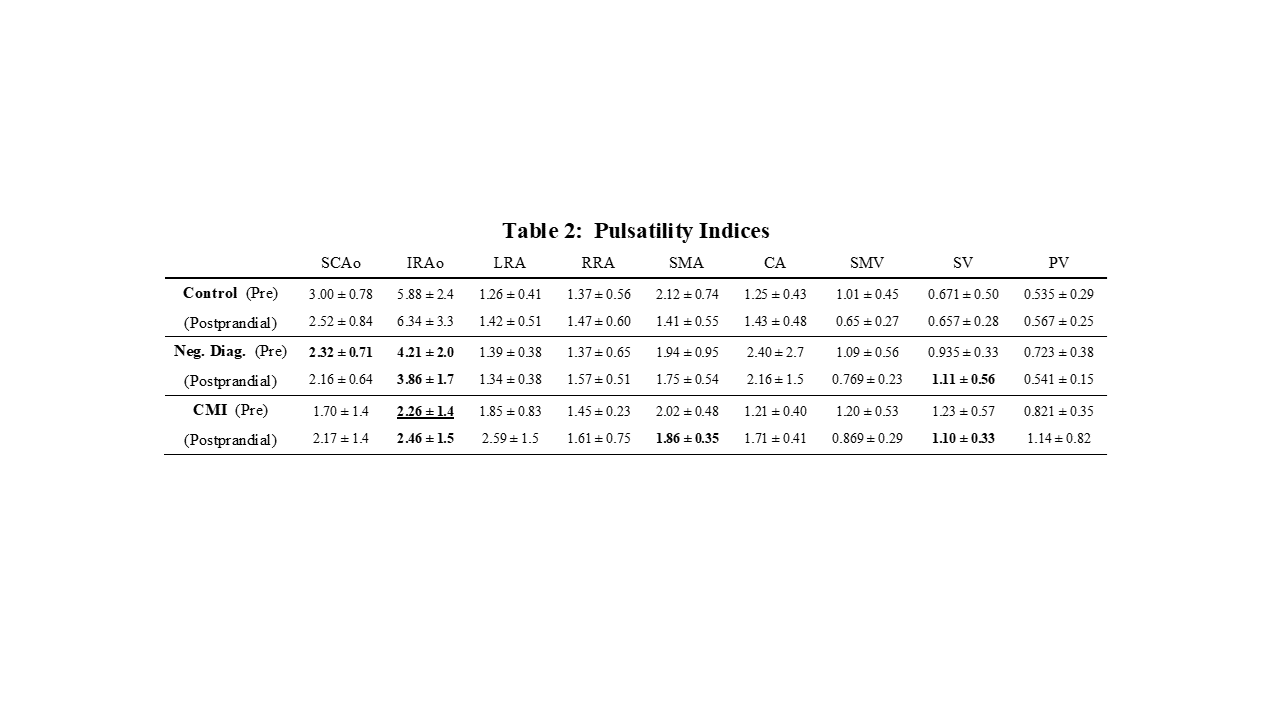
4D flow data were successfully obtained for all 39 subjects (Table 1-2). SCAo preprandial PI for the negative diagnosis group was significantly lower compared to healthy subjects (p=0.018), but this relationship was not seen in the CMI-group (p=0.115). Preprandial IRAo PI for the CMI group was significantly lower than the healthy control group (p=9.64e-04) and the negative diagnosis group (p=0.039). Likewise, preprandial IRAo PI for the negative diagnosis group was lower than healthy controls (p=0.048). Similarly, postprandial IRAo PI for the CMI group was significantly lower than for the healthy controls (p=0.002) but was not lower for the negative diagnosis group (p=0.131). However, postprandial IRAo PI for the negative diagnosis group was significantly lower than for the healthy control group (p=0.013). Compared to the control group, postprandial SMA PI for the CMI group was significantly higher (p=0.033). This was not the case for the negative diagnosis group (p=0.105). Postprandial SV pulsatility indices for the CMI group (p=0.024) and negative diagnosis group (p=0.021) were significantly higher than healthy controls. Resistivity indices (for any vessel) were not significantly different between groups.Discussion
In this work, we investigated PI and RI as measures of vascular resistance. Significantly increased postprandial SMA PI for the ischemia group suggests higher downstream vascular resistance after a meal, supporting the “gastric steal” theory2. Average PI in the aortic segments (SCAo and IRAo) were highest among healthy control subjects, were decreased in the negative diagnosis group, and were lowest in the ischemia group, possibly reflecting progressive worsening of the atherosclerotic disease between subgroups.Conclusion
Along with flow measurements, pulsatility may provide additional hemodynamic information into downstream vascular resistance, which could aid in the challenging diagnosis of CMI.Acknowledgements
No acknowledgement found.References
1. Sreenarasimhaiah J. Chronic mesenteric ischemia. Best Pract Res Clin Gastroenterol 2005;19:283–295.
2. Poole JW, Sammartano RJ, Boley SJ. Hemodynamic basis of the pain of chronic mesenteric ischemia. Am J Surg 1987;153:171–6.
3. Li KCP, Whitney WS, McDonnell CH, et al. Chronic mesenteric ischemia: evaluation with phase-contrast cine MR imaging. Radiology 1994;190:175–179.
4. Burkart DJ, Johnson CD, Reading CC, Ehman RL. MR measurements of mesenteric venous flow: prospective evaluation in healthy volunteers and patients with suspected chronic mesenteric ischemia. Radiology 1995;194:801–806.
5. Li KCP, Hopkins KL, Dalman RL, Song CK. Simultaneous measurement of flow in the superior mesenteric vein and artery with cine phase-contrast MR imaging: value in diagnosis of chronic mesenteric ischemia. Work in progress. Radiology 1995;194:327–330.
6. Wieben O, Roldan-Alzate A, Reeder SB, et al. 4D Flow MRI for non-invasive assessment of Mesenteric Ischemia. In: Proceedings of the 21st Annual Meeting of ISMRM, Salt Lake City, 2013. (pp 63).
7. Roberts GS, Roldan-Alzate A, Francois CJ, Wieben O. Non-Invasive Assessment of Mesenteric Hemodynamics with 4D flow MRI. In: Proceedings of the 26th Annual Meeting of ISMRM, Paris, 2018. (abstract 2536).
8. Gu T, Korosec FR, Block WF, et al. PC VIPR: A high-speed 3D phase-contrast method for flow quantification and high-resolution angiography. AJNR Am J Neuroradiol 2005;26:743–749.
9. Johnson KM, Lum DP, Turski PA, et al. Improved 3D phase contrast MRI with off-resonance corrected dual echo VIPR. Magn Reson Med 2008;60:1329–1336.
10. Stalder AF, Russe MF, Frydrychowicz A, Bock J, Hennig J, Markl M. Quantitative 2D and 3D phase contrast MRI: optimized analysis of blood flow and vessel wall parameters. MRM 2008;60:1218–1231.
Figures