1664
Quantitative dynamic contrast-enhanced MR imaging for prediction of the response to gemcitabine in pancreatic ductal adenocarcinoma: a preliminary study1Radiology, Fudan University Shanghai Cancer Center, Shang Hai, China, 2Siemens Healthcare, MR Collaborations NE Asia, Shanghai, China, Shang Hai, China
Synopsis
This study aimed to explore the feasibility of dynamic contrasted enhancement MRI (DCE-MRI) for predicting the response to gemcitabine in pancreatic ductal adenocarcinoma, as well as the influence of different region of interests (ROIs) on quantitative parameters. We compared the differences of DCE-MRI parameters between responders and non-responders. Kep based on periphery ROI was the best predictive marker, showed the highest areas under ROC curve (AUC) of 0.806. Quantitative DCE-MRI may be a feasible method, and the parameters are useful for the prediction of response to gemcitabine in patients with PAC. The positions of ROI influenced the DCE-MRI parameters.
Introduction/Purpose
Gemcitabine was always the mainstay of first-line therapy for advanced pancreatic ductal adenocarcinoma(PDA)[1]. However, gemcitabine resistance in some patients would develop within weeks of chemotherapy initiation, however, there is no precise and noninvasive method to predict the resistance. This study aims to investigate the role of quantitative parameters of dynamic contrasted enhancement magnetic resonance imaging (DCE-MRI) in the prediction of response to gemcitabine in PDA, and to evaluate the influence of region of interest (ROI) positions on quantitative parameters.Method
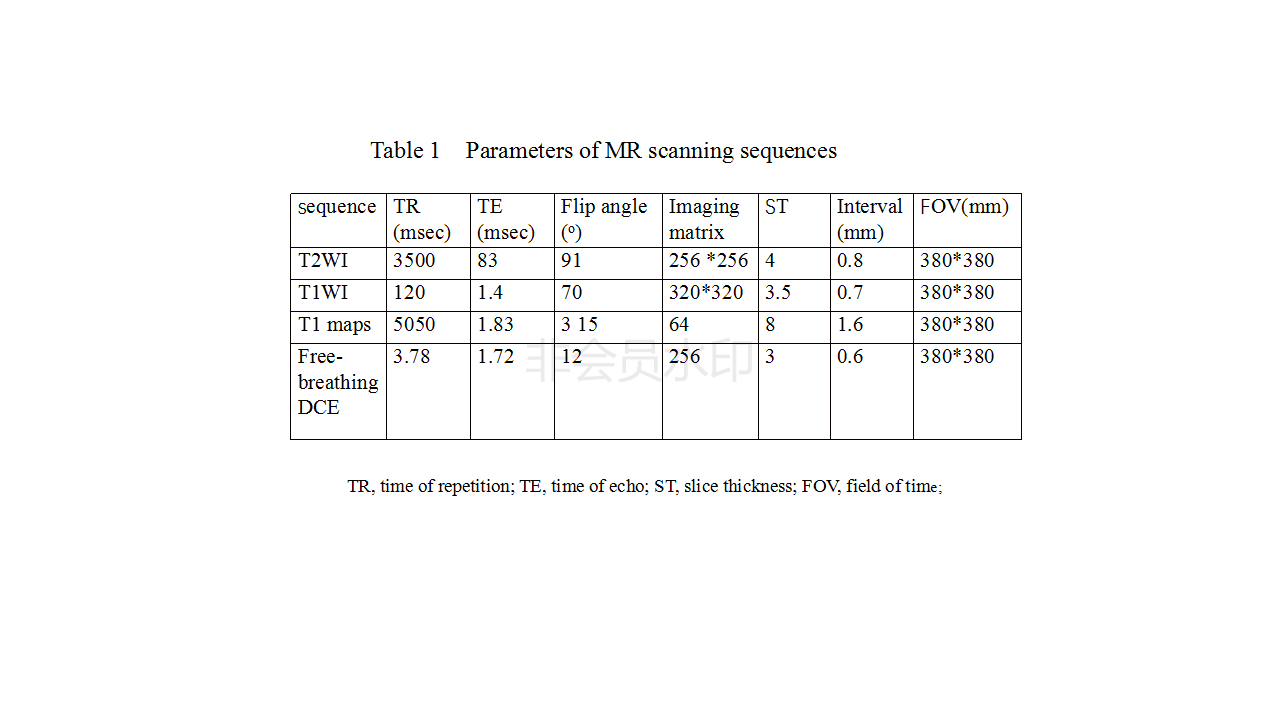
Forty patients with histologically confirmed PAC who underwent quantitative DCE-MRI were retrospectively analyzed. All the data were collected on a MAGNETOM Skyra 3T MR scanner (Siemens Healthcare, Erlangen, Germany) with an dedicated 18-channel body coil and integrated with a 32-channel integrated spine coil.The MR images included T2-weighted imaging with BLADE sequences, unenhanced T1-weighted imaging with 3D GRE volumetric interpolated breath-hold examination (VIBE), T1 maps obtained by conventional VIBE sequences with flip angle of 3o and 15o, and dynamic contrasted enhancement scanning with free-breathing golden-angle radial VIBE sequence, which had proven to be feasible to perform DCE-MR analysis[2, 3]. The scanning parameters were list in Table 1.
All patients were divided into two groups (responders, 27 patients; and non-responders, 13 patients) based on Response Evaluation Criteria in Solid Tumors 1.1 (RECIST 1.1). DCE-MRI parameters including volume transfer coefficient (Ktrans), extracellular extravascular volume fraction(ve), the rate constant (kep) and initial area under the concentration curve in 60 seconds (iAUC60) were measured and compared. DCE-MRI parameters were obtained using four different ROIs, which were located at periphery, core, one single slice region of tumor and adjacent non-tumoral region, respectively. Two independent sample t test, paired t test, intraclass correlation coefficient (ICC), and receiver characteristic (ROC) curves were used for statistical analysis.
Results
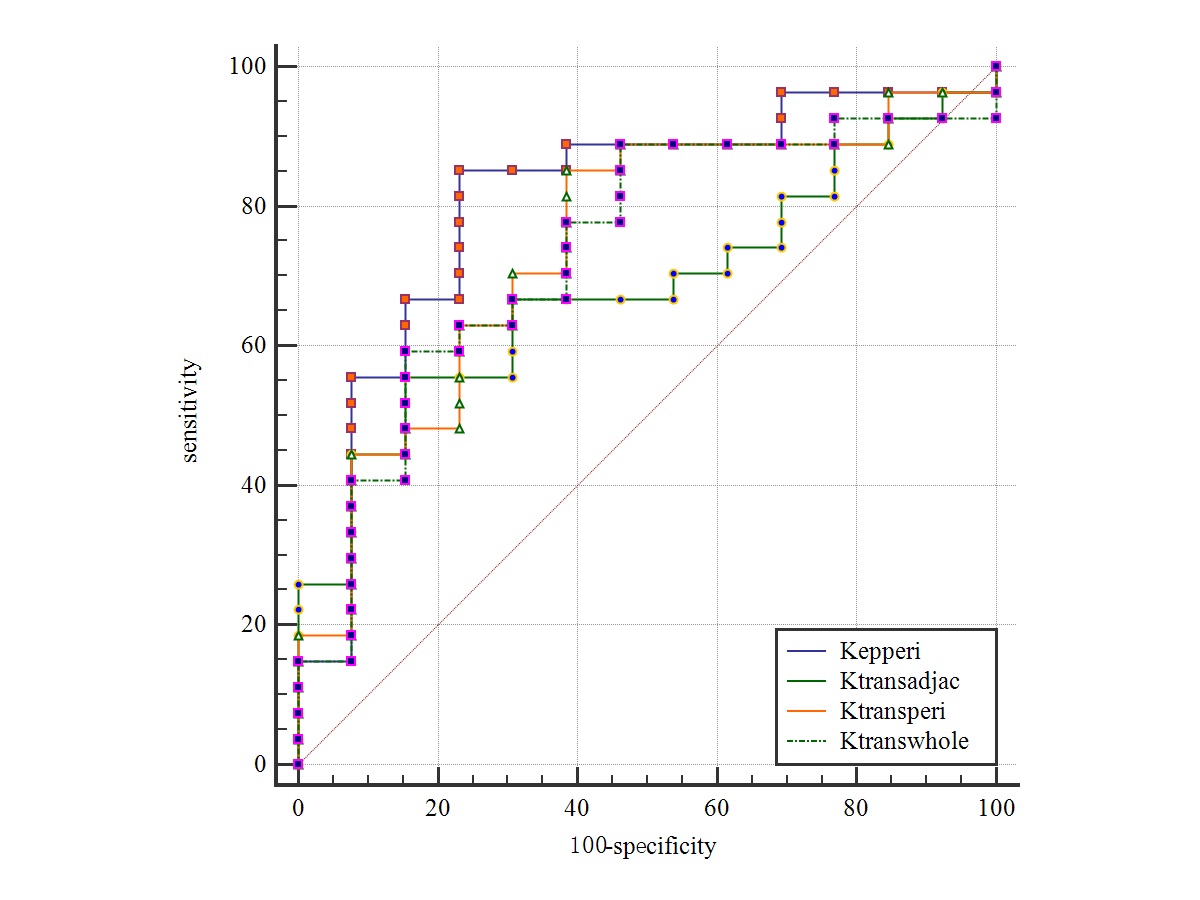
Mean values of Ktrans in responders with peripheral, whole slice, and adjacent non-tumoral regions ROIs were significantly higher than that in non-responders (P = 0.015, 0.043, and 0.025, respectively). Responders showed a significantly higher kep with peripheral area ROI compared with non-responders (P = 0.013). Ve and iAUC60 with all ROIs were not significantly different between responders and non-responders (P = 0.140,0.968). Kep with periphery ROI showed the highest areas under ROC curve (AUC) of 0.806, with the sensitivity, and specificity of 77% and 85%, respectively. There were statistically significant differences for DCE-MRI parameters among four ROIs (P< 0.05). All parameters showed a good to excellent intra- and interobserver repeatability.Discussion
In our study, Ktrans of PDA lesion was obviously higher in responders than in non-responders of gemcitabine therapy, which was similar with some previous study[4,5]. Besides, kep based on peripheral region ROI in responders was also higher than in non-responders, which also could be explained by the negative correlation between the kep and fibrosis. We also found the Ktrans based on adjacent non-tumorous region ROI in responders was higher than in non-responders. In addition, we found that the quantitative parameters were all higher in the edge of tumor ROI than in the core of tumor. All parameters showed a good to excellent intra- and interobserver repeatability, which meant using DCE-MRI technique to predict the response to gemcitabine in PDA is effective and reasonable. DCE-MRI parameters can non-invasively reflect the biological behaviors or heterogeneous information of PDA, and can be used for the prediction of response to gemcitabine.
Conclusion
Quantitative parameters derived from DCE-MRI might be a potential predictor of response to gemcitabine in patients with PAC. The positions of ROI will influence the parameters in DCE-MRI.Acknowledgements
This study was supported in part by grants from Shanghai Health and Family Planning Commission Youth Fund Project (20174Y0242).References
1.Burris H R, Moore M J, Andersen J, et al. Improvements in survival and clinical benefit with gemcitabine as first-line therapy for patients with advanced pancreas cancer: a randomized trial[J]. J Clin Oncol, 1997,15(6):2403-2413.
[2] Li H H, Zhu H, Yue L, et al. Feasibility of free-breathing dynamic contrast-enhanced MRI of gastric cancer using a golden-angle radial stack-of-stars VIBE sequence: comparison with the conventional contrast-enhanced breath-hold 3D VIBE sequence[J]. Eur Radiol, 2018,28(5):1891-1899.
[3] Garcia-Cremades M, Pitou C, Iversen P W, et al. Predicting tumour growth and its impact on survival in gemcitabine-treated patients with advanced pancreatic cancer[J]. Eur J Pharm Sci, 2018,115:296-303.
[4] Akisik M F, Sandrasegaran K, Bu G, et al. Pancreatic cancer: utility of dynamic contrast-enhanced MR imaging in assessment of antiangiogenic therapy[J]. Radiology, 2010,256(2):441-449.
[5]Park M S, Klotz E, Kim M J, et al. Perfusion CT: noninvasive surrogate marker for stratification of pancreatic cancer response to concurrent chemo- and radiation therapy[J]. Radiology, 2009,250(1):110-117.
Figures
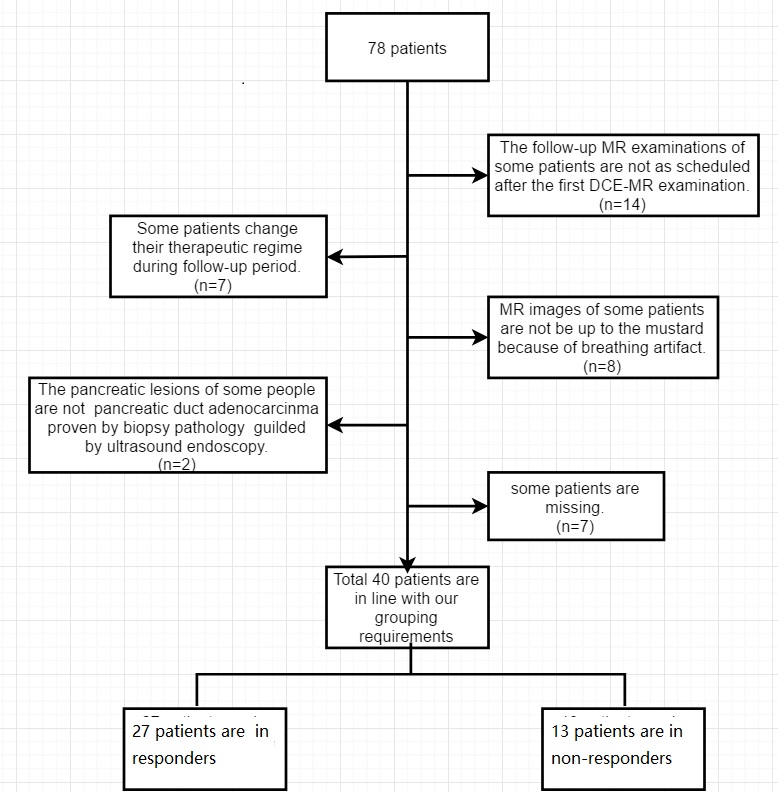
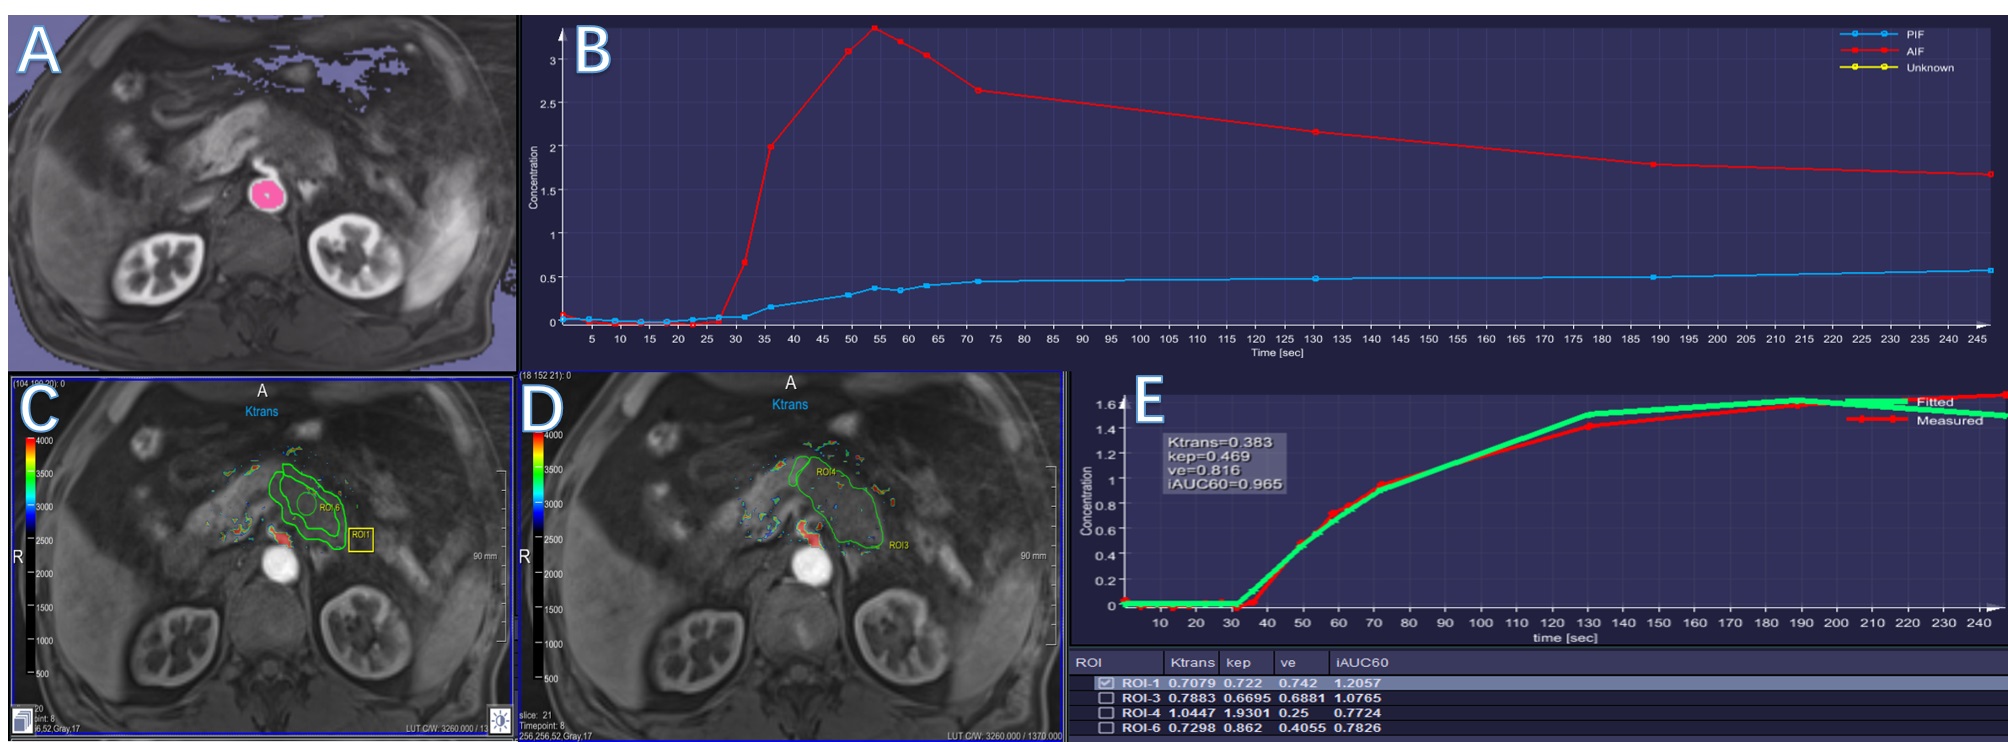
Fig 2 The delineation of different ROIs
A, the region used to compute the artery input function (AIF); B, the AIF curve;C, the ROIs placements in tumorous peripheral and core region; D, the ROIs located at the whole slice of tumor and the adjacent non-tumorous region; E, the quantitative parameters of DCE-MR in different ROIs.
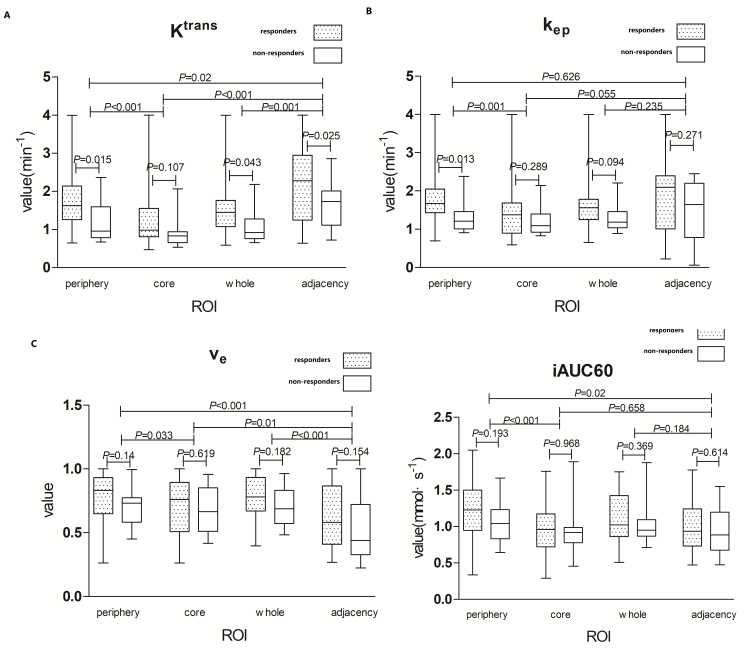
Fig 3 Comparisons of different quantitative parameters of DCE-MR between responders ,non-responders and different ROIs.The rectangle filling with pot is on behalf of the responders, and the blank rectangle is on behalf of the non-responders.