1663
MRI Relaxometry: Comparing R2* Values in Liver and Pancreas with respect to Disease Characteristics1Dept. for Diagnostic and Interventional Radiology, Ulm University, Medical Center, Ulm, Germany, 2Section for Experimental Radiology, Ulm University, Medical Center, Ulm, Germany, 3Siemens Healthcare, Erlangen, Germany, 4Clinic for Pediatric and Adolescent Medicine, Ulm University, Medical Center, Ulm, Germany
Synopsis
To study pancreatic iron accumulation in liver overloaded patients with respect to disease characteristics, 116 patients were investigated at 1.5 T MRI with a prototype breathhold 3D GRE protocol with in-line R2*calculation. Mean R2* values were determined in liver and pancreas by manually drawn ROIs. Pancreatic R2* values were correlated with liver R2* in patient subgroups according to transfusion frequency. Pancreatic R2* correlated significantly to liver R2* for sporadic or frequently transfused patients, was normal in patients requiring no transfusion, and elevated in most regular transfused patients. After bone marrow transplant, most patients showed only slightly raised pancreatic R2*.
Purpose
To study pancreatic iron accumulation in relation to liver iron in patient subgroups according to transfusion frequency.Methods
116 patients (51 f, 65 m, age range 2 to 60 y, mean ± SD: 22 ± 14 y) suspected for liver iron overload were investigated by 1.5 T MRI (MAGNETOM Avanto, Siemens Healthcare, Erlangen, Germany). Fifty-six transversal partitions of 4 mm thickness (no gap) at 2.5x2.5 mm voxel size were acquired by means of a breathhold 3D GRE protocol at minimum TE and TE spacing of 1.2 ms for the first five echoes (TE=1.2 to 6 ms), a sixth echo was acquired at TE of 9 ms. CAIPIRINHA technique (Controlled Aliasing In Parallel Imaging Results IN Higher Acceleration) was used with an acceleration factor of three to enable acquisition in a single breathhold1. The prototype implementation of this sequence determined R2* in-line for each voxel, accounting for signal modulation by fat/water-dephasing2. To obtain mean R2* values of liver and pancreas for each patient, three regions of interest (ROI) were manually placed each in liver and pancreatic tissue free of vessels and artifacts. Patients were divided into four subgroups according to transfusion frequency: 1) no transfusion, 2) sporadic and frequent transfusion, 3) regular transfusion, and 4) after bone marrow transplant (condition after transfusion). Scatter plots of pancreatic vs. liver R2* were generated, and linear regression tested for significance.Results
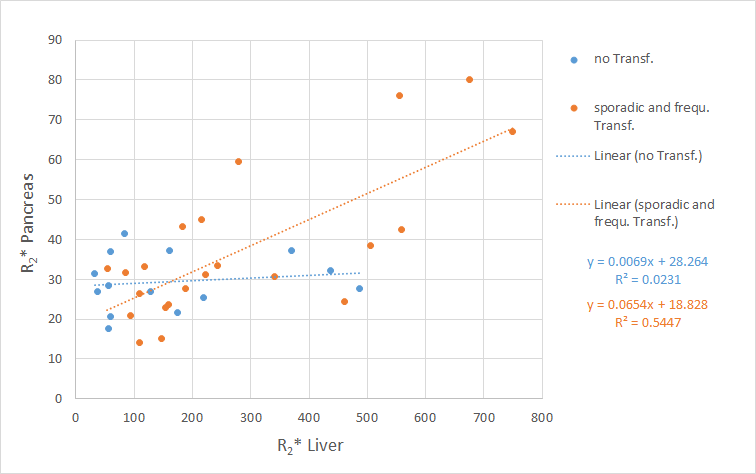
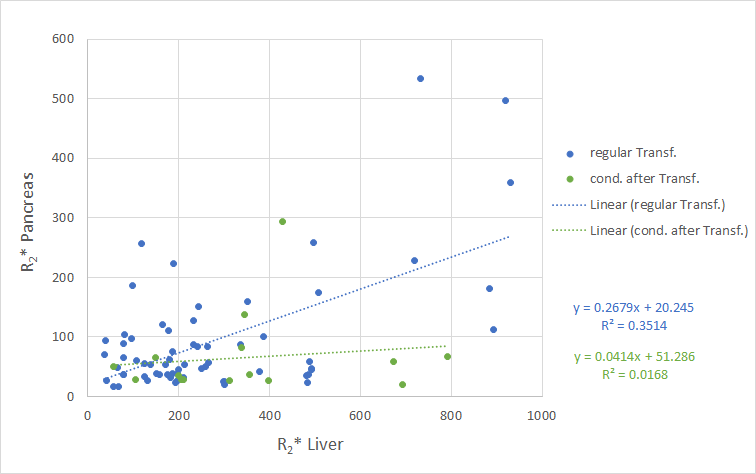
We found pancreatic R2* values between 18 and 41 s-1 in our group of patients with no transfusion (14 patients), whereas liver R2* ranged up to 486 s-1 in this group, shown in Fig. 1. This figure also shows a highly significant correlation (r=0.74, p<0.001) of pancreatic R2* (14-80 s-1) with liver R2* (32-750 s-1) in the group of sporadic and frequently transfused patients (22 patients). For regular transfused patients (65 patients), pancreatic R2* values of 16-533 s-1 with no correlation to liver R2* (36-930 s-1) were found, see Fig. 2. In patients with previous blood transfusions, pancreatic R2* was below 67 s-1 with three exceptions, independent of liver R2* (55-790 s-1).Discussion
Pancreatic R2* values are easily addressed with with 3D mulit-GRE imaging. For patients without blood transfusions, whose elevated liver iron content arose from iron resorption malfunction, like pyruvate kinase deficiency, near-normal pancreatic R2* values were found, despite the fact that some of these patients show substantially elevated liver iron content: liver R2* of 486 s-1 corresponds to 13 mg iron per gram liver dry tissue3, while the normal range is 0.17-1.8 mg/g. Only in the group of patients receiving sporadic or frequent transfusion, a correlation of pancreatic with liver R2* was found. This is in line with results of Noetzli et al.4. They found no correlation between R2* values in liver and pancreas for Thalassemia patients who require regular blood transfusions. Most patients after bone marrow transplant, requiring no transfusion any more, showed R2* values below 67 s-1, indicating efficiency of chelator therapy. Further studies are needed to evaluate probable relation of pancreatic R2* to its exocrine and endocrine function.Acknowledgements
No acknowledgement found.References
1. Breuer FA, Blaimer M, Mueller MF, et al. Controlled aliasing in volumetric parallel imaging (2D CAIPIRINHA). Magn Reson Med. 2006; 55(3): 549-556
2. Zhong X, Nickel MD, Kannengiesser SA,et al. Liver fat quantification using a multi-step adaptive fitting approach with multi-echo GRE imaging. Magn Reson Med. 2014; 72(5): 1353-1365
3. Wood JC, Enriquez C, Ghugre N, et al., MRI R2 and R2* mapping accurately estimates hepatic iron concentration in transfusion-dependent thalassemia and sickle cell disease patients. Blood 2005;106: 1460-1465
4. Noetzli LJ, Papudesi J, Coates TD, et al. Pancreatic iron loading predicts cardiac iron loading in thalassemia major. Blood 2009; 114(19): 4021-4026
Figures