1661
Pancreatic adenocarcinoma: Variability in measurements of tumor size among CT, MRI and pathologic specimenChao Ma1, Panpan Yang1, Yun Bian1, Jing Li1, Li Wang1, and Jianping Lu1
1Radiology, Changhai Hospital of Shanghai, Shanghai, China
Synopsis
The aim of the study is to investigate the measurements obtained from the preoperative contrast-enhanced both computed tomography (CT) and magnetic resonance imaging (MRI) with pathologic specimen in measuring the size of pancreatic cancer. It was found in this study, both contrast-enhanced CT and MRI underestimate mean tumor size by 3.3 mm and 4.7 mm respectively, when compared with the size of pathologic specimen.
INTRODUCTION
The recent 8th edition American Joint Committee on Cancer (AJCC) revealed tumor, node and metastases (TNM) system is preferred system for staging of Pancreatic adenocarcinoma (PDAC). The significance of tumor size was further emphasized, especially for further grouping of t1-stage PDAC. Consensus regarding which modality is optimal for the measurement of pancreatic cancer was not achieved although tumor size is important for clinical decisions 1,2. The purpose of the current was to compare the measurements obtained from the preoperative contrast-enhanced both computed tomography (CT) and magnetic resonance imaging (MRI) with pathologic specimen in measuring the size of pancreatic cancer.METHODS
A total of 78 patients who underwent both CT and MRI within 2 weeks before surgery and had detailed pathologic specimen measurements for review were evaluated retrospectively. The tumor size from both the CT and MRI was independently measured by a radiologist who was blinded to the pathology reports. The pathologic specimen sizes were obtained from the pathology reports. The size measured by each CT or MRI was compared with the pathologic size as a reference standard using Bland-Altman analysis and intraclass correlation coefficients (ICCs). The differences for the tumor sizes of PDAC among MRI, CT and pathology measurements were analyzed using Friedman test and post hoc analysis according to Conover.RESULTS
For the tumor sizes measurements of PDAC with CT or MRI, the mean difference (bias) and limits of agreement between imaging tumor size measurements and pathologic specimen were -3.3 [-27.4 - 20.9] mm for CT (ICC, 0.63), and -4.7 [-27.5 - 18.2] mm for MRI (ICCs, 0.64), respectively (Figure 1, Table 1). Friedman test results demonstrated a significant difference among the mean tumor size of three measurements (P = 0.002). Post hoc analyses results indicated statistically significant higher mean tumor size in pathologic specimen than that in CT or MRI (P < 0.017) (Figure 2). Additionally, the mean difference (bias) and limits of agreement between CT and MRI were 1.4 [-9.2 - 11.9] mm for the tumor sizes measurements of PDAC (ICC, 0.90), with significant correlation (Figure 3). There were no significant different for the mean difference of imaging tumor size measurements (CT or MRI) and pathologic specimen among the three tumor positions (Head, body and tail) (Figure 4). But the difference for tumor size between CT or MRI and pathologic specimen are relevantly large when PDAC is located in the pancreas body.DISCUSSION
Our results demonstrate that both contrast-enhanced CT and MRI underestimate mean tumor size by 3.3 mm and 4.7 mm respectively, when compared with the size of pathologic specimen. Two studies reported both CT and MRI underestimate tumor size for PDAC when compared with pathology specimens 1,2. In our study, CT underestimates tumor size by approximately 3.0 mm in median for resected PDAC. This underestimation is less than that found in the series by Arvold et al and Hall et al, who compared the primary tumor maximum dimension as seen on CT with that measured on the pathologic specimen with a median of 7 mm (n=87) and 4 mm (n=16) in difference, respectively. Additionally, our findings for the MRI underestimation tumor size by approximately 4.1 mm in median for resected PDAC, which is similar with that found in the series by Hall et al (a median of 4 mm (n=92) in difference). Based on MRI measurements, compared with Hall's findings, we chose axial T1 weighted images to measure the tumor size of PDAC, and Hall measured the maximum size of any direction on MRI scans. Therefore, the results of MRI measurements of PDAC sizes smaller than pathological size in our findings are similar to Hall's findings. In the tumor size measurements based CT scans, although Arnold et al and Hall et also used the maximum dimensional of any direction on CT images to measure the tumor size of PDAC, we performed tumor size measurements of PDAC on axial CT image. It was found that the difference between tumor size and pathological size was smaller than that reported by Arnold et al and Hall et al, which suggested that we need to further investigate the CT tumor size measurement of PDAC.CONCLUSION
In conclusion, the size estimated by CT or MRI has to be interpreted with caution, especially when PDAC is located in the pancreas body and are relevantly large. Therefore, the authors point to the need for better measurement guidelines on PADC to enhance clinical practice.Acknowledgements
This work was supported by the Natural Science Foundation of China (No. 81601468); Project of precision medical transformation application of SMMU (2017JZ42); the Key junior college of national clinical of China.References
- Hall WA, Mikell JL, Mittal P et al. Tumor size on abdominal MRI versus pathologic specimen in resected pancreatic adenocarcinoma: implications for radiation treatment planning. Int J Radiat Oncol Biol Phys. 2013 May 1;86(1):102-7.
- Arvold ND, Niemierko A, Mamon HJ, et al. Pancreatic cancer tumor size on CT scan versus pathologic specimen: implications for radiation treatment planning. Int J Radiat Oncol Biol Phys. 2011 Aug 1;80(5):1383-90.
Figures
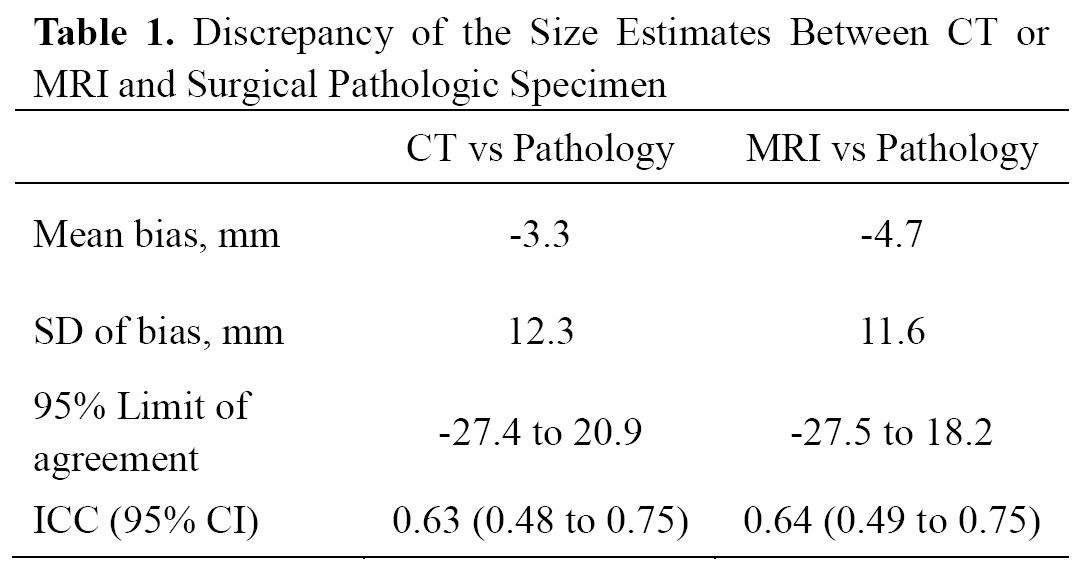
Table 1. Discrepancy of the Size Estimates Between CT or MRI and
Surgical Pathologic Specimen.
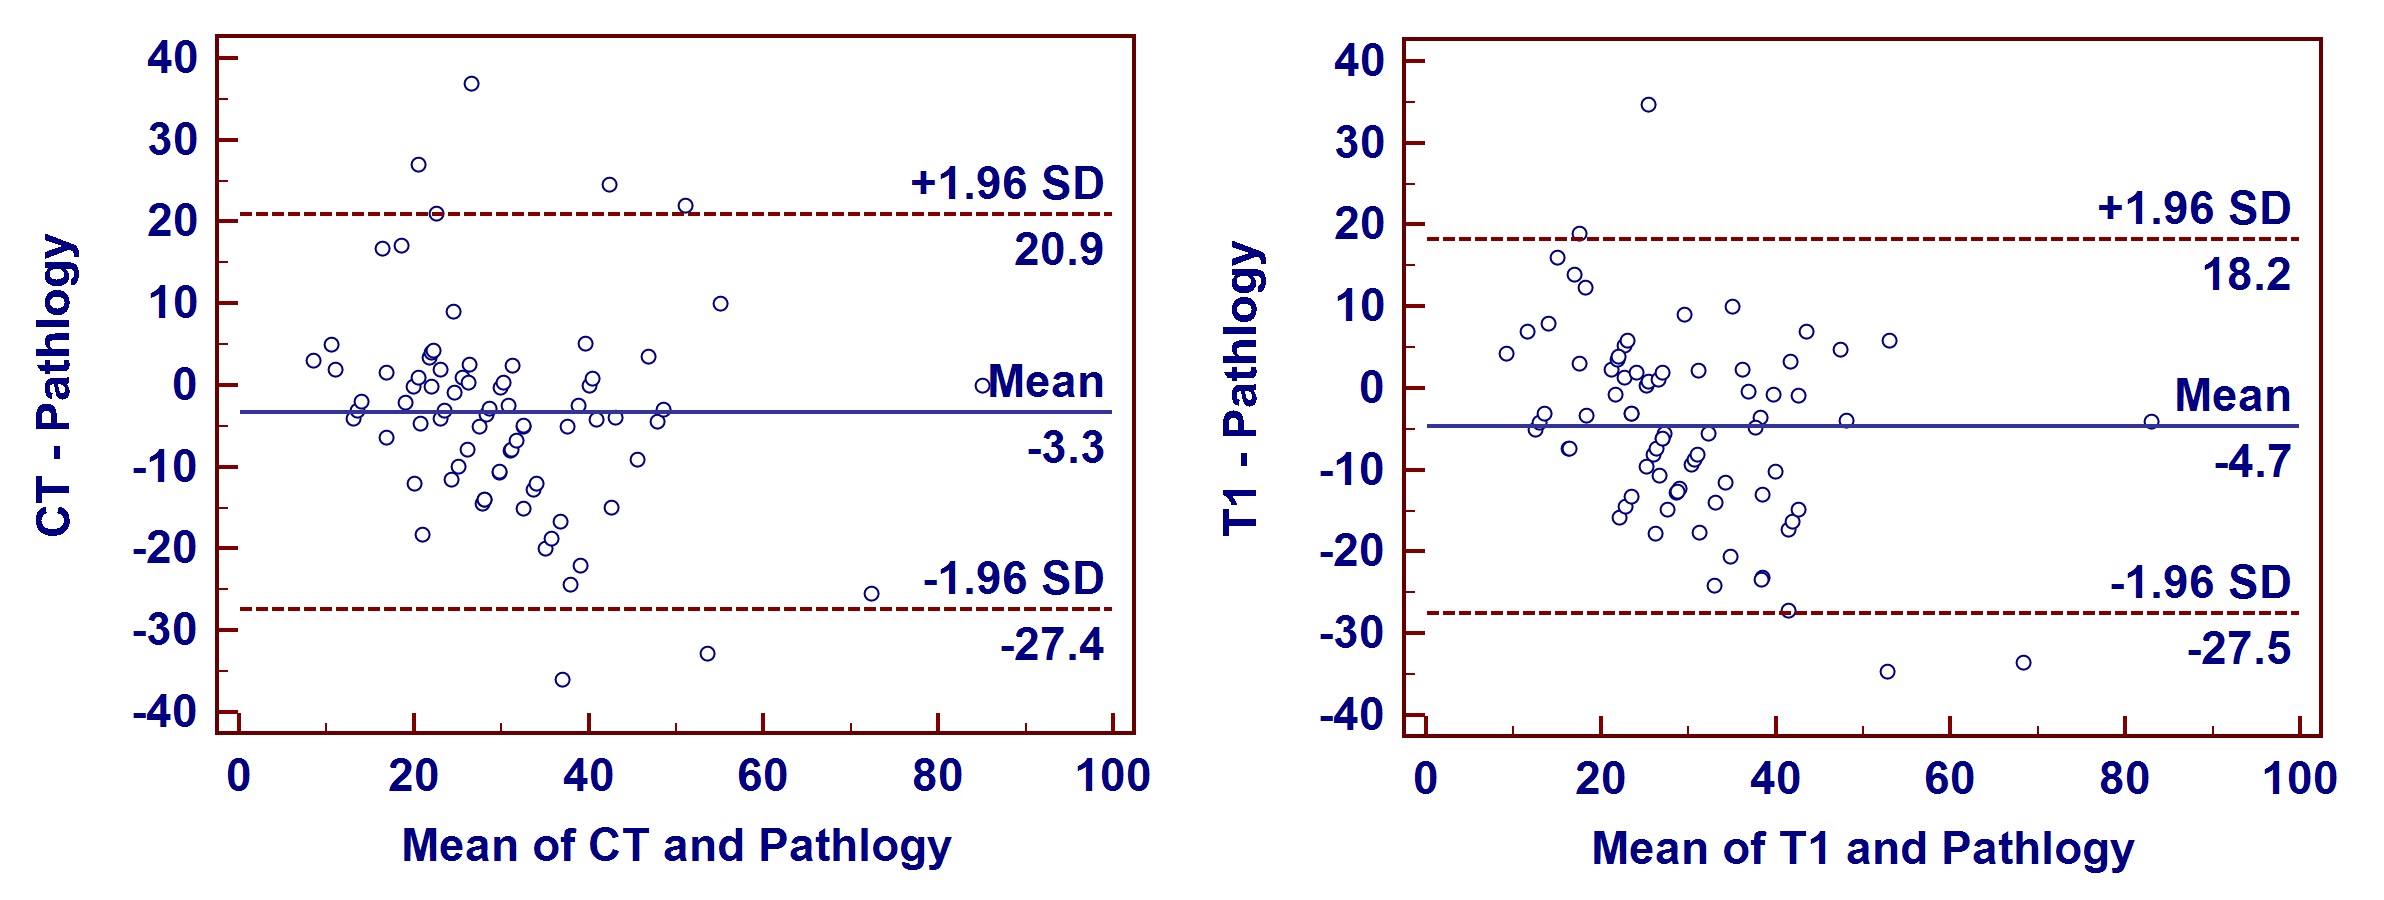
Figure 1. Bland-Altman plots for tumor size measured by
CT or MRI compared with the size of pathologic specimen.
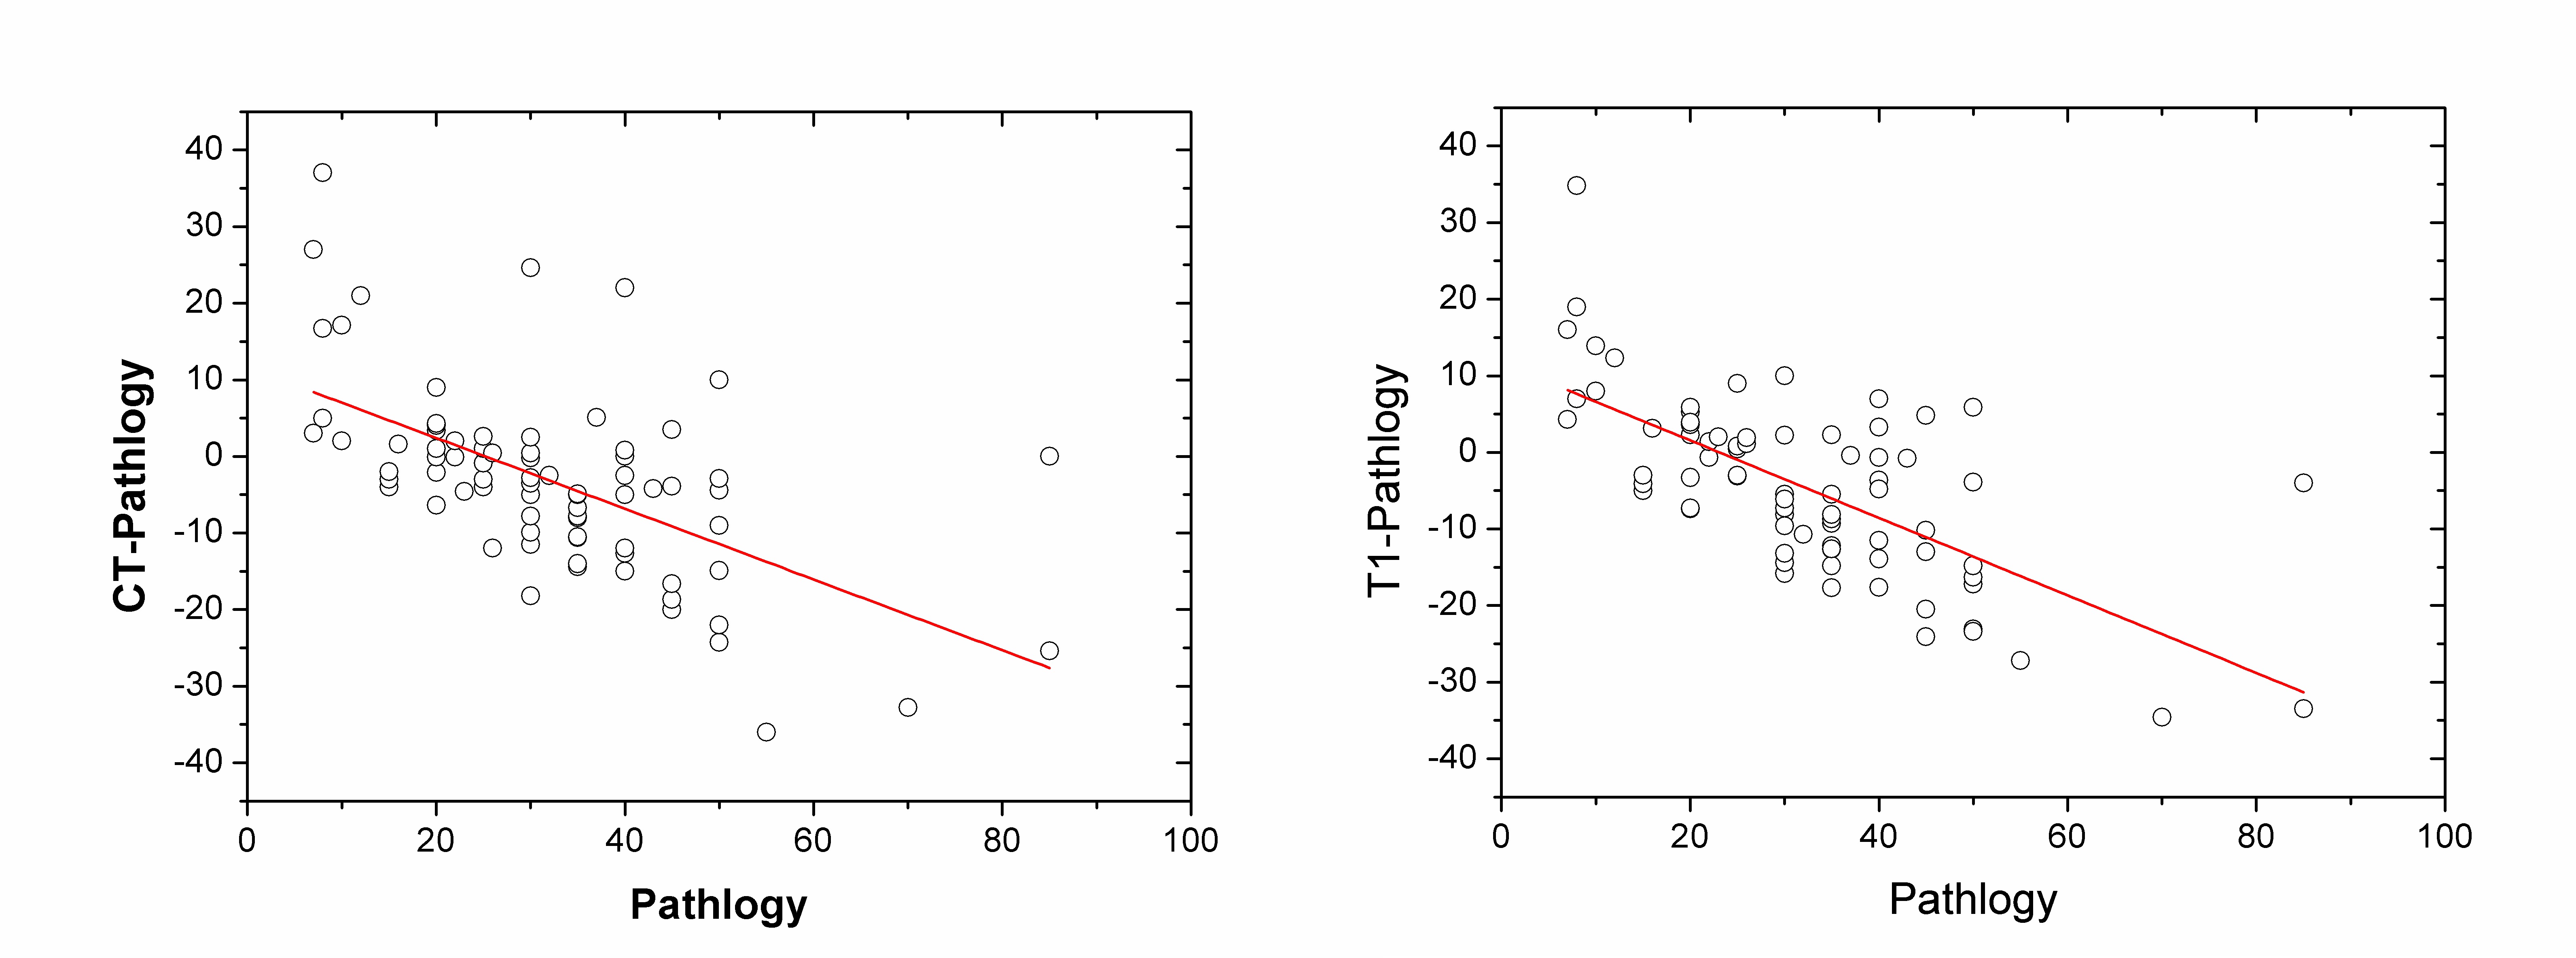
Figure 2.
Linear regression analysis between pathologic size and the difference of size
estimates from pathologic size by CT and by MRI.
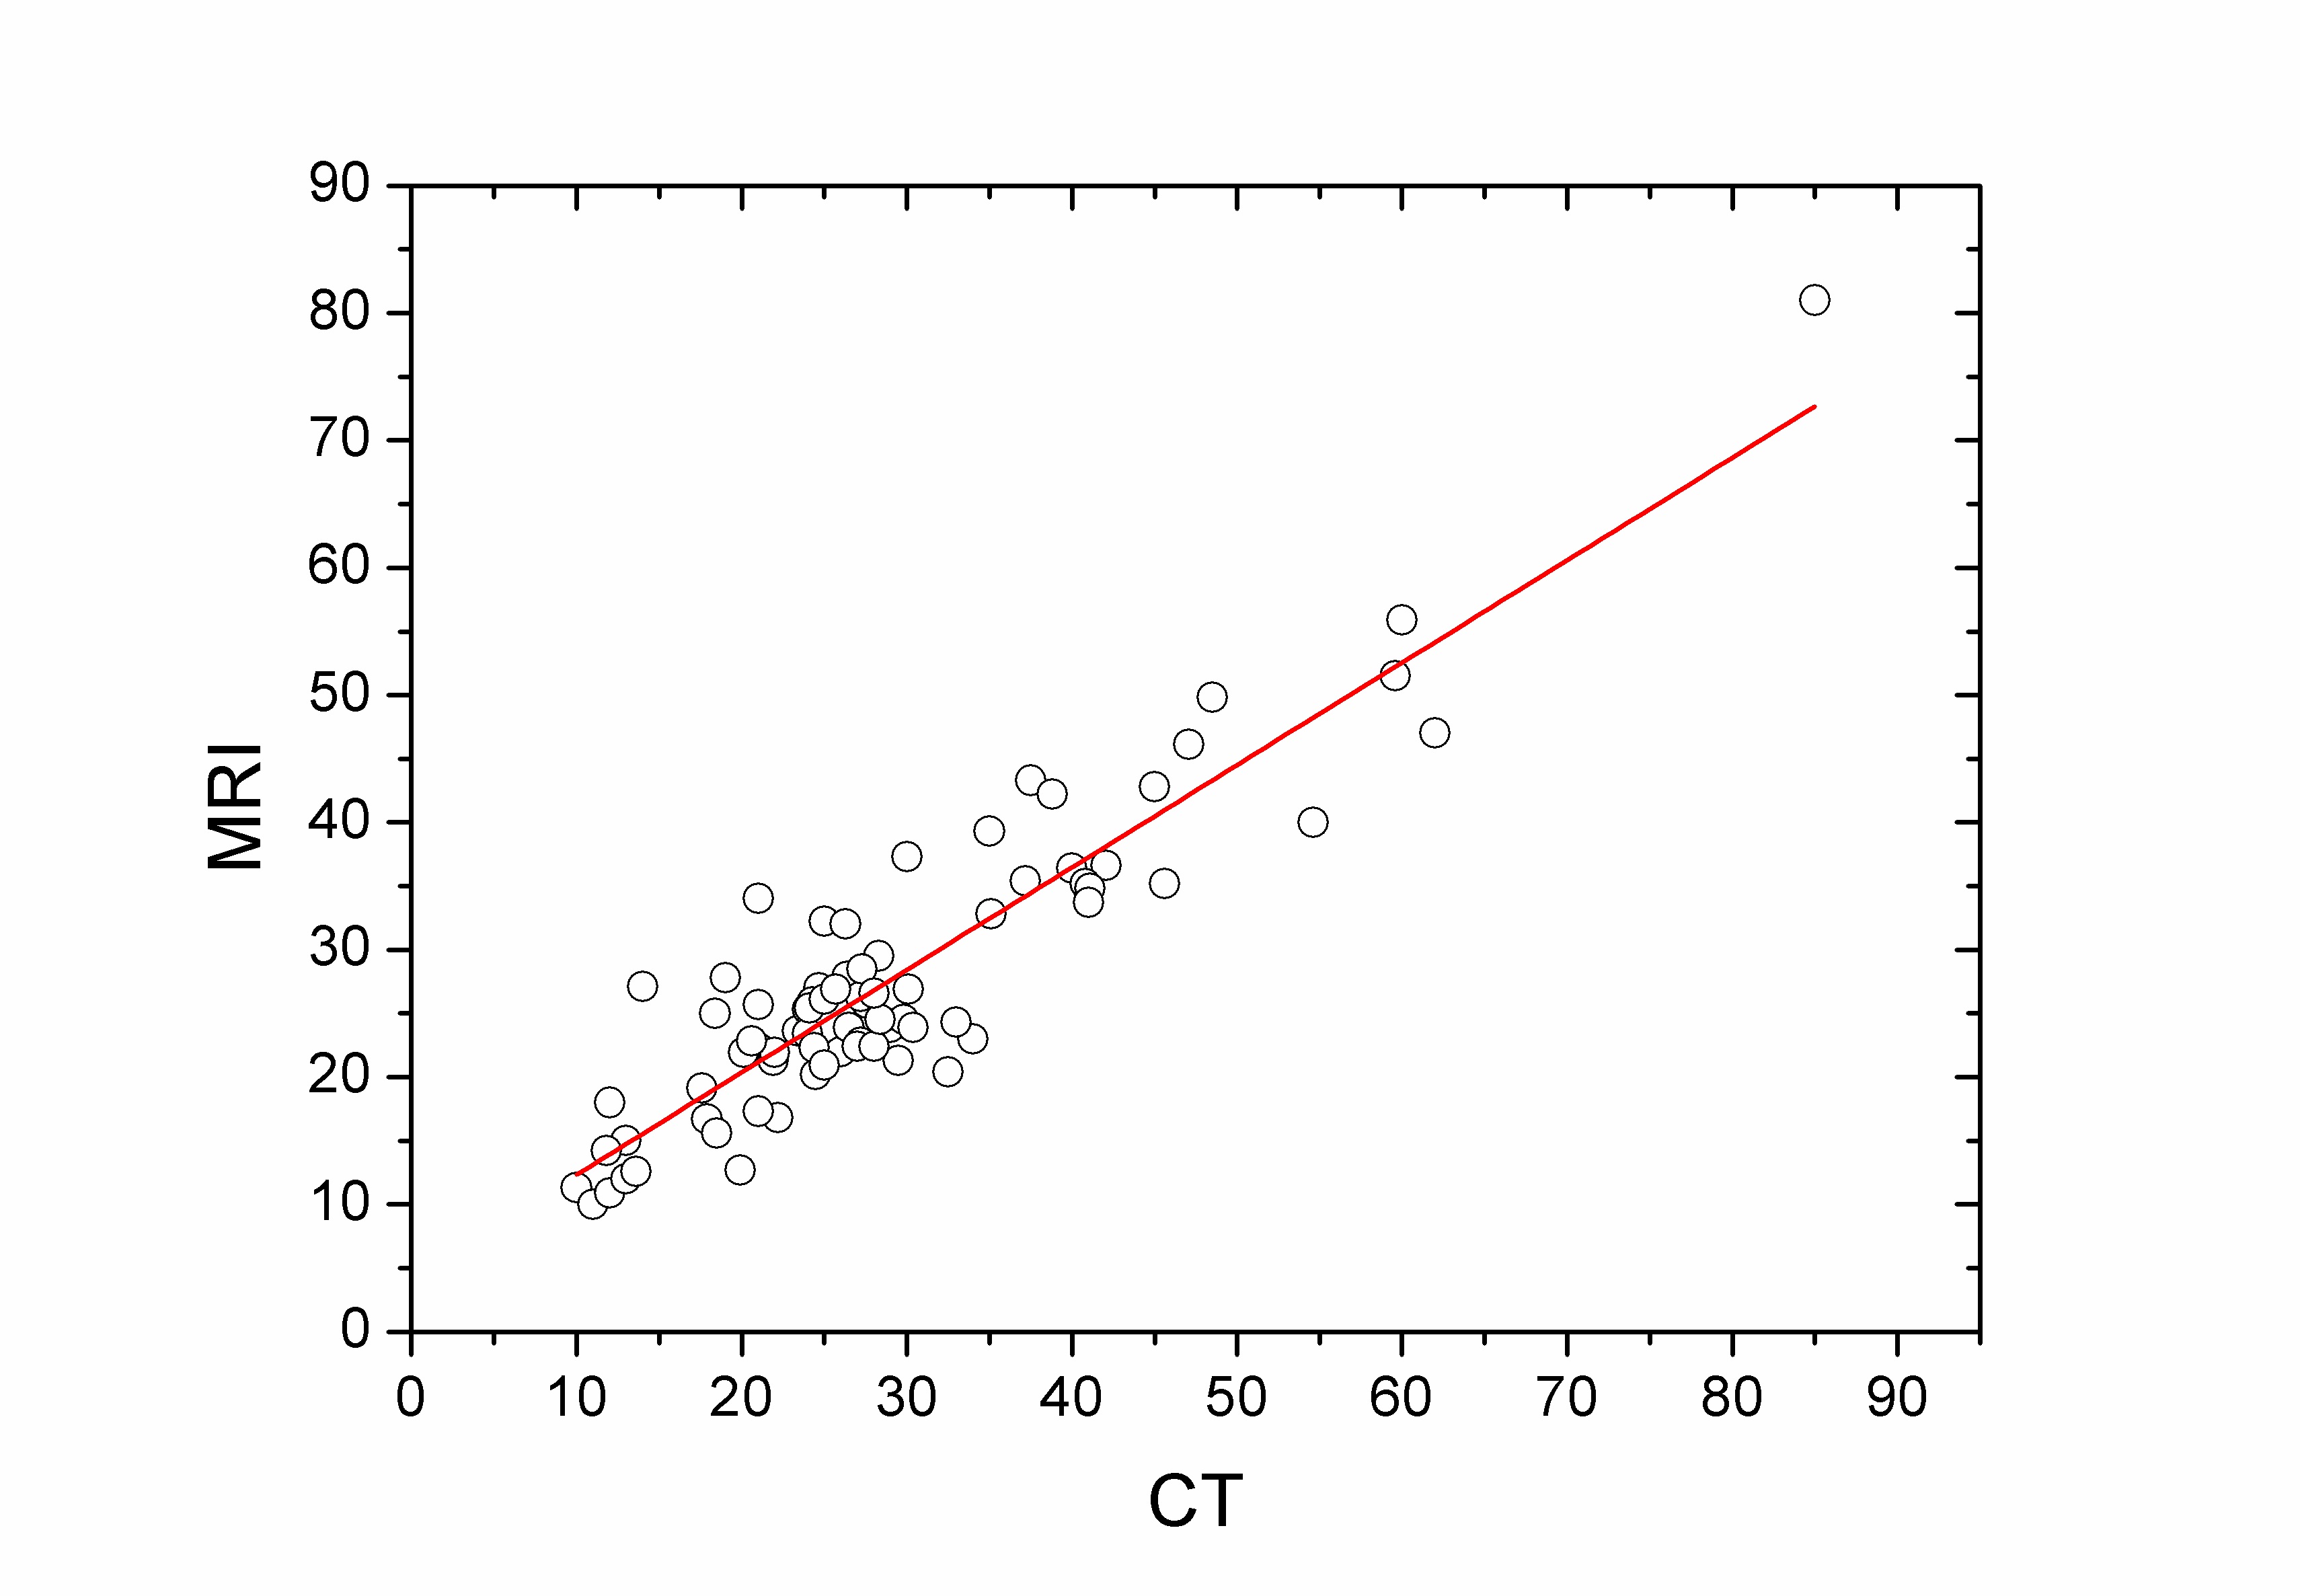
Figure 3.
Linear regression analysis between pathologic size and the difference of size
estimates from pathologic size by CT and by MRI.
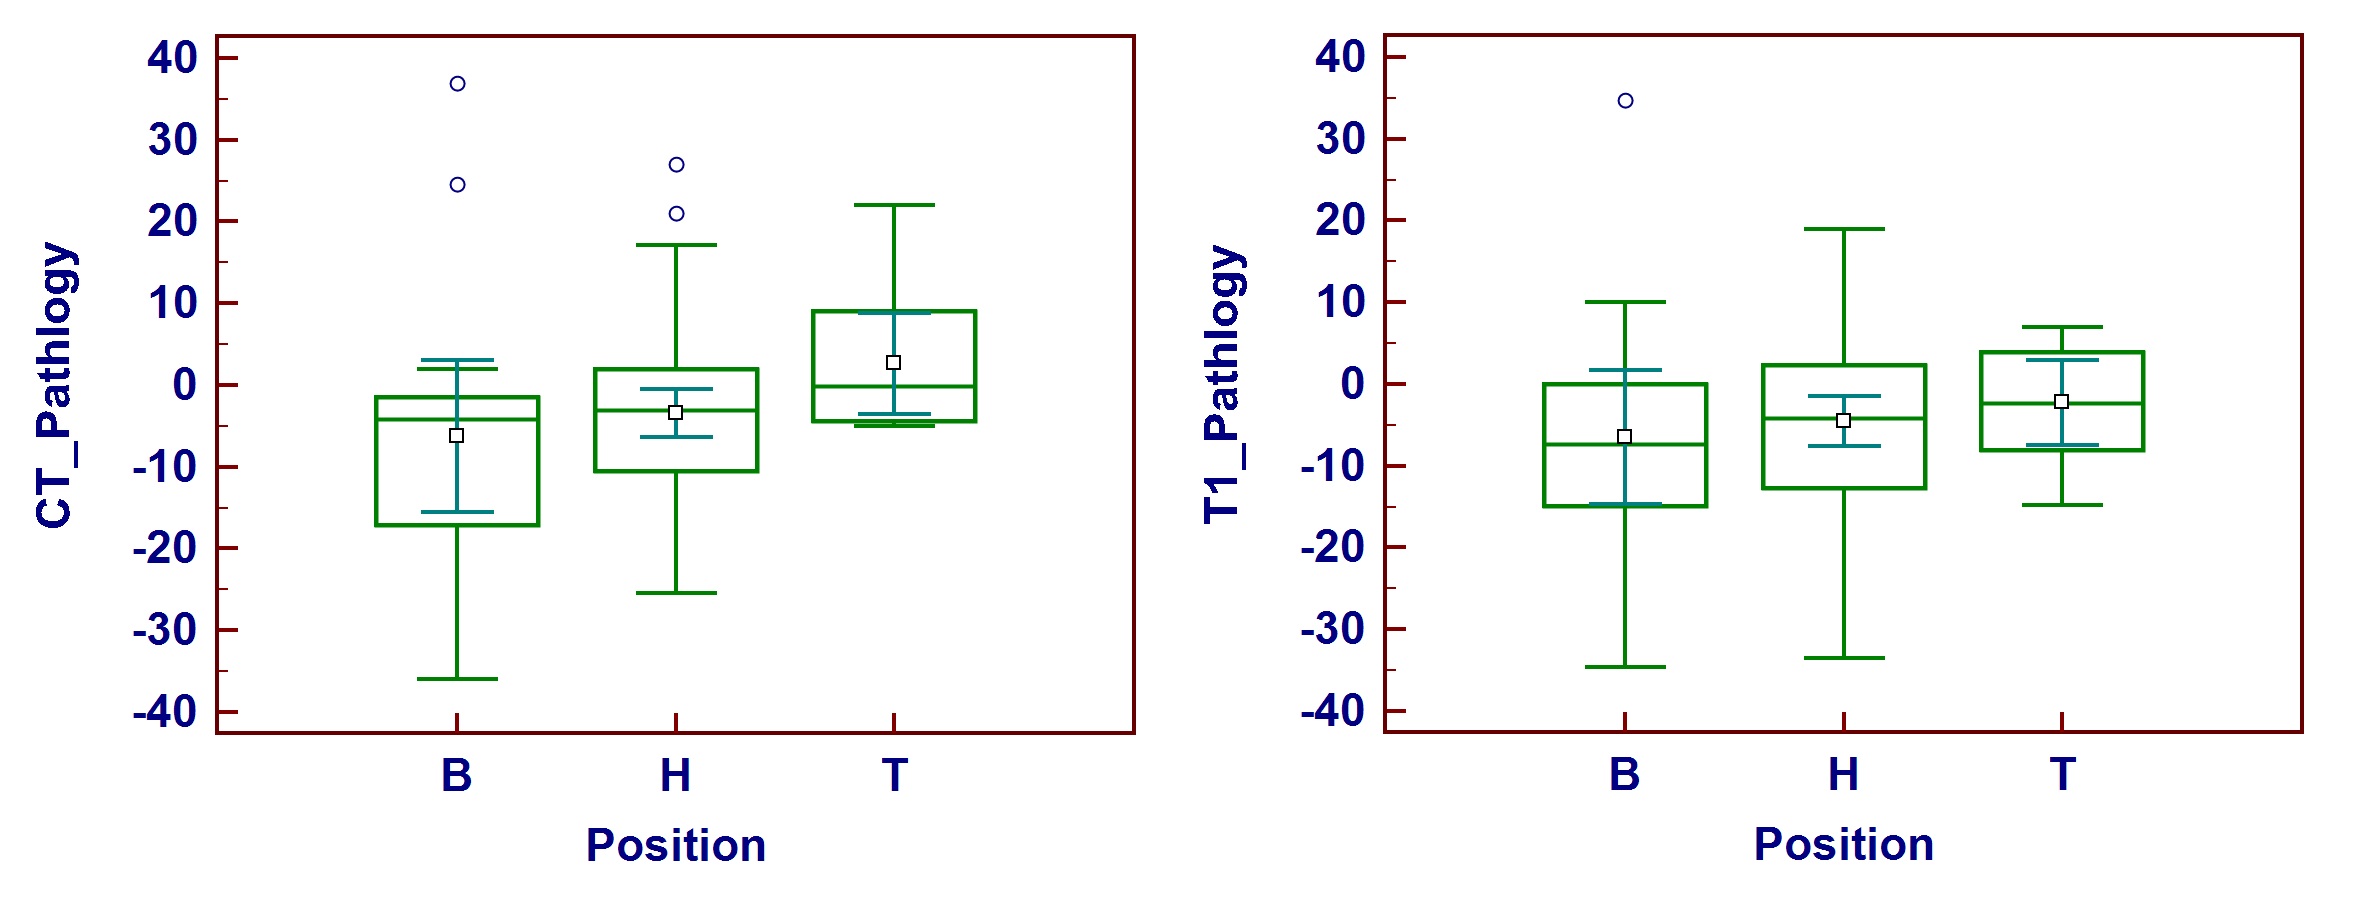
Figure 4.
Box plots of the differences between CT or MRI and pathology according to the
location of pancreatic cancer.