1660
MR measurement of T1 relaxation time and fat signal fraction of the pancreas: Association with HbA1c values1Radiology, Yamaguchi University, Ube, Yamaguchi, Japan
Synopsis
The purpose of this study was to evaluate the association of the T1 relaxation time and FSF of the pancreatic parenchyma measured by MRI with HbA1c value. The T1 relaxation time on the T1 map images with fat suppression and FSF on fat fraction images of the pancreatic parenchyma were measured. We assessed the correlation between the MRI measurements and HbA1c values. The FSF (%) of the pancreatic parenchyma was significantly correlated with HbA1c values while the T1 relaxation times were not. The FSF (%) of the pancreas may be a potential imaging biomarker for impaired glucose tolerance.
Introduction
The T1 relaxation time quantitatively measured by T1 mapping on MR imaging can provide valuable information on a variety of pathological changes such as fibrosis and fat deposition in each organ, including the pancreas 1. Pancreatic fatty infiltration and fibrosis have been seen in many kinds of conditions and diseases including chronic pancreatitis 2, and both can be associated with decreased insulin secretion 3, 4. Recently, it has been reported that the T1 relaxation time of the pancreatic parenchyma is significantly increased in patients with mild chronic pancreatitis, and that the fat signal fraction (FSF) of the pancreatic parenchyma measured on fat fraction images is also higher in patients with mild chronic pancreatitis than in patients with a healthy pancreas 5. Another study demonstrated that the T1-weighted MR signal of the pancreas showed significantly negative correlation with the pancreatic fibrosis and HbA1c value 6. However, the relation between the T1 relaxation of the pancreatic parenchyma, FSF and HbA1c has not been well documented. Thus, the purpose of this study was to evaluate the association of the T1 relaxation time and FSF of the pancreatic parenchyma measured by MRI with HbA1c value.
Methods
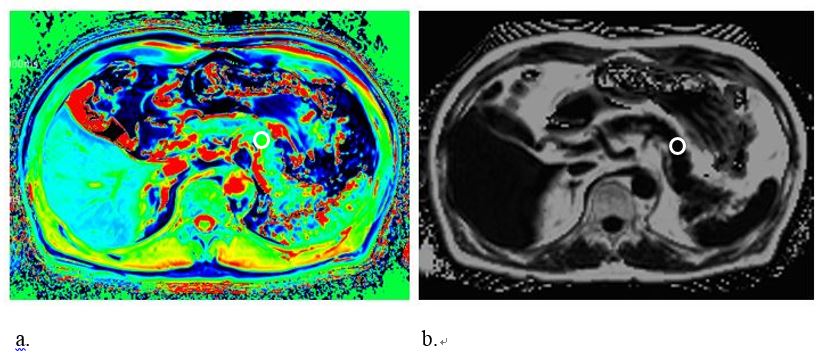
Forty-three consecutive patients (mean age, 72 years; range, 65-78 years) who were suspected of having hepatobiliary or pancreatic diseases underwent upper abdominal MR imaging including T1 mapping with fat suppression and six-point Dixon T1-weighted imaging on 3T MRI. T1 maps with fat suppression were acquired using a dual flip angle 3D gradient echo technique. All patients had an HbA1c test within 1 month prior to MRI. The patients were classified into three groups based on American Diabetes Association criteria: HbA1c < 5.7% (group 1), 5.7% ≤ HbA1c < 6.5% (group 2), and HbA1c ≥ 6.5% (group 3). We measured the T1 relaxation time of the pancreatic parenchyma on T1 map images with fat suppression using operator-defined regions of interest (ROIs). The ROI measurements were made in the body or tail of the pancreas. Attention was given to draw ROI circles as large as possible in a homogeneous region of the pancreatic parenchyma avoiding volume averaging from the pancreatic duct, vessels, and retroperitoneal fat. FSF was also measured on fat fraction images obtained by six-point Dixon T1-weighted imaging at the same location as the T1 map images. The correlation between the MRI measurements and HbA1c values was assessed using Spearman’s rank correlation coefficient. A Kruskal-Wallis test was used for comparisons between three groups.Results
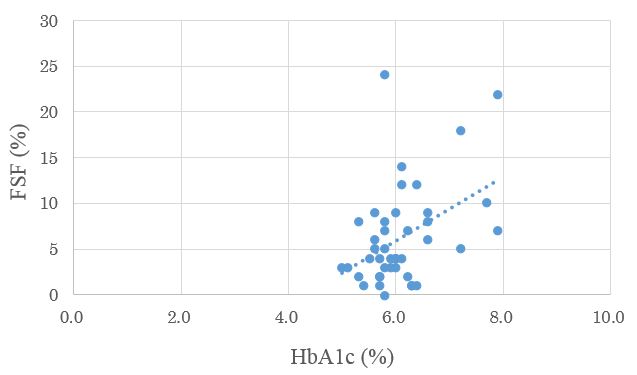
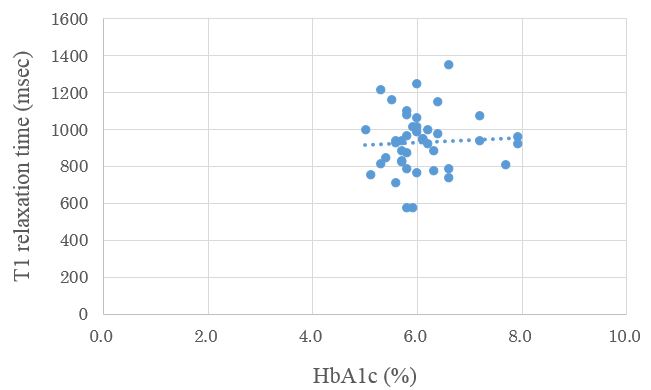
The median T1 relaxation time of the pancreatic parenchyma was 936 msec (range; 819-1007 msec). The median FSF was 4% (range; 3-8%). The median HbA1c value was 6% (range; 5.7-6.3%). A significant positive correlation was observed between the FSF and HbA1c value (r = 0.361, p = 0.017), while there was no significant correlation between the T1 relaxation times of the pancreatic parenchyma and HbA1c value (r = 0.093, p = 0.554). Regarding the comparison of FSF of the pancreatic parenchyma among patients subgroups with different HbA1c values, the median FSF of the pancreatic parenchyma was significantly higher in group 3 (9% [range, 6-12%]) than in group 1 (4% [range, 3-6%]) and 2 (4% [range, 2-7%]) (p = 0.018).Discussion
Our findings revealed that the FSF of the pancreatic parenchyma correlated positively with HbA1c value. HbA1c indicates blood glucose level and is an indispensable diagnostic parameter for impaired glucose tolerance. Therefore, our results suggest that patients with high FSF value are more resistant to insulin. Additionally, patients with high FSF value may suffer from pancreatic fibrosis because a previous study showed a positive correlation between the pancreatic fibrosis and FSF 7. In contrast, there was no significant correlation between the T1 relaxation times of the pancreatic parenchyma and HbA1c value, indicating that T1 relaxation times may not be an adequate biomarker for impaired glucose tolerance.Conclusion
The FSF (%) of the pancreatic parenchyma was significantly correlated with HbA1c values while the T1 relaxation times were not. Thus, the FSF (%) of the pancreas may be a potential imaging biomarker for impaired glucose tolerance.Acknowledgements
No acknowledgement found.References
1. Paajanen H, Brasch RC, Dean PB. Experimental acute pancreatitis: MR relaxation time studies using gadolinium-DTPA. Magnetic resonance in medicine. 1988;6(1):63-73.
2. Tomita Y, Azuma K, Nonaka Y, et al. Pancreatic fatty degeneration and fibrosis as predisposing factors for the development of pancreatic ductal adenocarcinoma. Pancreas. 2014;43(7):1032-41. 3. Clark A, Wells CA, Buley ID, et al. Islet amyloid, increased A-cells, reduced B-cells and exocrine fibrosis: quantitative changes in the pancreas in type 2 diabetes. Diabetes research (Edinburgh, Scotland). 1988;9(4):151-9.
4. Lee JS, Kim SH, Jun DW, et al. Clinical implications of fatty pancreas: correlations between fatty pancreas and metabolic syndrome. World journal of gastroenterology. 2009;15(15):1869-75.
5. Tirkes T, Lin C, Fogel EL, Sherman SS, Wang Q, Sandrasegaran K. T1 mapping for diagnosis of mild chronic pancreatitis. J Magn Reson Imaging. 2017;45(4):1171-6.
6. Noda Y, Goshima S, Tanaka K, et al. Findings in pancreatic MRI associated with pancreatic fibrosis and HbA1c values. J Magn Reson Imaging. 2016;43(3):680-7.
7. Yoon JH, Lee JM, Lee KB, et al. Pancreatic Steatosis and Fibrosis: Quantitative Assessment with Preoperative Multiparametric MR Imaging. Radiology. 2016;279(1):140-50.
Figures