1656
Denoising and Multi-Compartment Visualization of Multi-b-Valued Breast Diffusion MRI1GE Global Research, Niskayuna, NY, United States, 2Department of Radiology and Biomedical Imaging, University of California, San Francisco, CA, United States, 3Department of Radiology, University of Michigan, Ann Arbor, MI, United States
Synopsis
Multi-b-valued diffusion-weighted imaging (DWI) of the breast is highly susceptible to image and fitting noise. A multi-compartment approach was developed to denoise multi-b-value breast DWI without spatial smoothing. In human subject exams (N=12), the denoising approach resulted in a significant reduction in variability of all perfusion and diffusion maps in breast tumor and normal fibroglandular tissue with minimal bias to the mean values, and increased statistical separation of diffusivity metrics between tumor and normal tissue. The denoising algorithm provides compartment fractions for tumor, tissue, and vascularity, which may improve visualization of tissue compartments in DWI.
Introduction
Diffusion-weighted imaging (DWI) is sensitive to tissue microstructural and perfusion changes; multi-b-valued breast DWI1 can provide higher-order, quantitative, perfusion and diffusional kurtosis2 information, in addition to apparent diffusivity coefficient (ADC). The main disadvantage of multi-b DWI is increased scan time. Consequently, multi-b body-DWI is typically limited to 1-3 directions per b-value, as compared to multi-shell neuro diffusion (10s to 100s per shell). In addition, body-DWI faces SNR and additional bulk-motion challenges. Together, these challenges make higher-order diffusivity maps more susceptible to image and fitting noise, which lead to reduced interpretability and quantitative accuracy. Many denoising and noise-estimated approaches have been proposed3-4, but rely on statistics obtained from a neighborhood of pixels, which invariably cause spatial smoothing and consequently compromised spatial resolution. The goal of this work is to adapt for body-diffusion a recently-proposed denoising technique5 that operates entirely in the diffusion space; hence at no cost to spatial resolution. We investigate if denoising would improve the quality of perfusion and diffusivity maps to potentially provide improved interpretability.Methods
The model-based diffusion denoising method5was proposed with multi-directional-shell neuro-diffusion to provide 3-4 times acceleration and improved diffusivity maps. The method used a generalized, multi-compartment signal model with anisotropic and isotropic tissue compartments, and Richardson-Lucy dampening for optimization:
$$\widehat{s}(b,q)=\sum_{j=1}^J\sum_{n=1}^Nf_{aniso,j,n}exp(-(\lambda_{||}(bq^Tu_n)^2)(-\lambda_{\bot}b(1-(q^Tu_n)^2))+\sum_{j=1}^Jf_{iso}exp(-\lambda_jb)$$
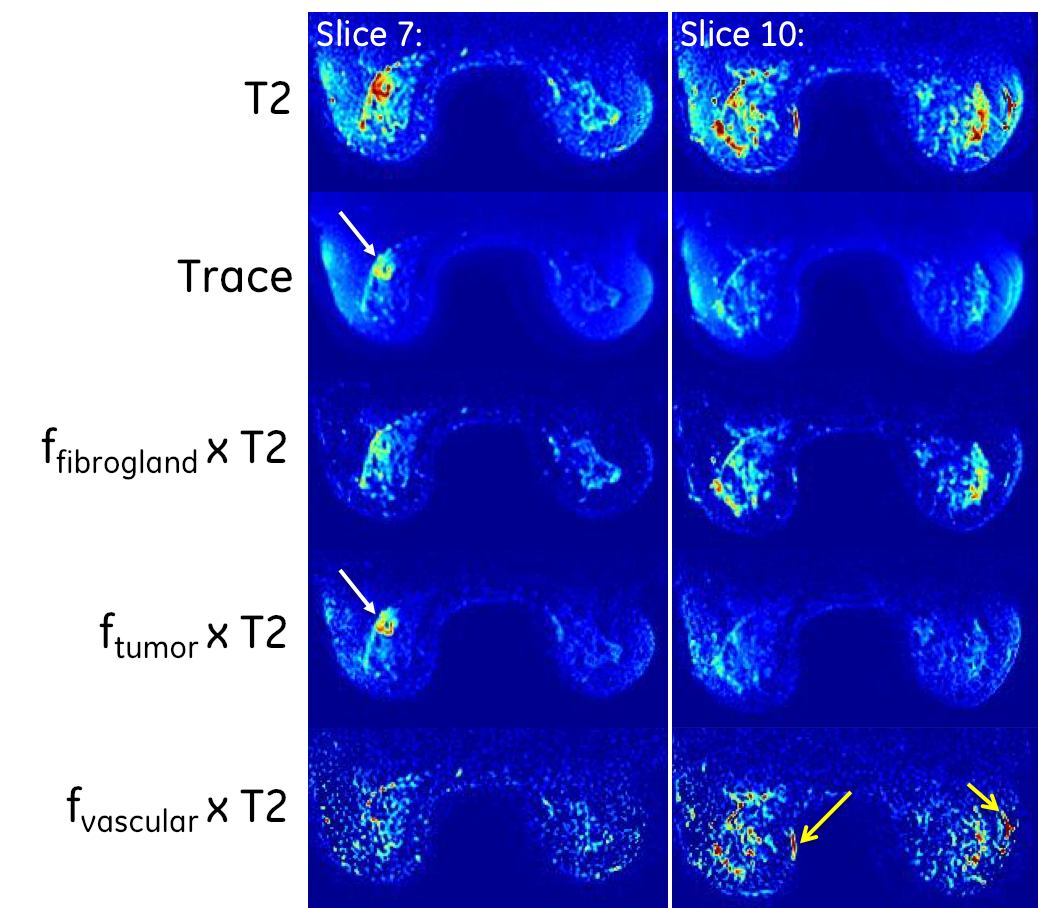
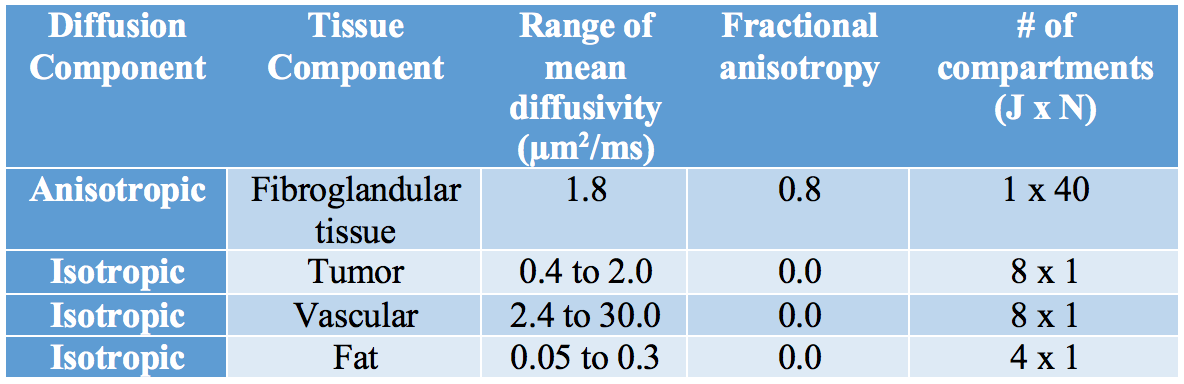
To adapt the method for breast multi-b diffusion where tissue anisotropy is less and diffusion directions are fewer, a model with far fewer compartments and reduced anisotropy was proposed (Table 1), with compartment values approximating normal fibroglandular tissue (NFT), tumors, vascular and fat components as surveyed in the literature1,6-7. As a by-product of the model, the fractional values belonging to each component (ffibroglandular, ftumor, fvascular) could provide visualization of the image signal from each component, as shown in Fig. 1.
Twelve serial multi-b DWI acquisitions from subjects undergoing neoadjuvant chemotherapy for invasive breast cancer (three subjects x 4 time-points) were selected retrospectively for processing. Studies were deidentified per DICOM standard and all subjects gave written informed consent. The acquisitions were obtained from a 1.5T scanner (GE Healthcare, Waukesha WI) with one b=0 acquisition and three-directions per b-value={100,600,800}sec/mm2, FOV=34-35cm, slice thickness=4mm, TR/TE=7500/67.6-67.9ms. Tumor and contralateral NFT were manually segmented on the un-denoised ADC maps. To reduce spatial-bias of diffusivity, gradient nonlinearity correction was applied8-9. The analyzed metrics included: ADC (utilizing b=0 and all b-values), slow ADC (utilizing non-b=0 data), b=100 ADC, and perfusion component fraction10 of b=0. In comparing standard vs denoising, pair-wise, non-parametric Wilcoxon signed-rank test (P<0.05 for statistical significance) was performed on the mean difference and coefficient of variation (CV) of each metric. Two-sample t-test was used to compare metrics between tumor and NFT.
Results
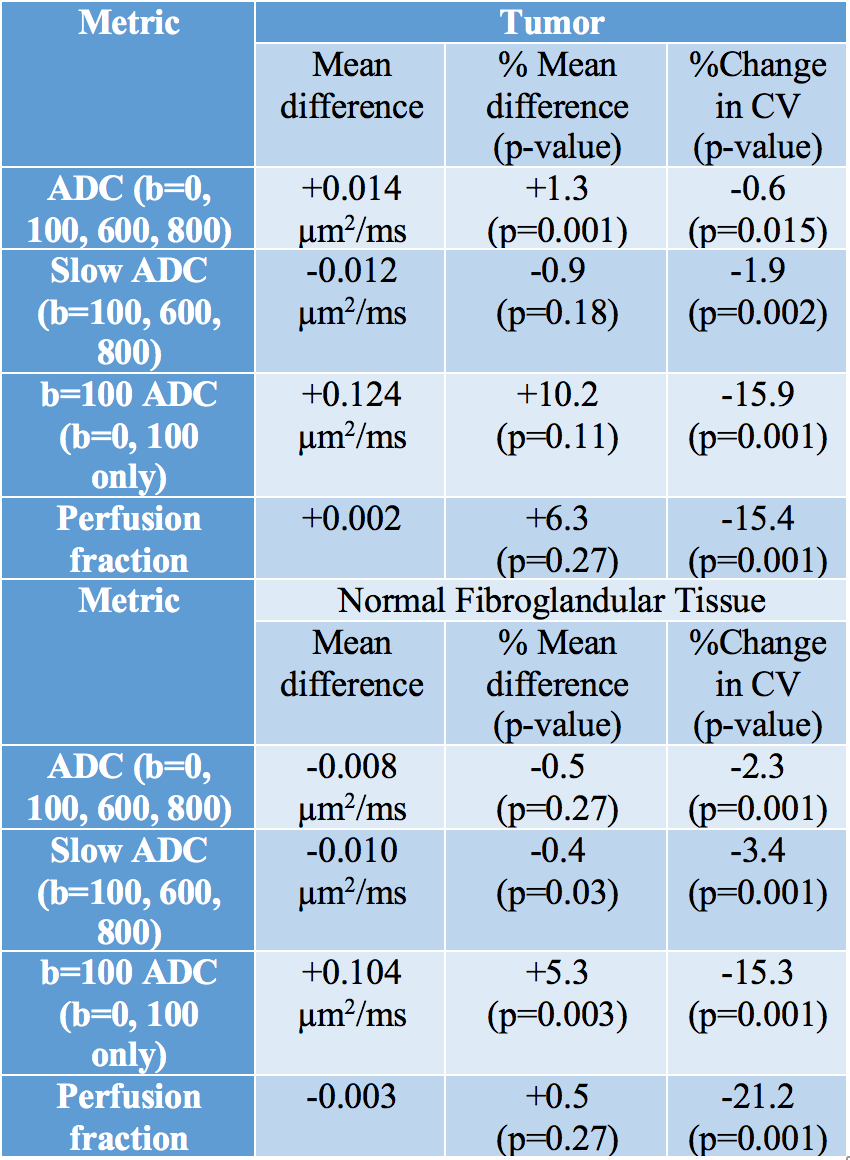
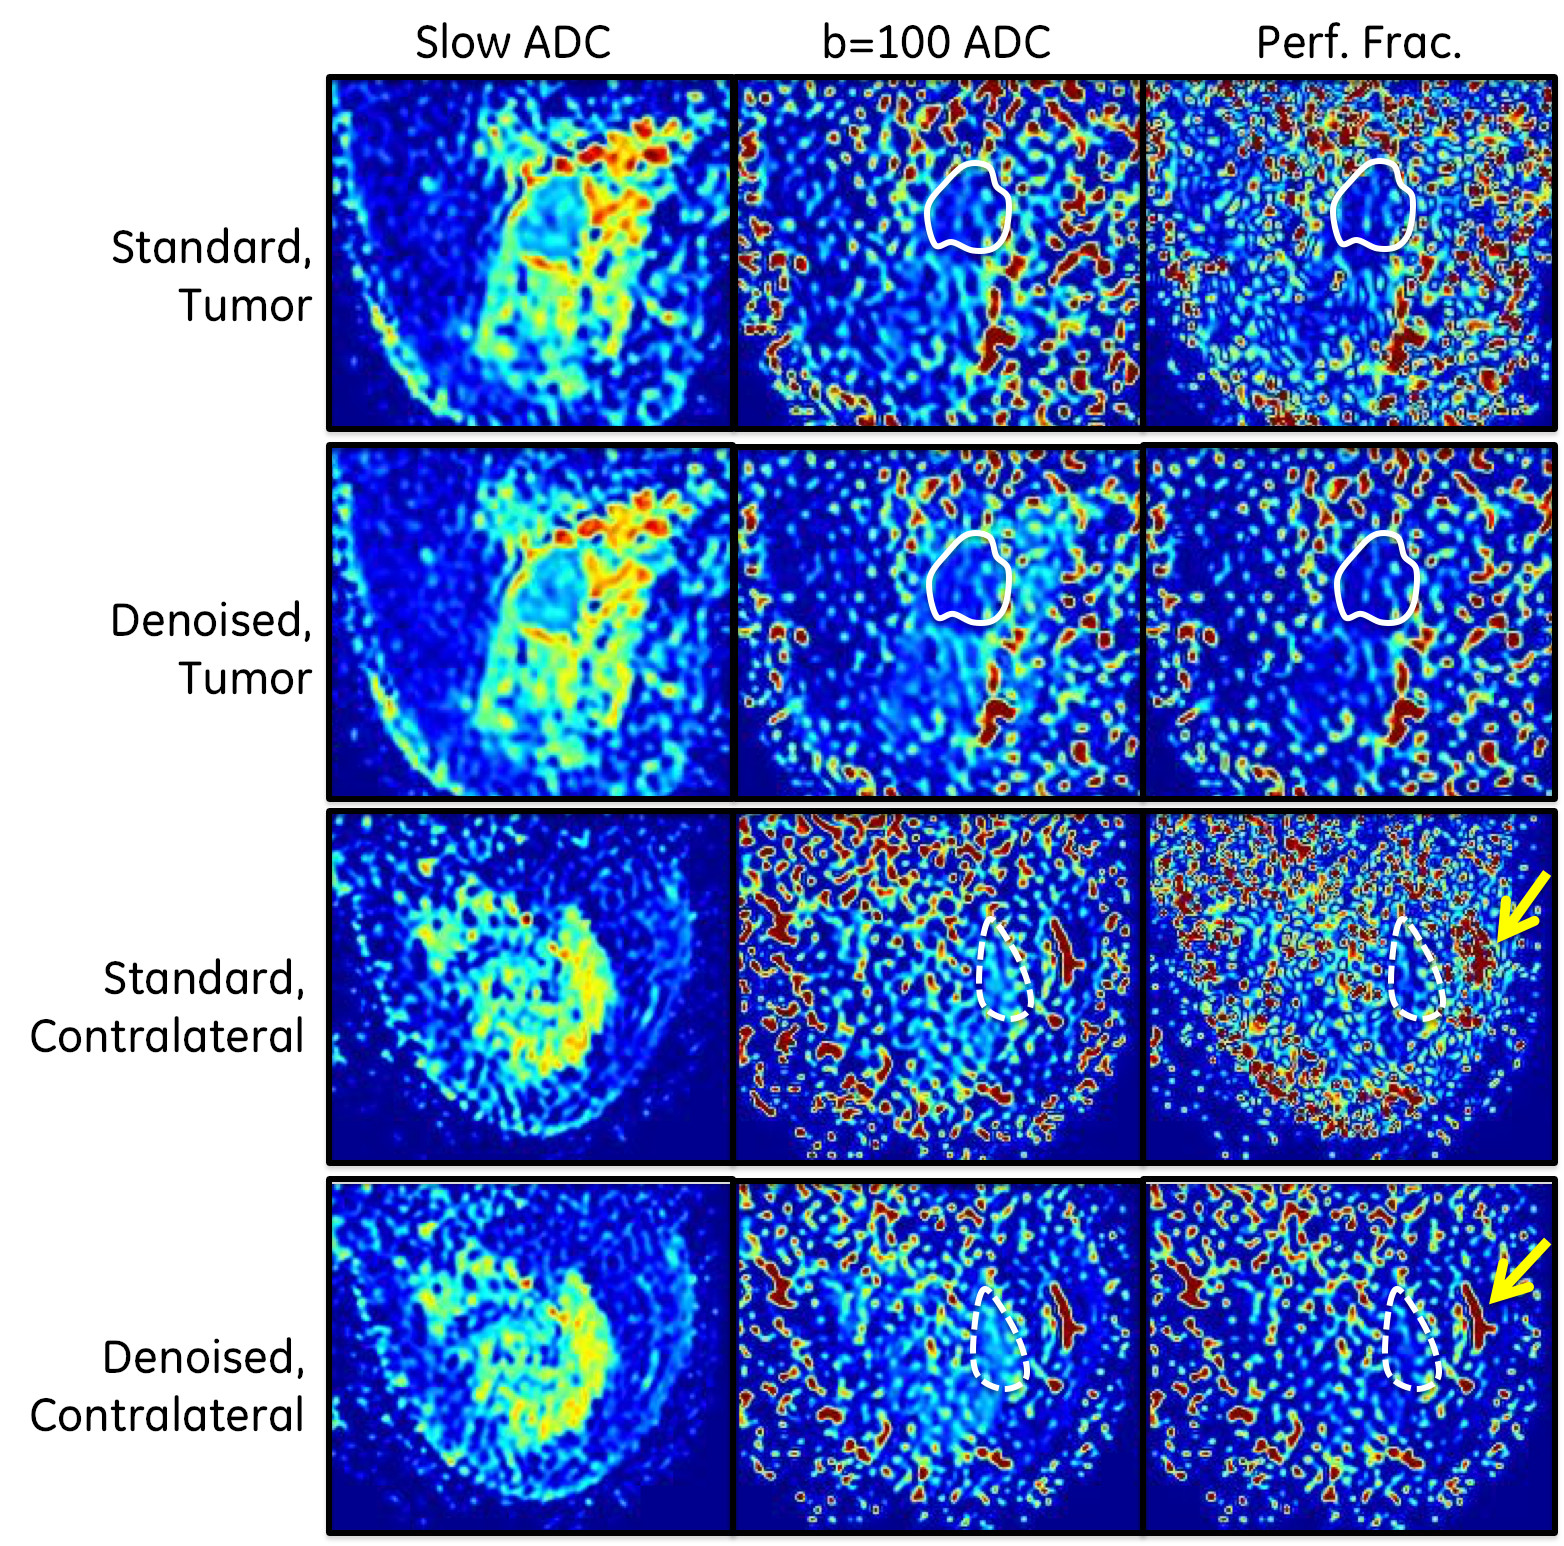
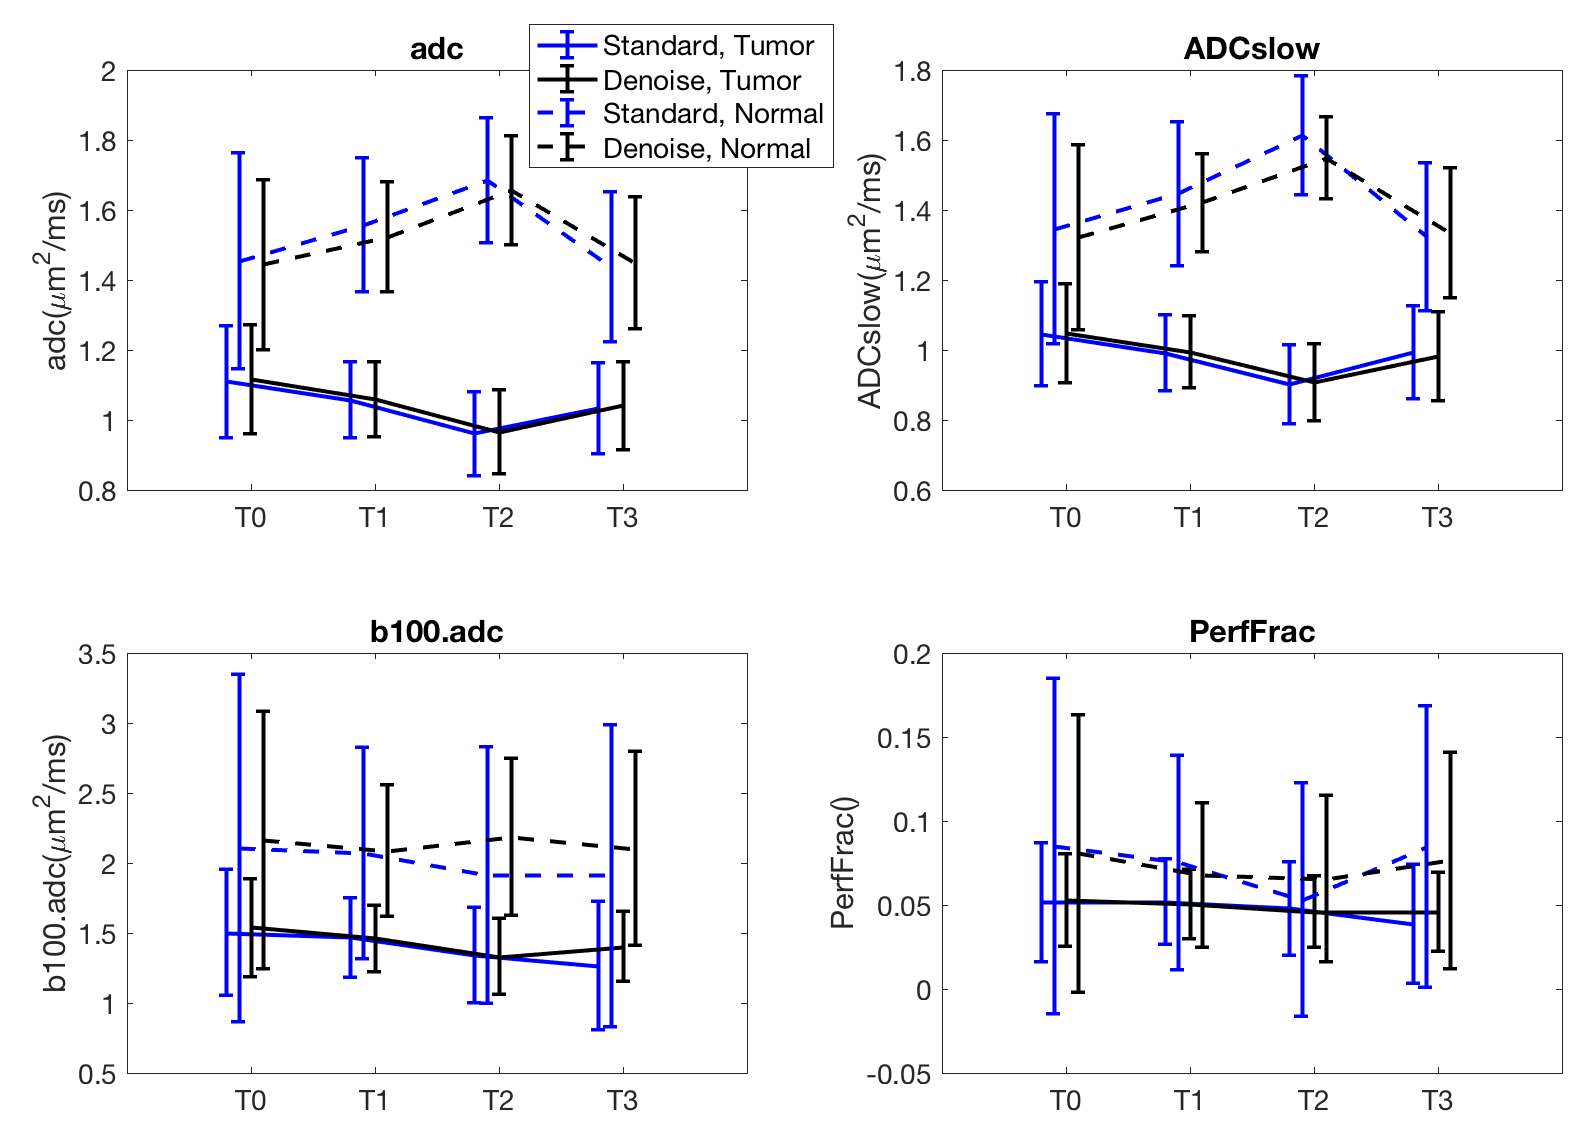
As summarized in Table 2, denoising resulted in very small changes (<±1%) to mean ADC and slow ADC for tumor and NFT; denoising increased b=100 ADC by 5.3-10.2% for both tumor and NFT; denoising increased perfusion fraction as well without statistical significance. In all metrics and in both tumor and NFT, the coefficient of variation (CV) within the ROIs were significantly reduced. In particular, the CV reduction was substantial (15.3-21.2%) in both b=100 and perfusion fraction. These quantitative results could be visualized in Fig. 2, wherein denoising resulted in subtle changes to slow ADC, but dramatic reduction in image texture in both the b=100 ADC and perfusion maps; vascular structures became better visualized.
The differences in diffusivity measures between tumor and NFT were overall increased; t-statistic increased, on average by +1.5 for ADC, +3.2 for slow ADC, +3.8 for b=100 ADC and +0.6 for perfusion fraction. The number of instances with significant differences between tumor and normal tissue was unchanged in ADC (12/12) and in slow ADC (11/12); these were increased in b=100 ADC (from 10/12 to 11/12) and perfusion fraction (from 8/12 to 9/12). These effects are shown on the one subject in Fig. 3.
Discussion and Conclusion
The proposed denoising scheme for multi-b-valued breast DWI does not compromise spatial resolution, and can provide effective outlier reduction in all metrics and potentially improved accuracy in low-contrast b=100 ADC and perfusion fraction. Denoising improved the statistical separation of tumor vs. normal fibroglandular tissue in all metrics; in this limited breast cancer cohort resulted in one instance of change of statistical significance. The fractional components not only allow visualization of signal components from tissue vs. tumor vs. vascular, but could potentially be useful quantitative metrics in themselves. Future work will focus on a more comprehensive signal-to-noise analysis of the denoising parameters, evaluation in a larger cohort to determine potential impact on tumor segmentation and classification, and investigation into denoising of multi-shell DTI.Acknowledgements
This work was supported in part by NIH R01-CA190299 and U01-CA151235. The opinions or assertions contained herein are the private views of the authors and are not to be construed as official or reflecting the views of the NIH.References
1. Young Cho, G, Moy L, Kim SG et al. Eur Radiol 2016. 26(8):2547-2558.
2. Jensen JH, Helpern JA, Ramani A et al. Magn Reson Med 2005. 53(6):1432-1440.
3. Haldar JP, Wedeen VJ, Nezamzadeh M et al. Magn Reson Med 2013. 69(1)277-289.
4. Lam F, Babacan SD, Haldar JP et al. Magn Reson Med 2014. 71(3):1272-1284.
5. Sperl JI, Sprenger T, Tan ET et al. Magn Reson Med 2017. 78(6):2428-2438.
6. Partridge SC, Ziadloo A, Murthy R et al. JMRI 2010. 31(2):339-347.
7. Jiang R, Ma Z, Dong H et al. Brit J Radiol 2016. 89:20160076.
8. Malyarenko DI, Ross BD, Chenevert TL. Magn Reson Med 2014. 71(3):1312-1323.
9. Newitt DC, Tan ET, Wilmes LJ et al. JMRI 2015. 42(4):908-919.
10. Lewin M et al. European Radiology 2011.21(2):281-290.
Figures