1655
Reducing T2-shinethrough effects in prostate diffusion-weighted imaging with Stimulated Echo imaging1Medical Physics, University of Wisconsin Madison, Madison, WI, United States, 2Radiology, University of Wisconsin Madison, Madison, WI, United States
Synopsis
The bright appearance of long-T2 tissues in DWI, termed “T2-shinethrough”, reduces the contrast between healthy tissue and cancer and is prominent in spin-echo based DWI acquisitions. In prostate DWI, the need to avoid T2-shinethrough has led to the acquisition of very high b-values in clinical practice, which may result in low SNR and other image artifacts. In this work, we have assessed the ability of stimulated-echo DWI to provide high contrast between PCa and healthy peripheral zone, without the need for high b-values. Preliminary results in 19 patients show reduced T2-shinethrough effects in stimulated-echo DWI compared with spin-echo DWI.
Introduction
Diffusion MRI is widely used for the assessment of prostate cancer (PCa). Diffusion MRI is typically acquired with spin echo (SE) based diffusion-weighted (DW) sequences. However, T2-shinethrough remains a problem in SE-DWI due to the long echo times needed for diffusion encoding1. In these sequences, long T2 tissues (eg: the healthy peripheral zone) appear bright on DW images due to T2-shinethrough. This has led to the acquisition of very high b-value SE-DWI (b=1500-2000s/mm2) in research and clinical practice1-4. However, very high b-value acquisitions result in low SNR and may introduce other image artifacts3-4. In contrast, STimulated Echo (STE) DWI sequences5 enables the acquisition of diffusion MRI with short TEs (ie: reducing T2-shinethrough). In this project, we assessed the ability of STE-DWI to provide high contrast between PCa and surrounding tissues, without the need for very high b-values.Methods
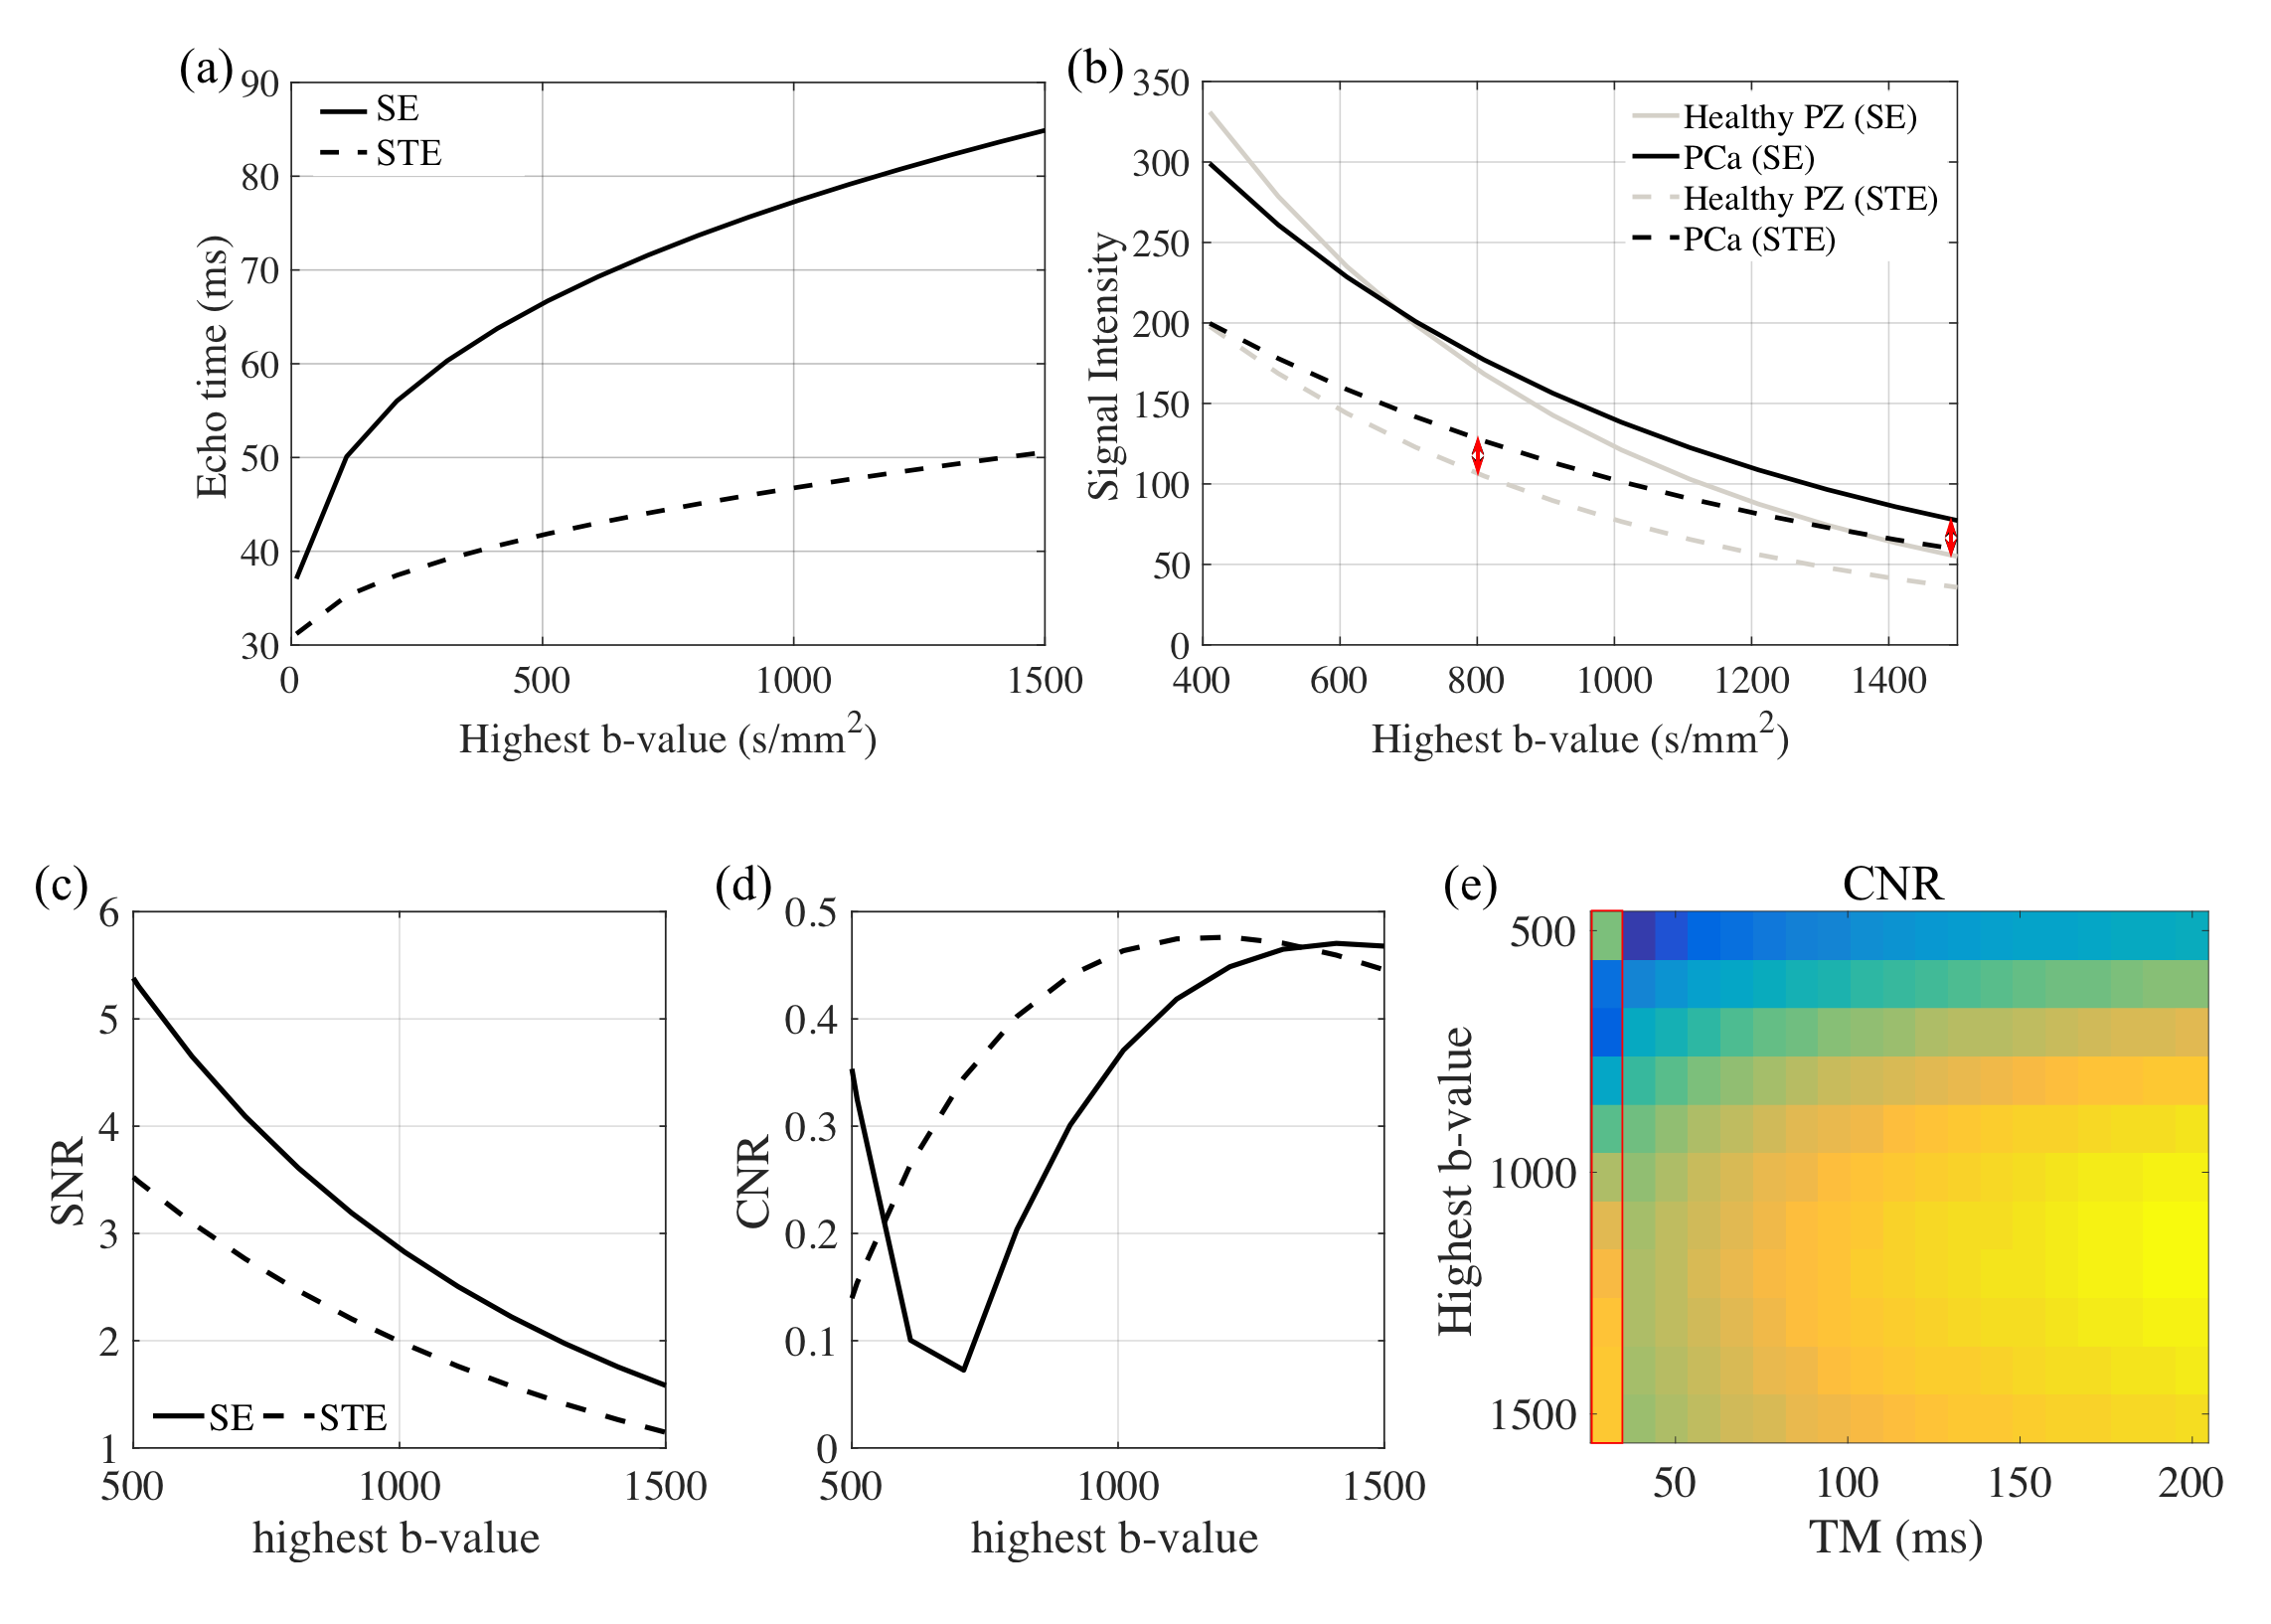
Simulation: Both diffusion-weighted SE and STE signals were simulated in Matlab with T2=80ms for PCa and T2=130ms for healthy peripheral zone (PZ). The ADC values for PCa and healthy PZ were 1.00mm2/s and 1.50mm2/s, respectively.6-7 Other relevant parameters were Gmax = 50mT/m, SRmax = 100T/m/s, T_90=5.3ms, T_180=6ms and readout-to-echo time=11ms. Different maximum b-values were simulated with TE minimized for each b-value. Different mixing times (TM) were also used for STE sequences. Ignoring T1 relaxation effects (T1 times are generally larger than one second in the prostate8), SE and STE signals are calculated by $$S_{SE}=Ae^{-\frac{TE}{T2}}e^{-bADC}$$ and $$S_{STE}=\frac{1}{2}Ae^{-\frac{TE}{T2}}e^{-bADC}$$.
Signal-to-Noise Ratio (SNR) of the healthy PZ and Contrast-to-Noise Ratio (CNR) between PCa and healthy PZ were calculated for each simulated DWI signal.
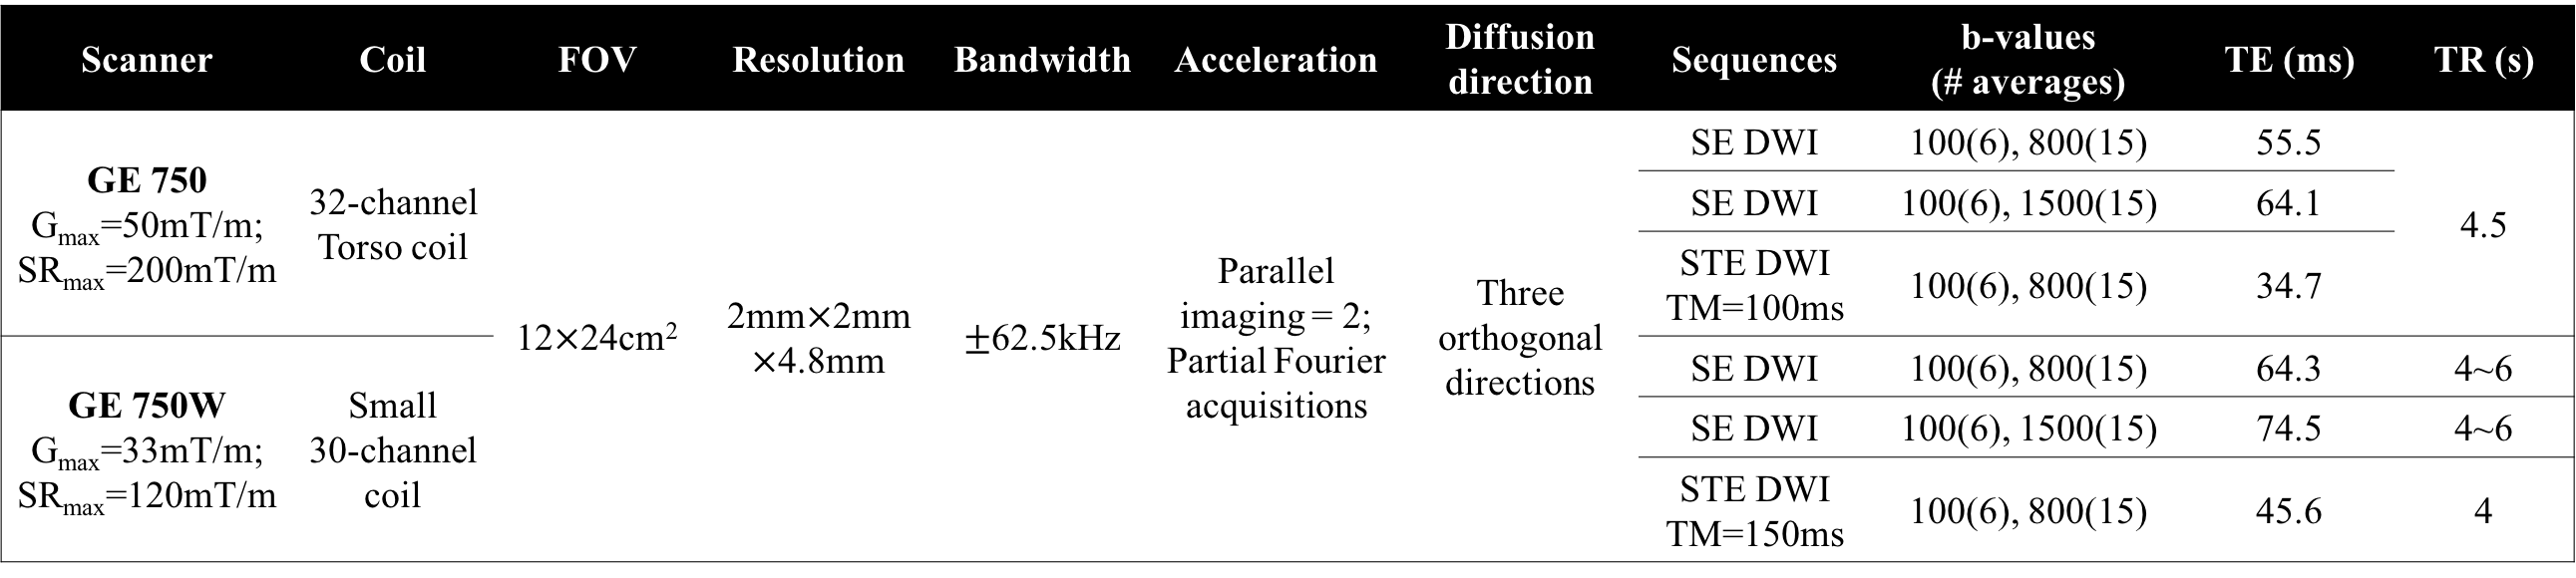
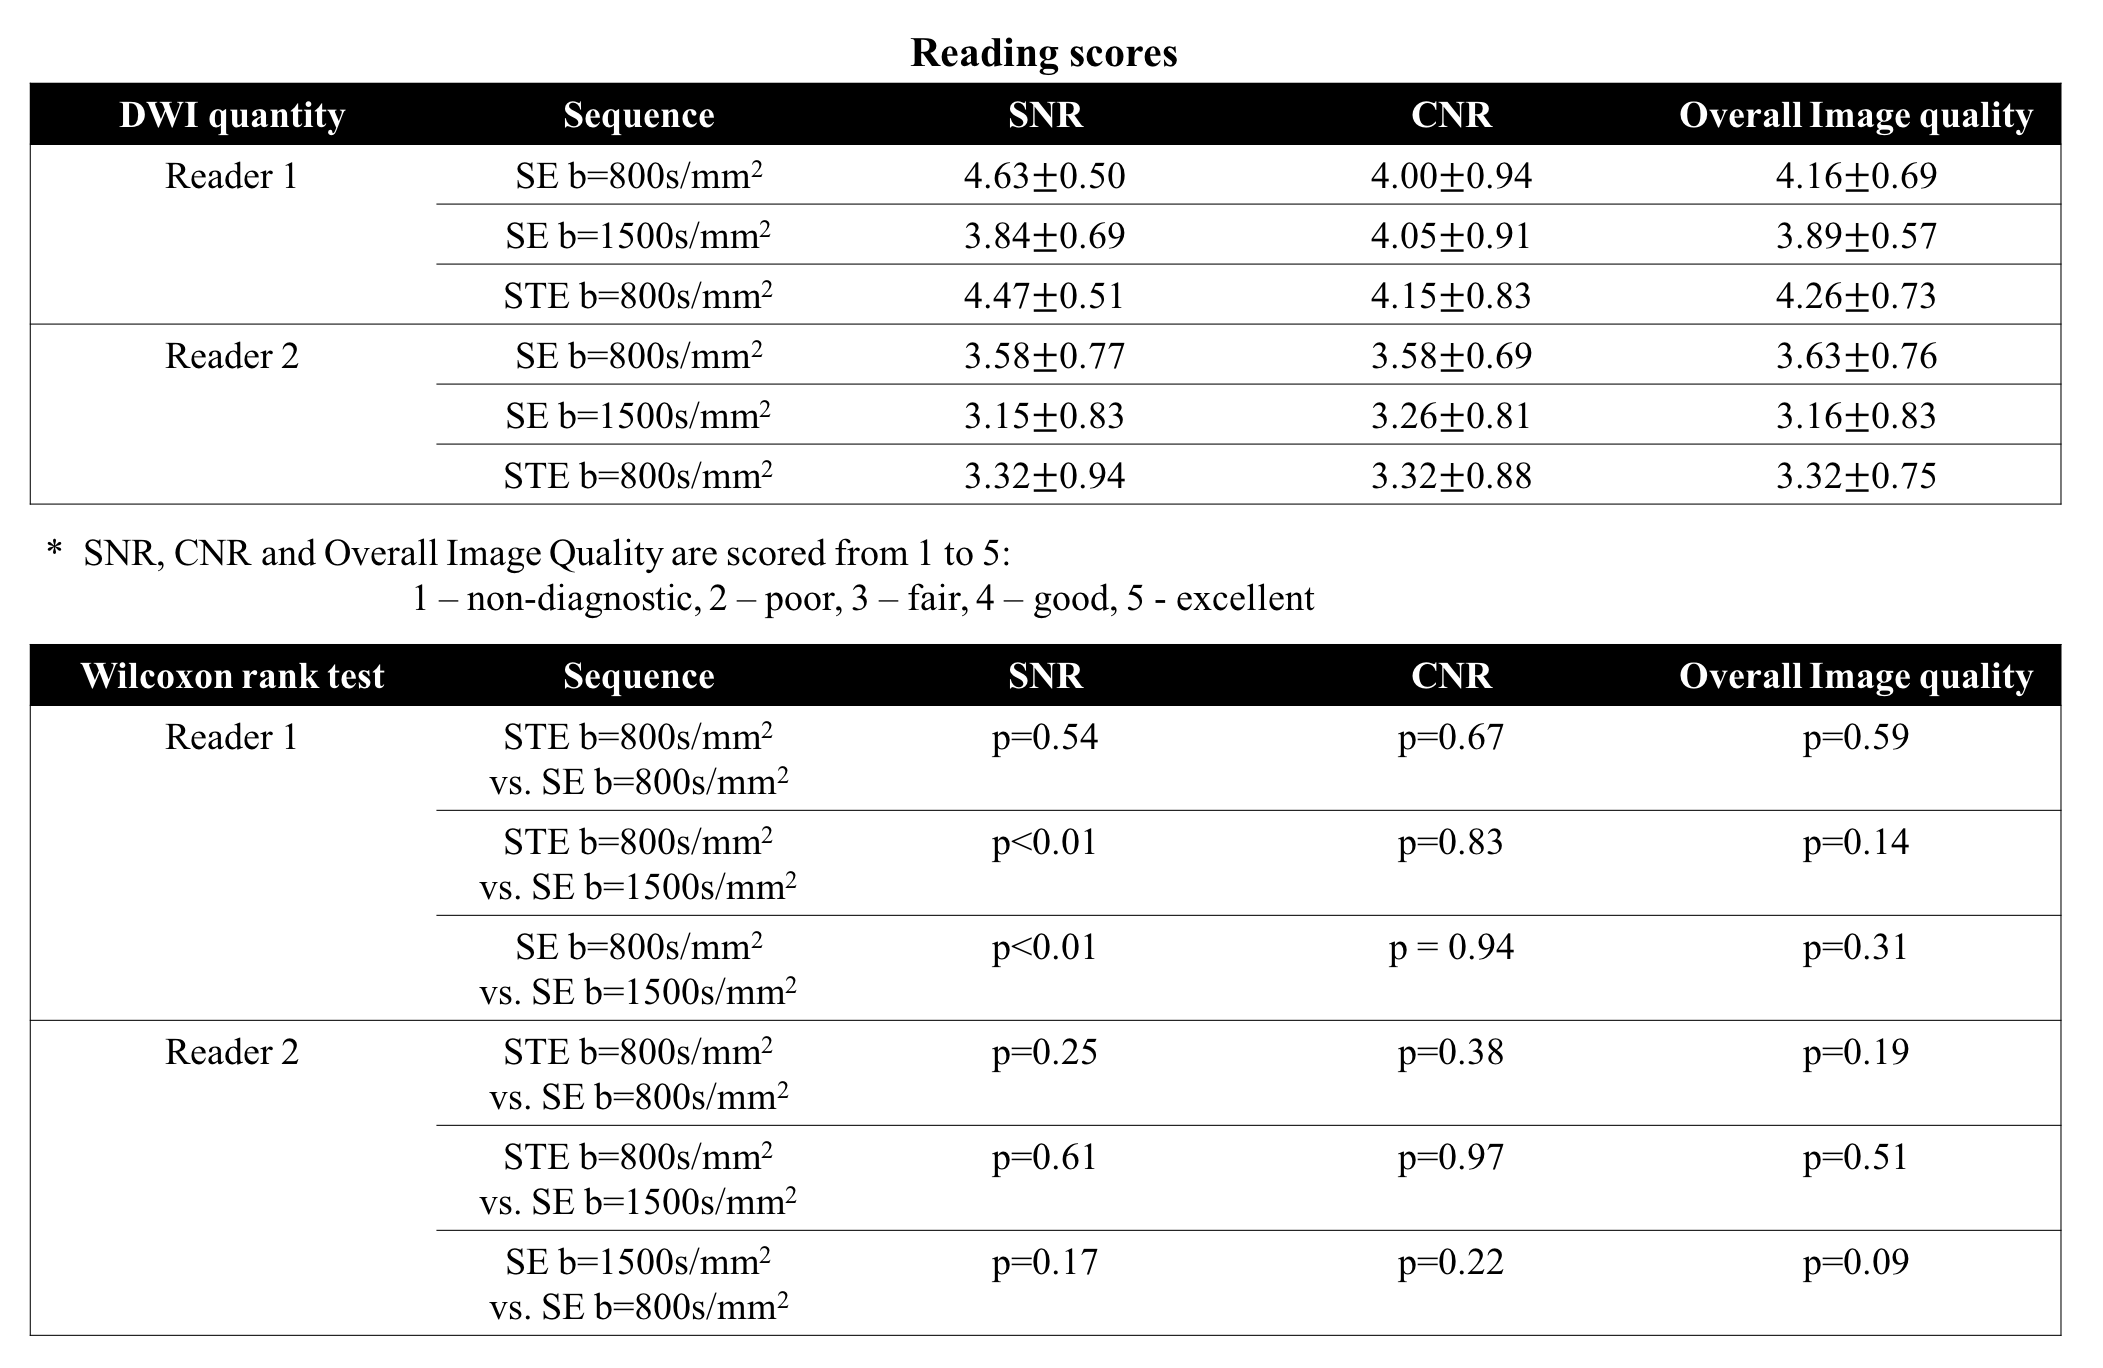
Evaluation in patients: 19 patients with suspected prostatic disease were recruited after IRB approval and informed written consent, and each patient was scanned on one of two different 3T scanners. In each exam, two SE-DWI series with b=[100, 800]s/mm2 and b=[100,1500]s/mm2, respectively, were acquired as reference DWI sequences. A STE-DWI series was performed with b=[100, 800]s/mm2. Detailed imaging parameters are shown in Table 1. A reader study including two radiologists was conducted. Readers were assigned three reading sessions; in each session, T2-weighted images, one DWI series (blinded) and its ADC maps were provided to each reader with patients listed in a randomized order. SNR, CNR and overall image quality were evaluated based on a 5-point score. The Wilcoxon signed rank test was performed on the readers' scores to evaluate the differences among sequences. ROI measurements of SNR, CNR and ADC were performed in the PCa and adjacent healthy PZ (ROIs were drawn based on the readers’ annotations). Ratio t-test was used for pair-wise comparison of the SNR and CNR measurements between sequences; two-sample t-test was conducted for ADC between PCa and healthy PZ.
Results
Fig.1(a-b) illustrates the change of TE over b-values and the signal decay curves for both SE- and STE-DWI in the simulation. The double-head arrows with the same length in Fig.1(b) point to signal difference between PCa and healthy PZ tissues, indicating the same contrast can be expected with STE b=800s/mm2 as with SE b=1500s/mm2. Fig.1(c-d) presents the comparison of SNR and CNR between SE and STE sequences, where STE can reach similar CNR at around b=800s/mm2 as SE b=1500s/mm2, but STE provides higher SNR. Fig.1(e) shows that the CNR of STE-DWI is increasing over TM in tissues with long T1.
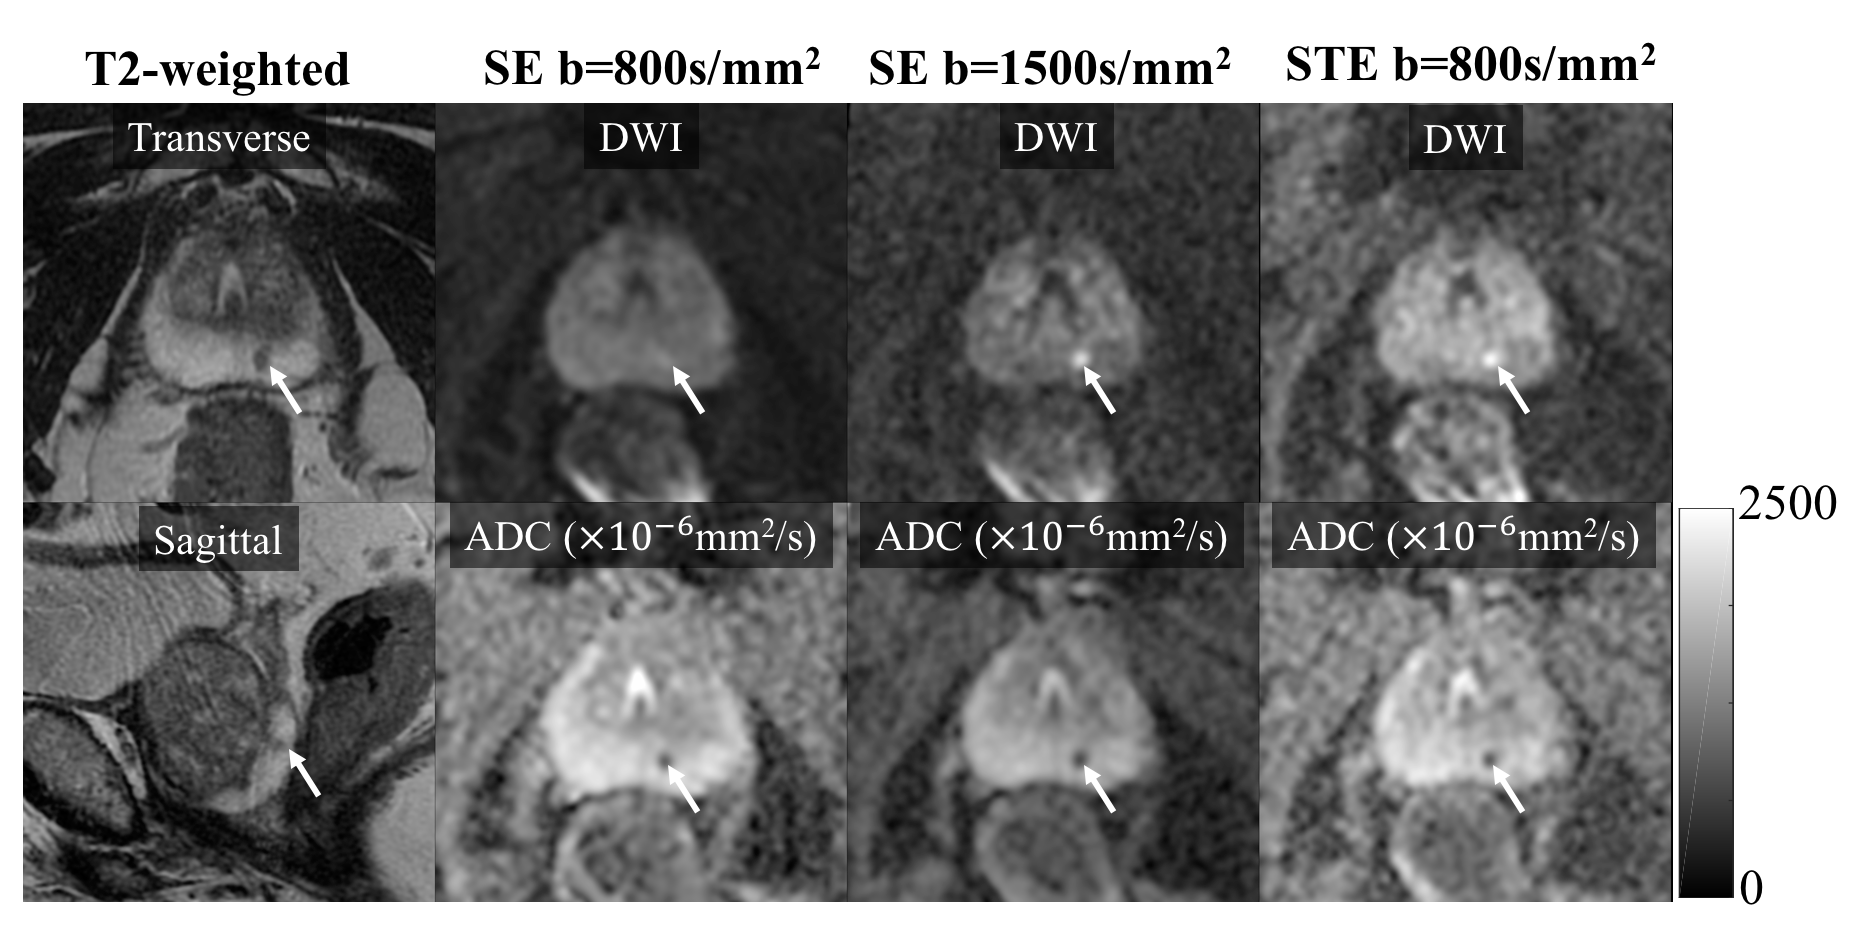
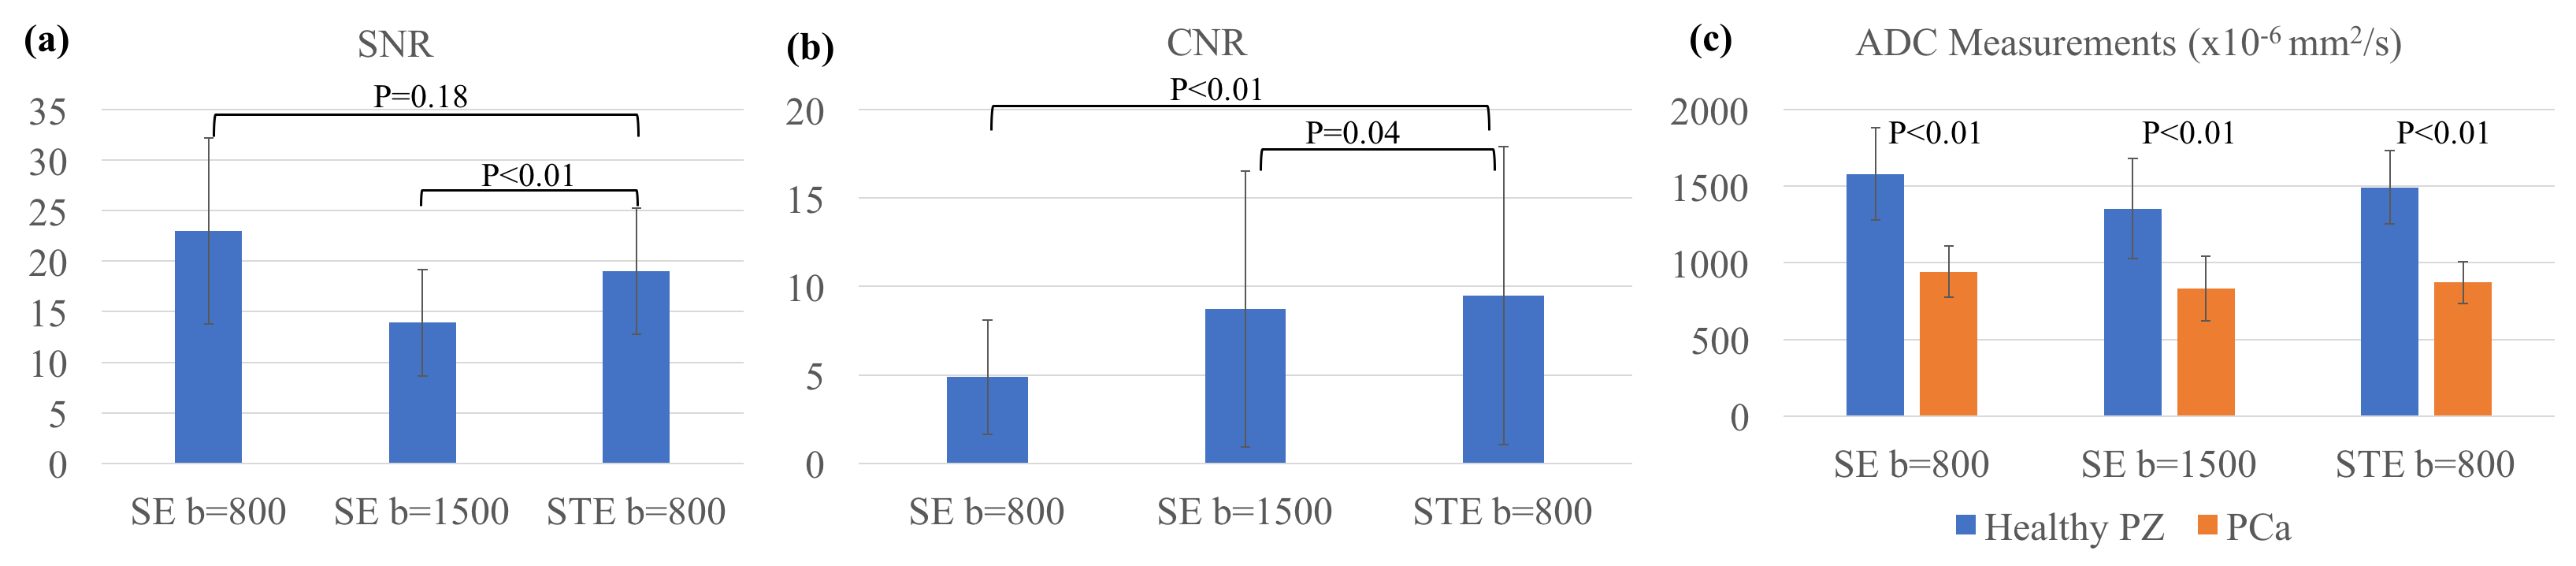
An example patient case is shown in Fig.2 with prostate cancer in the PZ. Preliminary results from the reader study in Table 2 did not show significant difference between different sequences except for SNR. Figure 3 shows the ROI measurements of SNR, CNR and ADC. The SNR of STE b=800s/mm2 is significantly higher than SE b=1500s/mm2 while the CNR is significantly higher than both SE b=800s/mm2 and 1500s/mm2 (although the averaged difference in CNR between STE b=800s/mm2 and SE 1500s/mm2 is small). As expected, the ADC of PCa is significantly lower than healthy PZ in all three sequences.
Discussion
In this study, we have characterized the performance of STE-DWI for assessment of PCa, compared with standard SE methods. From simulations and patient scans, STE-DWI is able to provide high contrast between healthy PZ and cancer without the need for a very high b-value. The disagreement between the reader assessment of image quality and the quantitative evaluation of SNR and CNR is unclear in this preliminary study. Future work will include optimization of mixing time and b-values in STE-DWI, as well as a larger biopsy correlation study to evaluate the performance of STE-DWI compared to SE-DWI.Conclusion
In conclusion, STE-DWI is able to reduce the T2-shinethrough effect in prostate DWI at moderate b-values.Acknowledgements
The authors would like to acknowledge research support from GE Healthcare. The authors acknowledge grant support from NIH-NIDDK Wisconsin Multidisciplinary K12 Urologic Research Career Development Program K12DK100022 (PD: D. Bjorling).References
[1] Tamada, T., Sone, T., Jo, Y., Yamamoto, A. and Ito, K., 2014. Diffusion‐weighted MRI and its role in prostate cancer. NMR in Biomedicine, 27(1), pp.25-38.
[2] Tamada, T., Kanomata, N., Sone, T., Jo, Y., Miyaji, Y., Higashi, H., Yamamoto, A. and Ito, K., 2014. High b value (2,000 s/mm2) diffusion-weighted magnetic resonance imaging in prostate cancer at 3 Tesla: comparison with 1,000 s/mm2 for tumor conspicuity and discrimination of aggressiveness. PLoS One, 9(5), p.e96619.
[3] Metens, T., Miranda, D., Absil, J. and Matos, C., 2012. What is the optimal b value in diffusion-weighted MR imaging to depict prostate cancer at 3T?. European radiology, 22(3), pp.703-709.
[4] Kitajima, K., Kaji, Y., Kuroda, K. and Sugimura, K., 2008. High b-value diffusion-weighted imaging in normal and malignant peripheral zone tissue of the prostate: effect of signal-to-noise ratio. Magnetic Resonance in Medical Sciences, 7(2), pp.93-99.
[5] Bammer, R., 2003. Basic principles of diffusion-weighted imaging. European journal of radiology, 45(3), pp.169-184.
[6] Langer DL, van der Kwast TH, Evans AJ, Trachtenberg J, Wilson BC, Haider MA. Prostate cancer detection with multi‐parametric MRI: Logistic regression analysis of quantitative T2, diffusion‐weighted imaging, and dynamic contrast‐enhanced MRI. J Magn Reson Imag 2009; 30(2):327-334.
[7] Gibbs P, Tozer DJ, Liney GP, Turnbull LW. Comparison of quantitative T2 mapping and diffusion‐weighted imaging in the normal and pathologic prostate. Magn Reson Med 2001;46(6):1054-1058.
[8] De Bazelaire CM, Duhamel GD, Rofsky NM, Alsop DC. MR imaging relaxation times of abdominal and pelvic tissues measured in vivo at 3.0 T: preliminary results. Radiology. 2004 Mar;230(3):652-9.
Figures