1650
Feasibility of abdominal quantitative imaging at 7T: pilot study.1Institute of Scientific Instruments of the CAS, Brno, Czech Republic, 2Department of Biomedical Imaging and Image-guided Therapy, High Field MR Centre, Medical University of Vienna, Vienna, Austria, 3Department of Medicine III, Division of Endocrinology and Metabolism, Medical University of Vienna, Vienna, Austria
Synopsis
This work demonstrates abdominal proton density fat fraction (PDFF)-MRI quantification at 7T magnetic field. Four healthy volunteers with low liver fat infiltration assumption were measured with a 3D-MGE-T1w sequence using 32-channel Rx/Tx array coil at 7T whole body MR scanner. 7T data were reconstructed by complex-based multiecho water-fat separation methods. The same volunteers were measured at a 3T MR system with multiecho Dixon MRI and multiecho single voxel MRS as reference measurements. The results show the feasibility of quantitative liver imaging at 7T.
Introduction/Purpose
Liver fat accumulation plays a significant role in many diseases related to increased fat infiltration. Liver fat quantification is very important not only for steatosis detection, but also in experiments focused on fat physiology in the human body. In the case of fat distribution in the liver hampered by steatosis, it is not entirely clear if fat is distributed homogeneously in entire volume or in foci; optionally, if fat accumulation is equal in all liver lobes. This question is still unclear for healthy liver as well. High-field MRI yields increased signal-to-noise ratio (SNR) that can be traded off into faster image acquisition and improved spatial resolution [1]. On the other hand, MRI high-field is more sensitive to susceptibility artifacts and specific absorption rate (SAR) limitations. Several studies showed body and abdominal 7T imaging [1-4] with different types of coils. Unlike 7T MR imaging, 7T MR spectroscopy was successfully optimized and validated [5]. In our pilot study we performed quantitative high resolution PDFF-MRI at ultra-high-field (7T) to acquire quantitative maps of fat infiltration over the entire field-of-view. The work demonstrates abdominal PDFF-MRI quantification feasibility at 7T magnetic field.Method
4 healthy young volunteers (2 male, 2 female, age 25.5±4.1 years) were measured on a) 3T Siemens Prisma Fit using 18-channel array coil in combination with 32-channel spine coil (both Rx/Tx) and b) 7T Siemens MAGNETOM using Rx-/Tx- 32-channel multipurpose array coil, consisting of two main parts: bottom (spine: 4x4 array) and top (4 independent parts, each of them consisting of 4 coil elements). The upper-coil segments were positioned in order to ensure whole liver coverage by RF-signal. b) 7T measurements: 3D-MGE sequence: TR=11ms, 6-echoes with first TE=1.65ms and 1.41ms echo-spacing, FA=5° to reduce undesirable T1 effect, voxel size: 1×1×4 mm3, 32 slices with 20% slice-gap, bandwidth=1560Hz/px, GRAPPA acceleration factor R=8, bipolar acquisition, acquisition time TA=21s. The acquired data were combined over coils by ASPIRE [6]. Offline water-fat reconstruction was performed in MATLAB® toolbox [7] by multiresolution method that helps manage the selection of the correct decomposition at each voxel [8] and/or Graph-Cut algorithm [9]. A complex signal model with multi-frequency [10] modelling (6-peak fat) was used. Four parameters were estimated: w, f, ΔB and T2*. The calculated water and fat images were partially rid of T1-weighting before the calculation of fat fractions [11]. a) 3T measurements: 3D-MGE sequence: TR=9.7ms, 6-echoes with TE=1.06, 2.46, 3.69, 4.92, 6.15, 7.38ms, FA=4°, voxel size: 1.2×1.2×3.5 mm3, 48 slices with 20% slice gap, bandwidth = 1080 Hz/px, CAIPIRINHA [12] with acceleration factor (R)=2, bipolar acquisition, 3D acceleration (R)=2, acquisition time TA = 13 s. The evaluation was performed by Siemens’ Fat fraction quantification tool embedded in sequence protocol. Spectroscopic data were acquired during breath-hold with high-speed T2-corrected multi-echo (HISTO) sequence [13] (including evaluation PDFF) with TR=3000 ms, TEs=[12, 24, 36, 48, 72]ms; voxel size 20×20×20 mm, TA=15s.Results
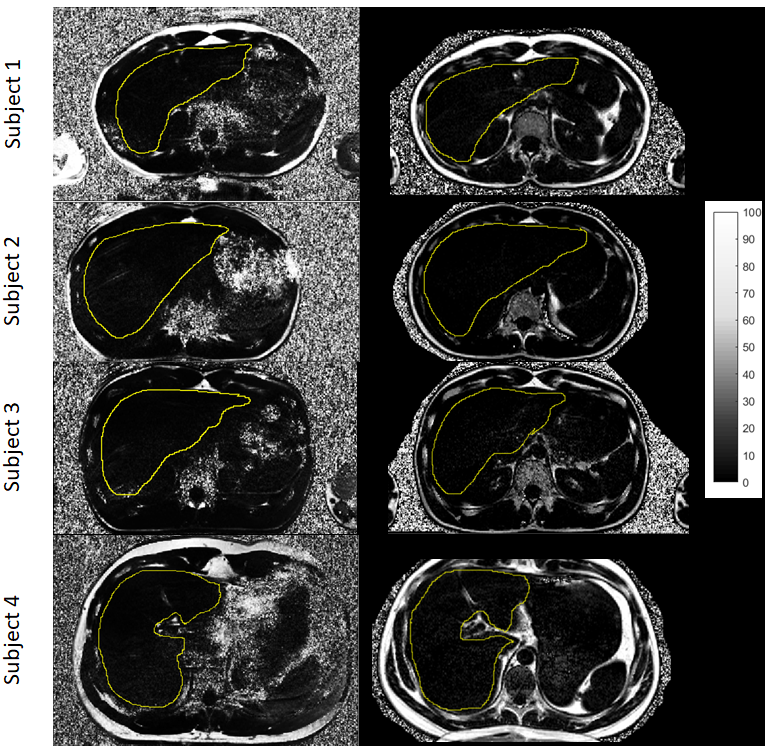
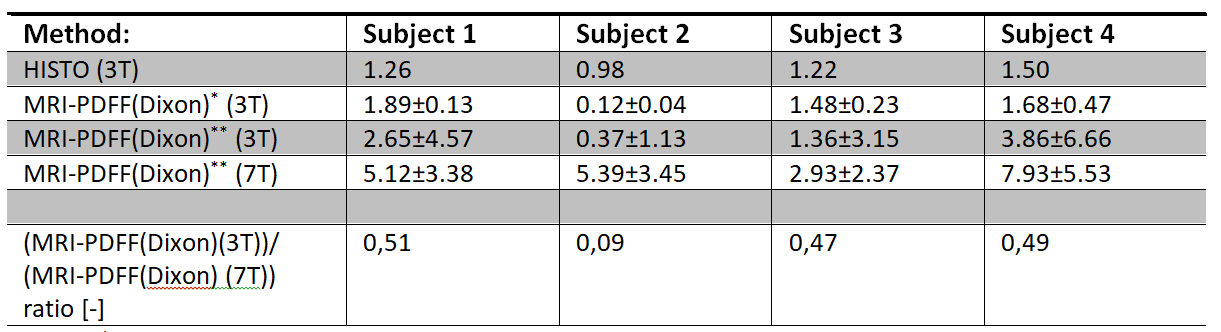
The measurements and data reconstruction could be successfully performed for all four volunteers. PDFF maps of largest cross section of the liver acquired at 3 and 7 Tesla are shown in Figure 1. The mean values of PDFF assessed by the respective methods are given in the Table 1.Discussion/Conclusion
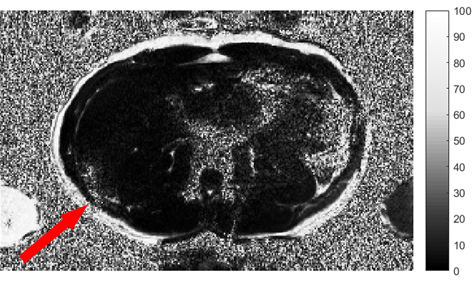
In this work, we have tested the feasibility of quantitative abdominal MRI at 7T by using a 32-channel Rx/Tx array coil. We were able to create PDFF maps of hepatic tissue. Nevertheless, direct comparison with a similar measurement at the clinical field strength of 3T shows overestimation of 7T PDFF. This inconsistency is caused by B1 inhomogeneity and stronger undesirable magnetic susceptibility effect in comparison with 3T. Unfortunately we have experienced almost complete signal loss in parts of the images, especially in case of patients with larger body mass. Moreover, the quality of 7T data was hampered by stronger motion artifacts compared to 3T due to longer acquisition. To improve our acquired data we used ASPIRE reconstruction for the phase combination of single-channel images. Thus, the measurement sequence at 7T requires further parameters optimization for shortening of measurement time. Despite these problems, we show the feasibility of quantitative abdominal measurements at 7T field. Our preliminary results show that PDFF-MRI at 7T with 32-channel Rx/Tx array coil is promising and provides reliable FF maps, however further optimization is required.Acknowledgements
This work was partially supported by the European Commission and Ministry of Education, Youth, and Sports (projects No. CZ.1.05/2.1.00/01.0017, LO1212; No. 7AMB18AT023) and the Czech Academy of Sciences (project No. MSM100651801).References
[1] Laader A, Beiderwellen K, Kraff O, Maderwald S, Wrede K, Ladd ME, Lauenstein TC, Forsting M, Quick HH, Nassenstein K, Umutlu L. 1.5 versus 3 versus 7 Tesla in abdominal MRI: A comparative study. PLoS One. vol. 12(11), pp. e0187528.
[2] Vaughan JT, Snyder CJ, DelaBarre LJ, Bolan PJ, Tian J, Bolinger L, Adriany G, Andersen P, Strupp J, Ugurbil K. 7 T Whole Body Imaging: Preliminary Results. Magn Reson Med. 2009, vol. 61(1), pp. 244-8.
[3] Orzada, Stephan, Soeren Johst, A. Bitz, Oliver Kraff, Irina Brote, Susanne Ladd, Mark E. Ladd and Stefan Maderwald. 7 Tesla Abdominal Imaging using TIAMO. Proc. Intl. Soc. Mag. Reson. Med. 19 (2011).
[4] Philips BWJ, Fortuin AS, Orzada S, Scheenen TWJ, Maas MC. High resolution MR imaging of pelvic lymph nodes at 7 Tesla. Magn Reson Med. 2017, vol. 78(3), pp.1020-1028.
[5] Gajdošík M, Chadzynski GL, Hangel G, Mlynárik V, Chmelík M, Valkovič L, Bogner W, Pohmann R, Scheffler K, Trattnig S, Krššák M. Ultrashort‐TE stimulated echo acquisition mode (STEAM) improves the quantification of lipids and fatty acid chain unsaturation in the human liver at 7 T. NMR Biomed. 2015, vol.28(10), pp. 1283-1293.
[6] Eckstein K, Dymerska B, Bachrata B, Bogner W, Poljanc K, Trattnig S, Robinson SD. Computationally Efficient Combination of Multi-channel Phase Data From Multi-echo Acquisitions (ASPIRE). Magn Reson Med. 2018 Jun; vol. 79(6), pp.2996-3006.
[7] Hu HH, Bornert P, Hernando D, Kellman P, Ma J, Reeder S, Sirlin C. ISMRM workshop on fat-water separation: insights, applications and progress in MRI. Magn Reson Med 2012;68(2):378-388.
[8] J. Tsao and Y. Jiang, “Hierarchical IDEAL: fast, robust, and multiresolution separation of multiple chemical species from multiple echo times.,” Magn Reson Med, vol. 70(1), pp. 155-159, 2013.
[9] D. Hernando, P. Kellman, J. Haldar and Z. Liang, “Robust water/fat separation in the presence of large field inhomogeneities using a graph cut algorithm.,” Magn Reson Med, vol. 63(1), pp. 79-90, 2010.
[10] H. Yu, A. Shimakawa, C. McKenzie, E. Brodsky, J. Brittain and S. Reeder, “Multiecho water-fat separation and simultaneous R2* estimation with multifrequency fat spectrum modeling.,” Magn Reson Med, vol. 60(5), pp. 1122-1134, 2008.
[11] Liu C-Y, McKenzie CA, Yu H, Brittain JH, Reeder SB. Fat quantification with IDEAL gradient echo imaging: correction of bias from T(1) and noise. Magn Reson Med. 2007;58:354–364.
[12] Breuer FA, Blaimer M, Mueller MF, Seiberlich N, Heidemann RM, Griswold MA, Jakob PM . Controlled aliasing in volumetric parallel imaging (2D CAIPIRINHA). Magn Reson Med 2006;55:549–556.
[13] Pineda N, Sharma P, Xu Q, Hu X, Vos M, Martin DR. Measurement of hepatic lipid: high-speed T2-corrected multiecho acquisition at 1H MR spectroscopy--a rapid and accurate technique. Radiology 2009, vol. 252(2), pp. 568-76.
Figures