1649
Comparison of MAGiC and MR Fingerprinting for Quantitative Relaxation of T1 and T2 Maps in Female PelvisGigin Lin1, Guido Buonincontri2,3, Jianxun Qu4, Ching-Yi Hsieh1, and Chien-Yuan Eddy Lin5
1Department of Medical Imaging and Intervention, Chang Gung Memorial Hospital, Linkou, Taiwan, 2IMAGO7 Foundation, Pisa, Italy, 3National Institute for Nuclear Physics, Pisa, Italy, 4GE Healthcare MR Research China, Beijing, China, 5GE Healthcare, Taipei, Taiwan
Synopsis
T1 and T2 mapping of tissues provides valuable information for characterization of tissue pathologies but is limited by long scan time and consequently hampered the clinical practice. Magnetic resonance image compilation (MAGiC) and Magnetic resonance fingerprinting (MRF) are novel imaging techniques to simultaneously provide quantitative maps of tissue relaxation times in a single acquisition. This study aimed to compare the quantitative values of T1 and T2 in the female pelvic region using the MAGiC and MRF.
Purpose:
Quantitative maps of T1 and T2 allowing absolute quantification of tissue relaxation times has emerged as tools for accurate disease evaluation1,2 and longitudinal follow-up. However, T1 and T2 measurement is time-consuming which hinder it clinical application. Recent breakthrough in magnetic resonance fingerprinting3 (MRF) and magnetic resonance image compilation4 (MAGiC) brings the potential of simultaneous quantitative T1 and T2 maps in one acquisition into reality, for synthesizing various tissue contrast such as T1, T2, T2-FLAIR. With similar advantages in these two promising techniques, no literature mentioned the difference in image quality and the quantitative values between MRF and MAGiC. The aim of this study was to compare the quantitative values of relaxation times in the female pelvic region using the MRF and MAGiC.Methods:
All MRI acquisitions were performed on a 1.5T clinical scanner (Discovery MR450w, GE Healthcare, Milwaukee, USA) using anterior and posterior array coils as the signal detection covering pelvic region and whole-body coil for radio-frequency excitation. MAGiC was acquired using a 2D fast-spin echo based multi-saturation-delay multi-echo. Steady-state free precession (SSFP) was employed for MRF acquisition5,6 and its acquisition trajectories used 89 undersampled golden-angle spiral interleaves with sampling bandwidth = ±250kHz, TR = 9ms, TE = 2.2ms, NEX=1, and 979 frames. The scan flip angle list from Jiang et al5. B0 and B1 were not included in the dictionary but slice profile was included to improve T2 accuracy. Other imaging parameters used in MAGiC and MRF scans were: FOV=22 mm x 22 mm; matrix=256 x 256; slice thickness = 4mm with 1-mm gap; 20 slices. The scanning time of MAGiC and MRF scans were 4 minutes and 3.6 minutes, respectively.Results:
MAGiC and MRF successfully generated T1 and T2 maps in the female pelvis, as shown in Fig. 1. The signal-to-noise ratios for both T1 and T2 maps were higher using MAGiC than MRF. Similar tissue contrast was observed in T1 maps between MRF and MAGiC. MRF T2 map appeared to lose details compared with MAGiC T2 map, especially in areas with significant chemical shift such as fat and bone marrow. Quantitative T1 values were comparable for both MRF and MAGiC in the uterine myoma, endometrium, myometrium, ovary, muscle, bone and fat (Tab. 1). Apparent lower T2 value was found in MRF in comparison with MAGiC.Discussion and Conclusion:
In this study, we applied MRF and MAGiC in pelvic region which revealed that contrast in MAGiC T1 and T2 maps as well as MRF T1 map is promising and can distinguish the different regions. Reasonable quantitative T1 and T2 maps in both MAGiC and MRF has been previous reported but only in stationary brain tissue6,7, not in the body part. However, the quantitative estimation at the pelvis need to be further validated. With SSFP MRF, the inversion pulse applied before the readout train, as well as variable flip angles, all contribute to impart T1 weighting, which results in a robust T1 quantification. On the other hand, the stimulated echoes within the used SSFP MRF acquisitions were less efficient at encoding T2. Further optimization for MRF sampling strategy, such as the one used in abdomen by Chen et al8, optimization of schedules, as well as more sophisticated signal models including chemical shift, B0 or B1 correction could be needed in the pelvic region in order to improve the MRF T2 values.Acknowledgements
No acknowledgement found.References
1. Shah B, et al. (2011) Quantitative MR Imaging: Physical Principles and Sequence Design in Abdominal Imaging. Radiographics. 31:867-875. 2. Lescher et al. (2015). Quantitative T1 and T2 mapping in recurrent glioblastomas under bevacizumab: earlier detection of tumor progression compared to conventional MRI. Neuroradiology. 57:11-20. 3. Tanenbaum, L.N. et al. (2017). Synthetic MRI for clinical neuroimaging: results of the magnetic resonance image compilation (MAGiC) prospective, multicenter, multireader trial. AJNR Am J Neuroradiol. 38(6):1103-1110. 4. Ma, D. et al. (2013). Magnetic resonance fingerprinting. Nature. 495(7440):187-92. 5. Jiang Y et al. (2015) MR fingerprinting using fast imaging with steady state precession (FISP) with spiral readout. Magn Reson Med 74:1621–1631. 6. Buonincontri et al. (2018). Repeatability of 2D FISP MR Fingerprinting in the Brain at 1.5T and 3.0 T. ISMRM, #682. 7. Li et al. (2018). Quantitative validation of the image contrast generated by MAgnetic Resonance image Compilation (MAGiC) technique. ISMRM #2632. 8. Chen et al. (2016). MR Fingerprinting for Rapid Quantitative Abdominal Imaging. Radiology. 279:278-286.Figures
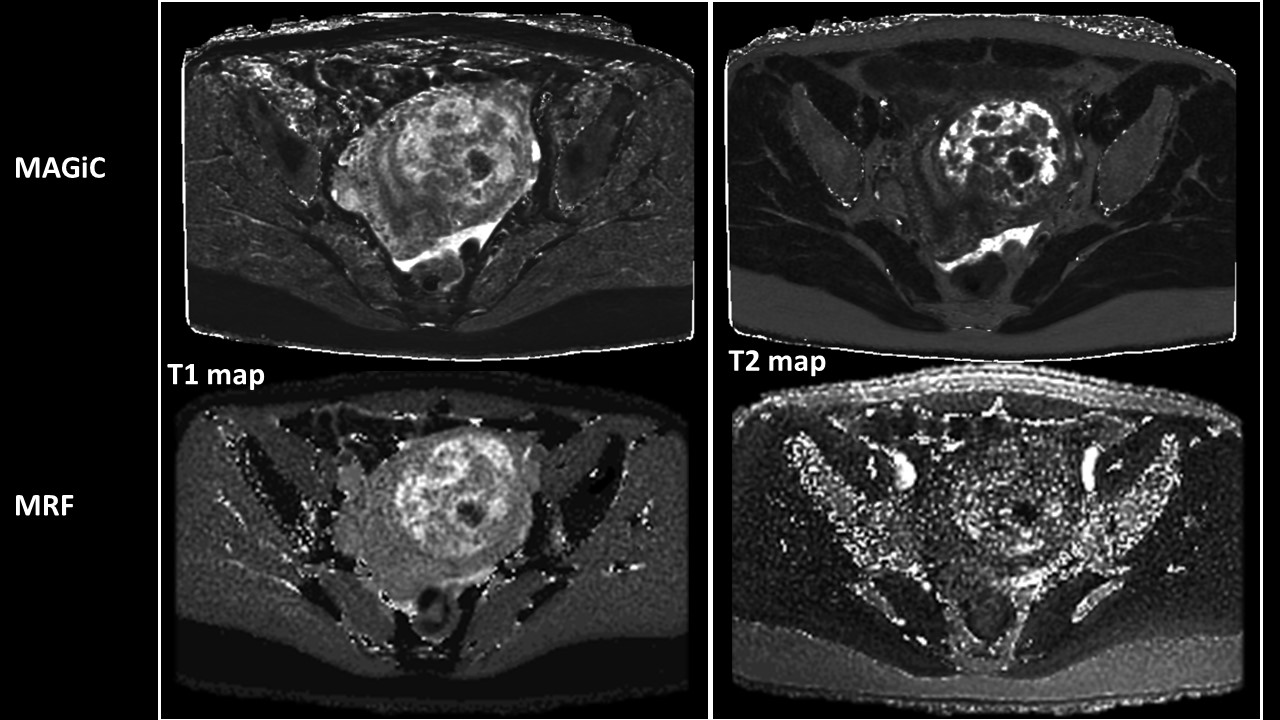
Fig.1 T1 and T2 maps generated by MAGiC and
MRF
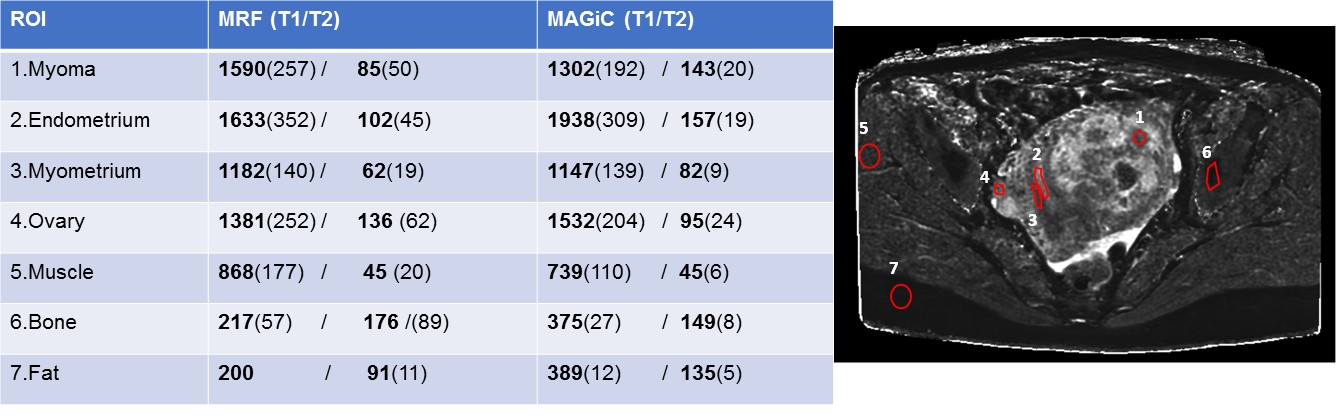
Tab. 1 Quantitative T1/T2 values in female
pelvis