1647
MRI-based R2* Mapping in Patients with Suspected or Known Iron OverloadAn Lesage1, Philippe Paquin1, Jack W Luo2, Milena Cerny1,3, Anne Shu-Lei Chin1, Damien Olivié1, Guillaume Gilbert1,4, Denis Soulières5, and An Tang1,3
1Department of Radiology, Centre hospitalier de l'Université de Montréal, Montréal, QC, Canada, 2McGill University, Montréal, SK, Canada, 3Centre de recherche du Centre hospitalier de l'Université de Montréal, Montréal, QC, Canada, 4MR Clinical Science, Philips Healthcare Canada, Markham, ON, Canada, 5Department of Hematology-oncology, Centre hospitalier de l'Université de Montréal, Montréal, QC, Canada
Synopsis
The purpose of this study is to analyze the cross-sectional relationships of MRI-based R2* relaxometry values in organs across patients with various types of iron overload. Further analyses were conducted to analyze R2* values in organs according to the treatment regimen of patients (transfusion, phlebotomy, and chelation therapy). This retrospective, cross-sectional study includes 82 adult patients with known or suspected iron overload due to primary and secondary hemochromatosis. Results revealed differences between degree of iron overload in organs according to the underlying pathology and treatment regimens.
Introduction
Iron overload disorders can be either primary, as in hereditary hemochromatosis, or secondary, where they are usually associated with chronic liver diseases, ineffective erythropoiesis, or transfusion.1 The severity and distribution of iron overload among organs varies according to the underlying pathology. Different patterns of iron deposition have previously been described,2,3 based on the results of several studies.4-9 Most studies are pathology-specific, focus on one or few organs of interest, or use different methods of MRI-based iron quantification.10,11 The purpose of this study was to analyze the cross-sectional relationships between MRI-based R2* relaxometry in multiple organs across patients with various types of iron overload. Secondary analyses were conducted to analyze R2* values in organs according to the treatment regimen of patients. Treatment modalities studied were transfusion and chelation therapy.Methods
This retrospective, cross-sectional, institutional review board-approved study included 82 adult patients (41 men, 41 women; mean age, 46.3 ± 13.6 [mean ± standard deviation]) with known or suspected iron overload due to hereditary hemochromatosis; alpha- and beta-thalassemia; sickle cell disease; other causes of transfusional hemosiderosis (myelodysplatic syndromes; Diamond-Blackfan anemia; aplastic anemia; or hyperferritinemia of undetermined origin). MRI-based R2* relaxometry was performed at 1.5T (Achieva XR, Philips Healthcare, Best, The Netherlands) by using multiecho gradient-recalled echo (GRE) imaging. R2* values were measured by segmenting the liver, spleen, bone marrow, pancreas, renal cortex, renal medulla, and heart (Figure 1). With the exception of the heart, which was imaged using a dedicated cardiac-triggered R2* mapping acquisition, R2* values for the other organs were derived from a water/fat quantification algorithm, thus addressing the confounding factor arising from the possible presence of fat in these organs.The transfusion status was determined based on enrollment in a blood transfusion program and the chelation status was determined based on receiving chelation therapy for at least 6 months at the time of MRI. Analyses included correlation, Kruskal-Wallis analysis of variance tests, and post-hoc Dunn tests. Comparisons were made between organs and underlying pathologies causing iron overload. P values < 0.01 were considered significant to account for multiple comparisons.Results
Overall, correlations between liver R2* values and other organs were either moderate (spleen, bone marrow and heart) or weak (pancreas, kidney) (Figure 2). Overall, R2* values were significantly different regarding causes of iron overload in the liver (P < 0.001), spleen (P < 0.001), bone marrow (P < 0.01), renal cortex (P < 0.001), and renal medulla (P < 0.001) between patients with primary and secondary overload (Figure 3). Spleen R2* values were significantly higher in thalassemia than in hereditary hemochromatosis (P < 0.001), and significantly higher in sickle cell disease than in hereditary hemochromatosis (P < 0.001). Bone marrow R2* values were significantly higher in thalassemia than in hereditary hemochromatosis (P < 0.01) and significantly higher in sickle cell disease than in hereditary hemochromatosis (P < 0.001). Renal cortex R2* values were significantly higher in sickle cell disease than in hereditary hemochromatosis (P < 0.001) and significantly higher in sickle cell disease than in thalassemia (P < 0.01). Renal medulla R2* values were significantly higher in sickle cell disease than in hereditary hemochromatosis (P < 0.001). In patients with thalassemia, liver R2* values were significantly higher in those enrolled in a transfusion program than in those who were not (P < 0.01). In patients with sickle cell disease or with myelodysplastic syndromes, the R2* values in the liver and other organs did not differ significantly according to the enrollment status in a transfusion program. In patients with thalassemia and sickle cell disease, bone marrow R2* values were significantly lower in patients who had received a chelation therapy than in those who had not (P < 0.01). R2* values of liver, spleen, pancreas, kidney, and heart did not differ according to the chelation therapy status.Discussion
MRI-based R2* relaxometry revealed differences in degree and distribution of iron overload between organs. In particular, spleen and bone marrow R2* values were higher in pathologies associated with ineffective erythropoiesis (sickle cell disease and thalassemia) than in hereditary hemochromatosis, owing to a preferential distribution in the reticuloendothelial system. Enrollment in a transfusion program increased R2* values in the liver of patients with thalassemia. Chelation therapy decreased the R2* values in the bone marrow in patients with thalassemia and sickle cell disease.Conclusion
The distribution of iron overload, as measured by R2* relaxometry, varies between organs depending on the underlying pathology and may be used for diagnostic purpose or to predict complications.Acknowledgements
Research Scholarship from the Fonds de Recherche du Québec en Santé and Fondation de l'association des radiologistes du Québec (FRQS-ARQ #34939) to An Tang.References
- Piperno A. Classification and diagnosis of iron overload. Haematologica 1998;83:447-55.
- Queiroz-Andrade M, Blasbalg R, Ortega CD, et al. MR imaging findings of iron overload. Radiographics. 2009;29:1575-89.
- Labranche R, Gilbert G, Cerny M, et al. Liver Iron Quantification with MR Imaging: A Primer for Radiologists. Radiographics. 2018;38:392-412.
- Lande IM, Glazer GM, Sarnaik S, Aisen A, Rucknagel D, Martel W. Sickle-cell nephropathy: MR imaging. Radiology 1986;158:379-83.
- Midiri M, Lo Casto A, Sparacia G, et al. MR imaging of pancreatic changes in patients with transfusion-dependent beta-thalassemia major. AJR American journal of roentgenology 1999;173:187-92.
- Siegelman ES, Mitchell DG, Outwater E, Munoz SJ, Rubin R. Idiopathic hemochromatosis: MR imaging findings in cirrhotic and precirrhotic patients. Radiology 1993;188:637-41.
- Siegelman ES, Mitchell DG, Rubin R, et al. Parenchymal versus reticuloendothelial iron overload in the liver: distinction with MR imaging. Radiology 1991;179:361-6.
- Siegelman ES, Mitchell DG, Semelka RC. Abdominal iron deposition: metabolism, MR findings, and clinical importance. Radiology 1996;199:13-22.
- Porter JB. Pathophysiology of transfusional iron overload: contrasting patterns in thalassemia major and sickle cell disease. Hemoglobin 2009;33 Suppl 1:S37-45.
- Franca M, Marti-Bonmati L, Porto G, et al. Tissue iron quantification in chronic liver diseases using MRI shows a relationship between iron accumulation in liver, spleen, and bone marrow. Clinical radiology 2018;73:215.e1-.e9.
- Gutierrez L, House MJ, Vasavda N, et al. Tissue Iron Distribution Assessed by MRI in Patients with Iron Loading Anemias. PloS one 2015;10:e0139220.
Figures
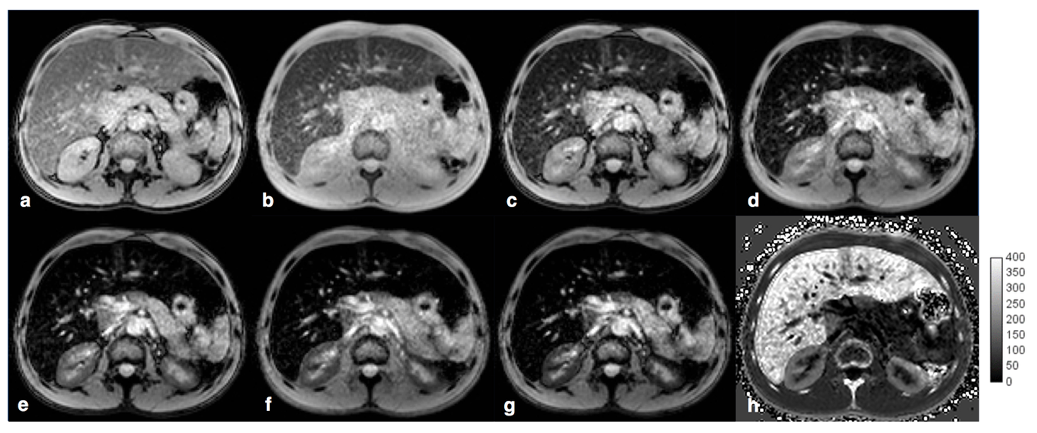
39-year-old man with sickle cell disease and
iron overload due to hemosiderosis. Multiecho MR imaging at 1.5 T with echo
times of (a) 2.3, (b) 4.6, (c) 6.9, (d) 9.2, (e) 11.5, (f) 13.8 and (g) 16 .1
msec, respectively. (h) Corresponding R2* map shows iron overload
with R2* = 220 s-1 in the liver, 80 s-1 in the right
renal cortex, 88 s-1 in the left renal cortex, and 215 s-1
in the bone marrow. The spleen is absent due to autosplenectomy.
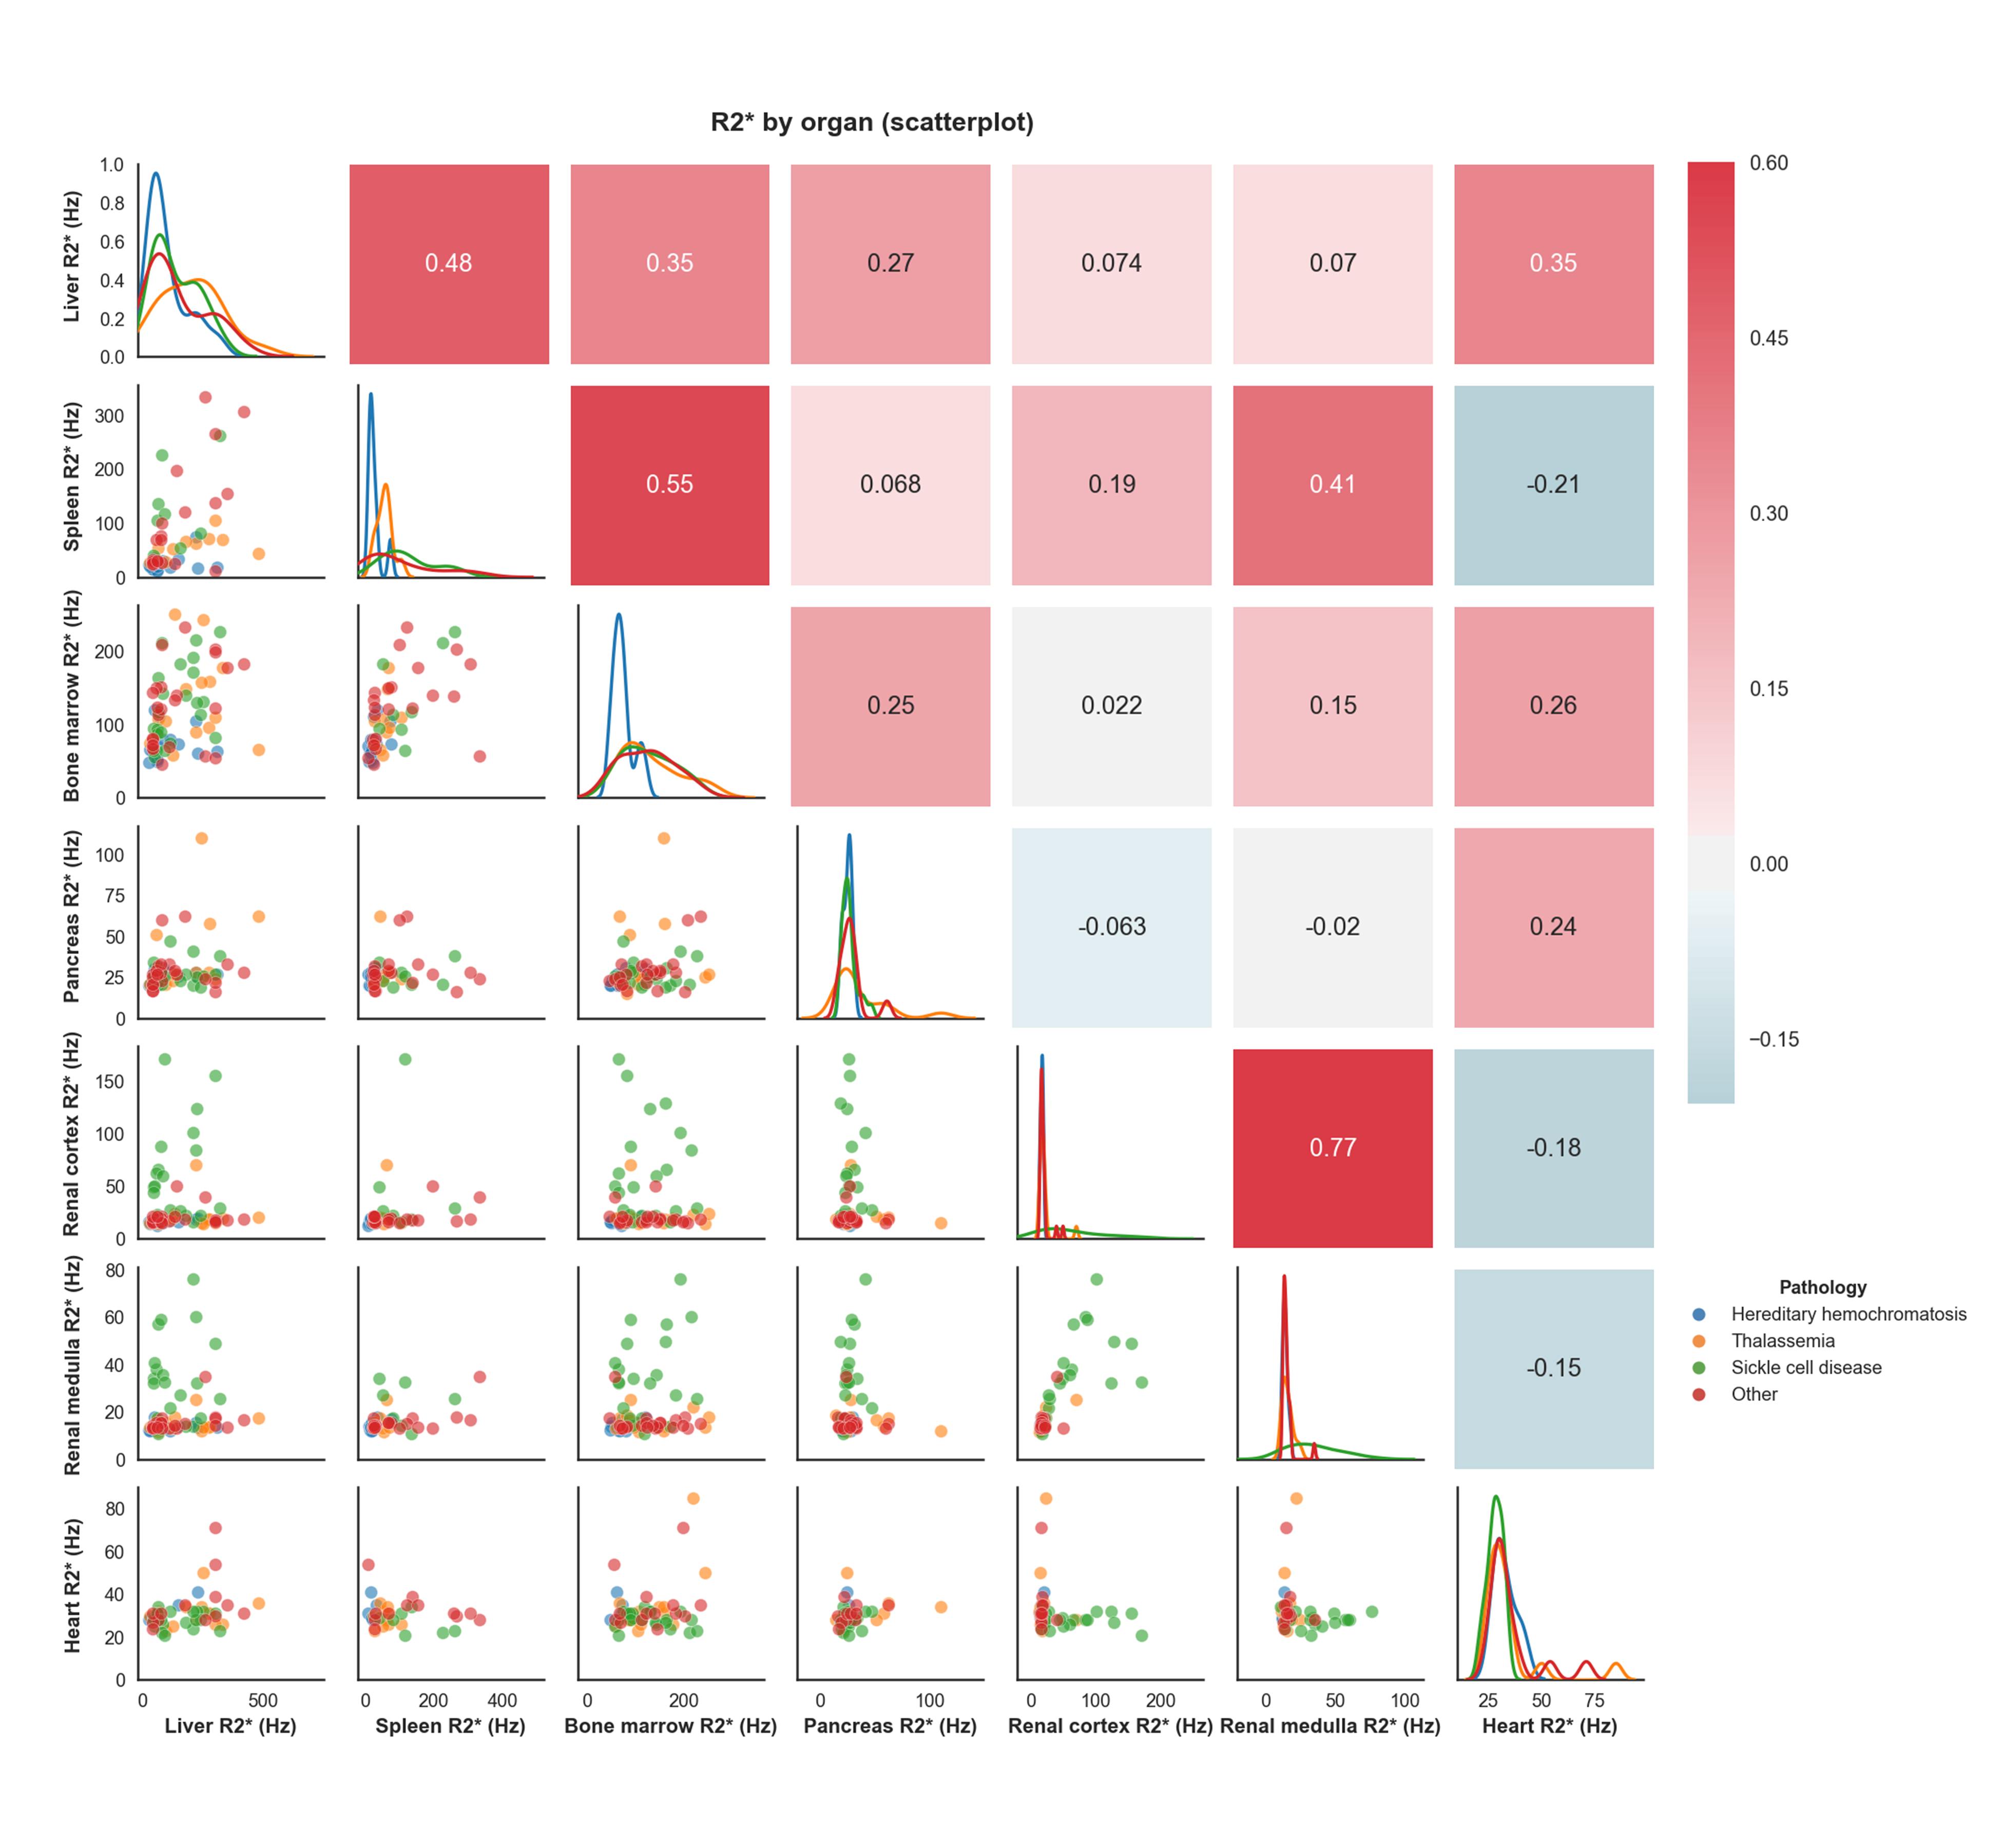
Scatterplot matrix of R2* correlations between
organs in hereditary hemochromatosis, thalassemia, sickle cell disease, and
other pathologies.
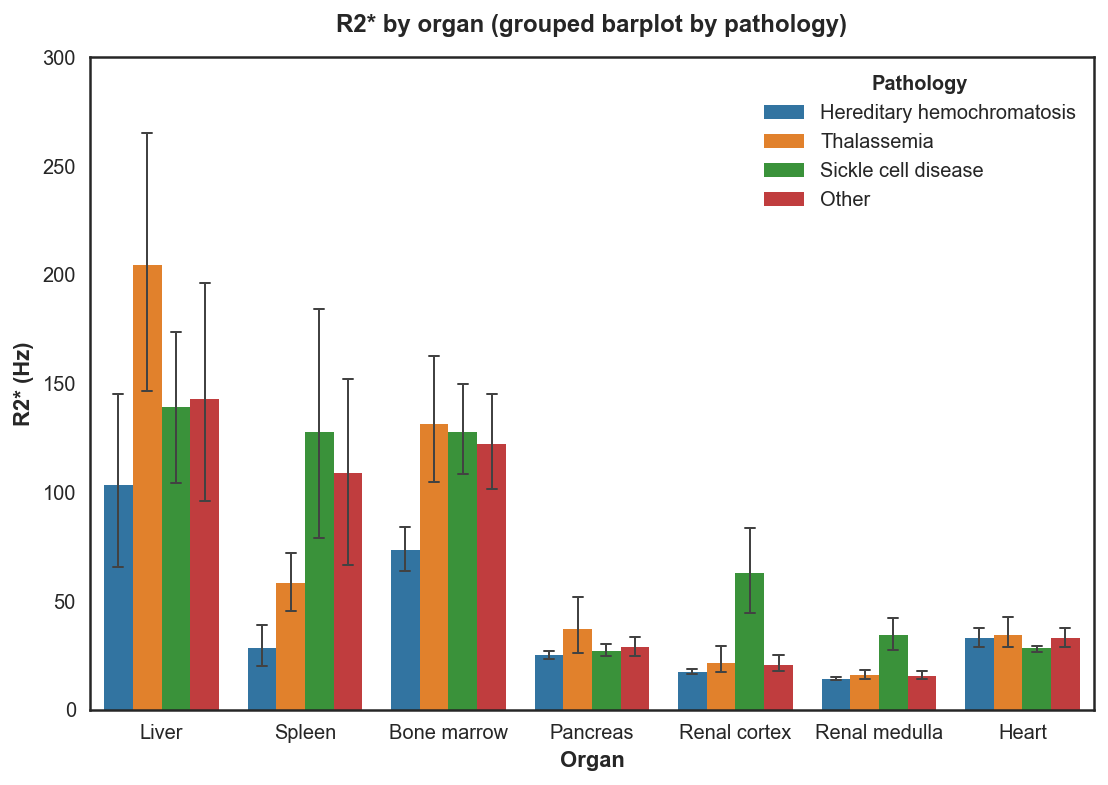
R2*values (95% CI) by organ in patients with
hereditary hemochromatosis, thalassemia, sickle cell disease and other
pathologies.