1639
Texture Analysis Comparison between MR and PET for Prostate Cancer MRI Guided Biopsy1Biomedical Engineering, Cornell University, Ithaca, NY, United States, 2Radiology, Weill Cornell Medicine, New York City, NY, United States
Synopsis
PET scans can detect prostate lesions, locations in the prostate where biopsy could reveal about treatment strategy. PET has low resolution compared to MRI and doesn't show surrounding anatomy necessary for accessing the prostate. Texture feature maps in MRI might include information about lesion location. MRI prostate texture features maps were compared with superimposed PET scans. Preliminary data suggest correlation between PET intensity and PI-RADS score, and weak correlation between less texture and lesion location. Though low texture values might correlate with higher tumor recurrence risk and lead to improved MRI-guided biopsy, finding exact lesion location in MRI remains challenging.
Introduction
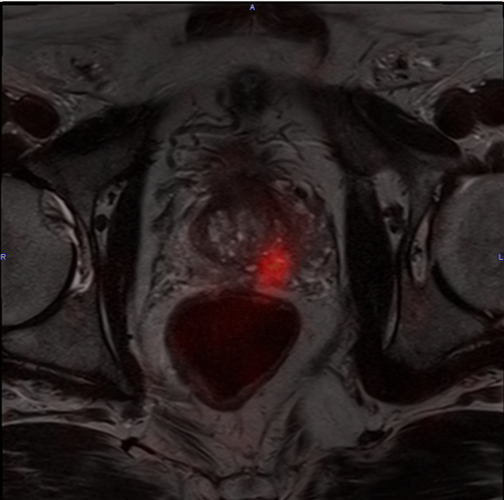
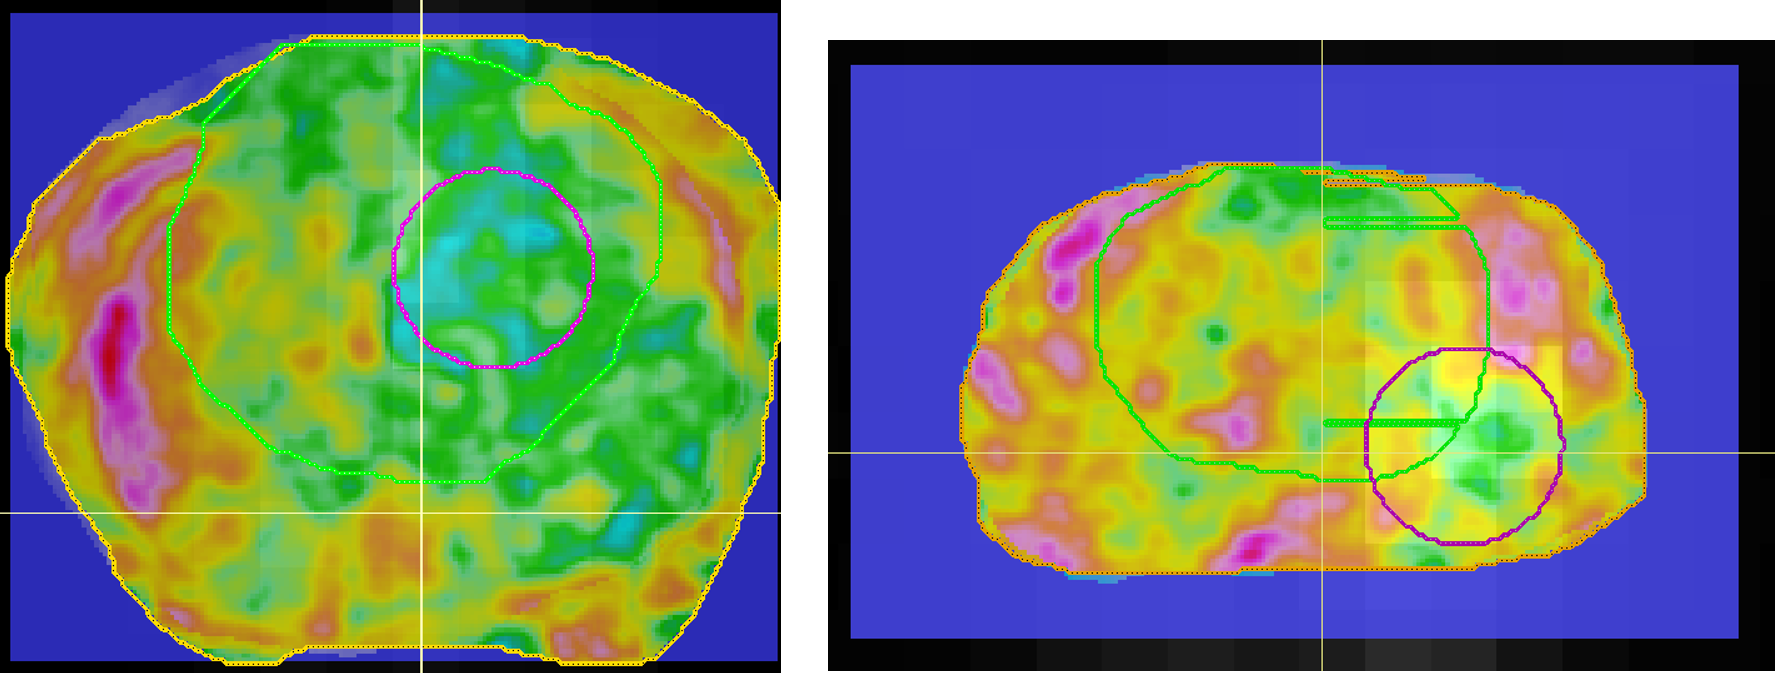
Biopsy is the only way to identify malignant tumors from benign prostatic hyperplasia 1. However limitations of obtaining prostate biopsy include patient discomfort and missing prostate lesion locations during MRI guided biopsy. Biopsy of the lesion locations might reveal more information about tumor grade or malignancy and guide future treatments of the patient. While positron emission tomography (PET) images detect lesion location through functional binding of prostate specific membrane antigen (PSMA) ligand on lesion position, as seen in Fig.1, PET images are low resolution and don’t have display surrounding anatomy like MRI. The aim of this project was to study whether texture features of prostate MRI, including energy and entropy, could detect lesion position similar to PET imaging. This study has implications in improving MRI-guided prostate biopsy.Methods
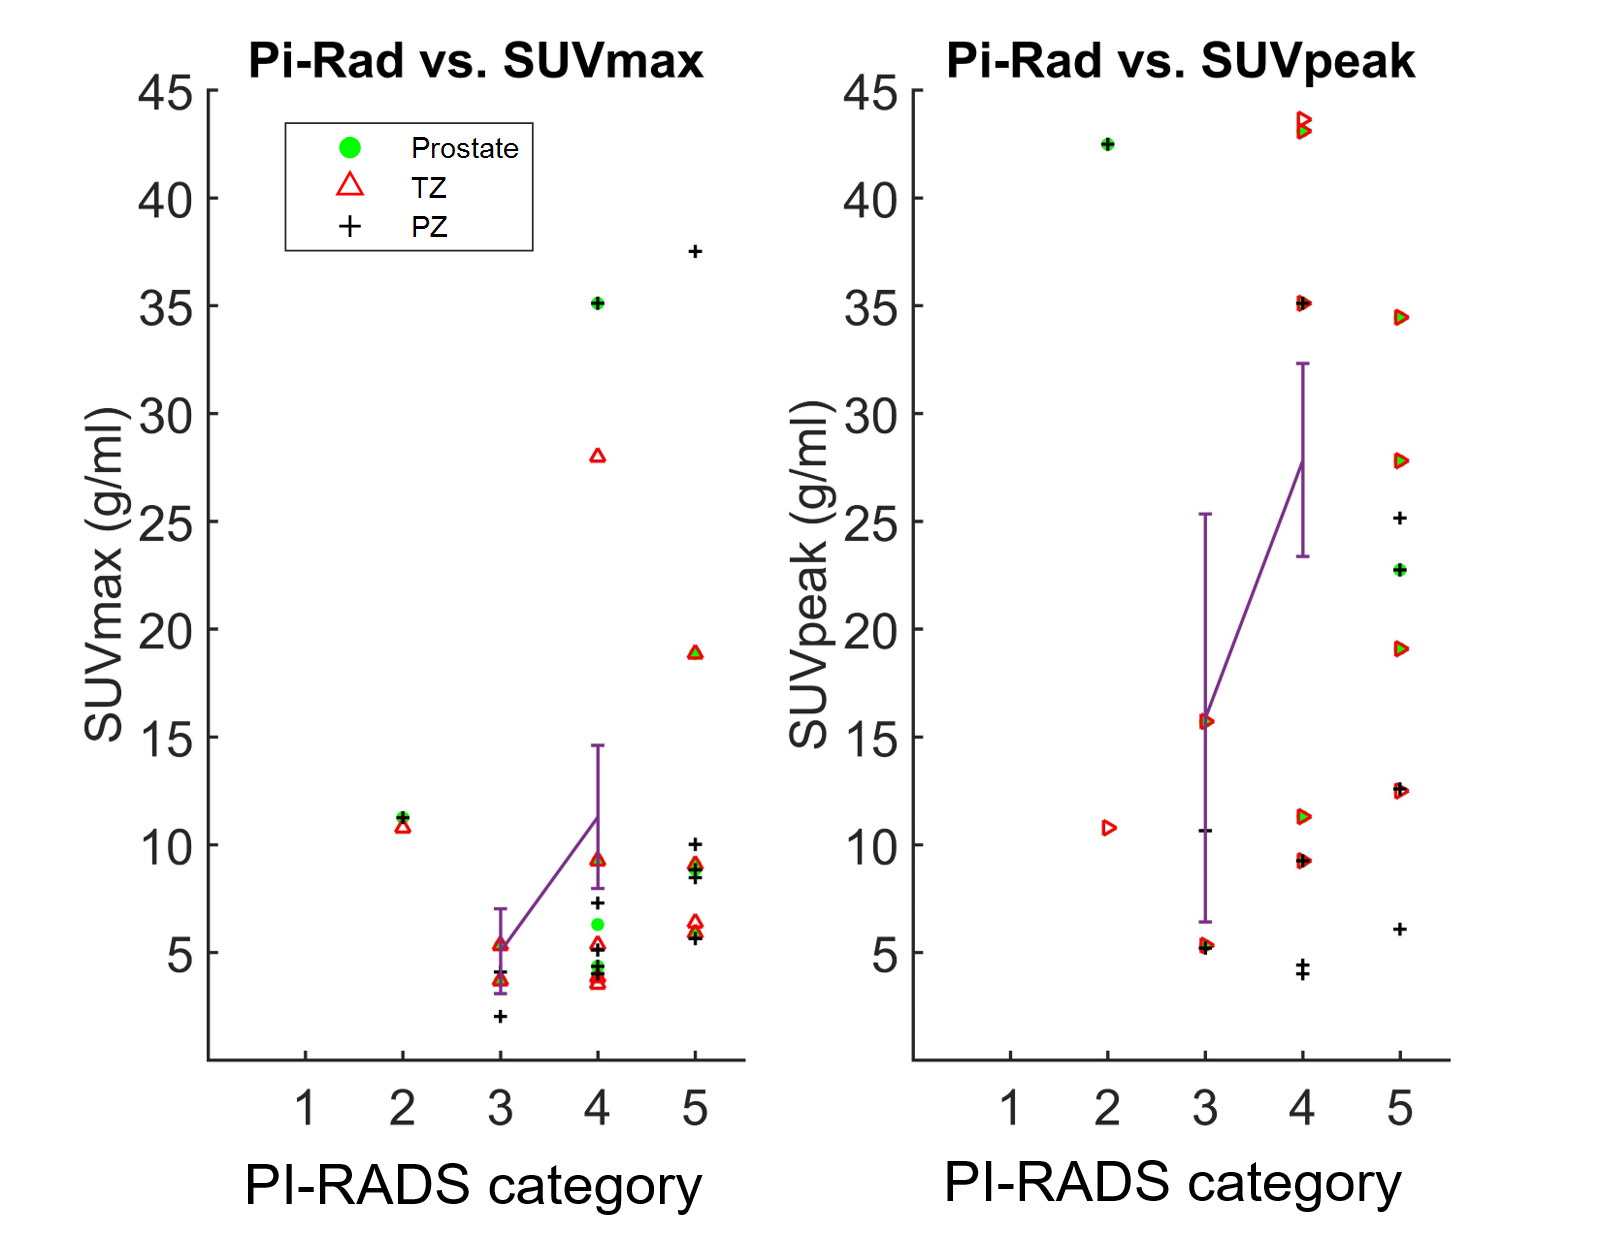
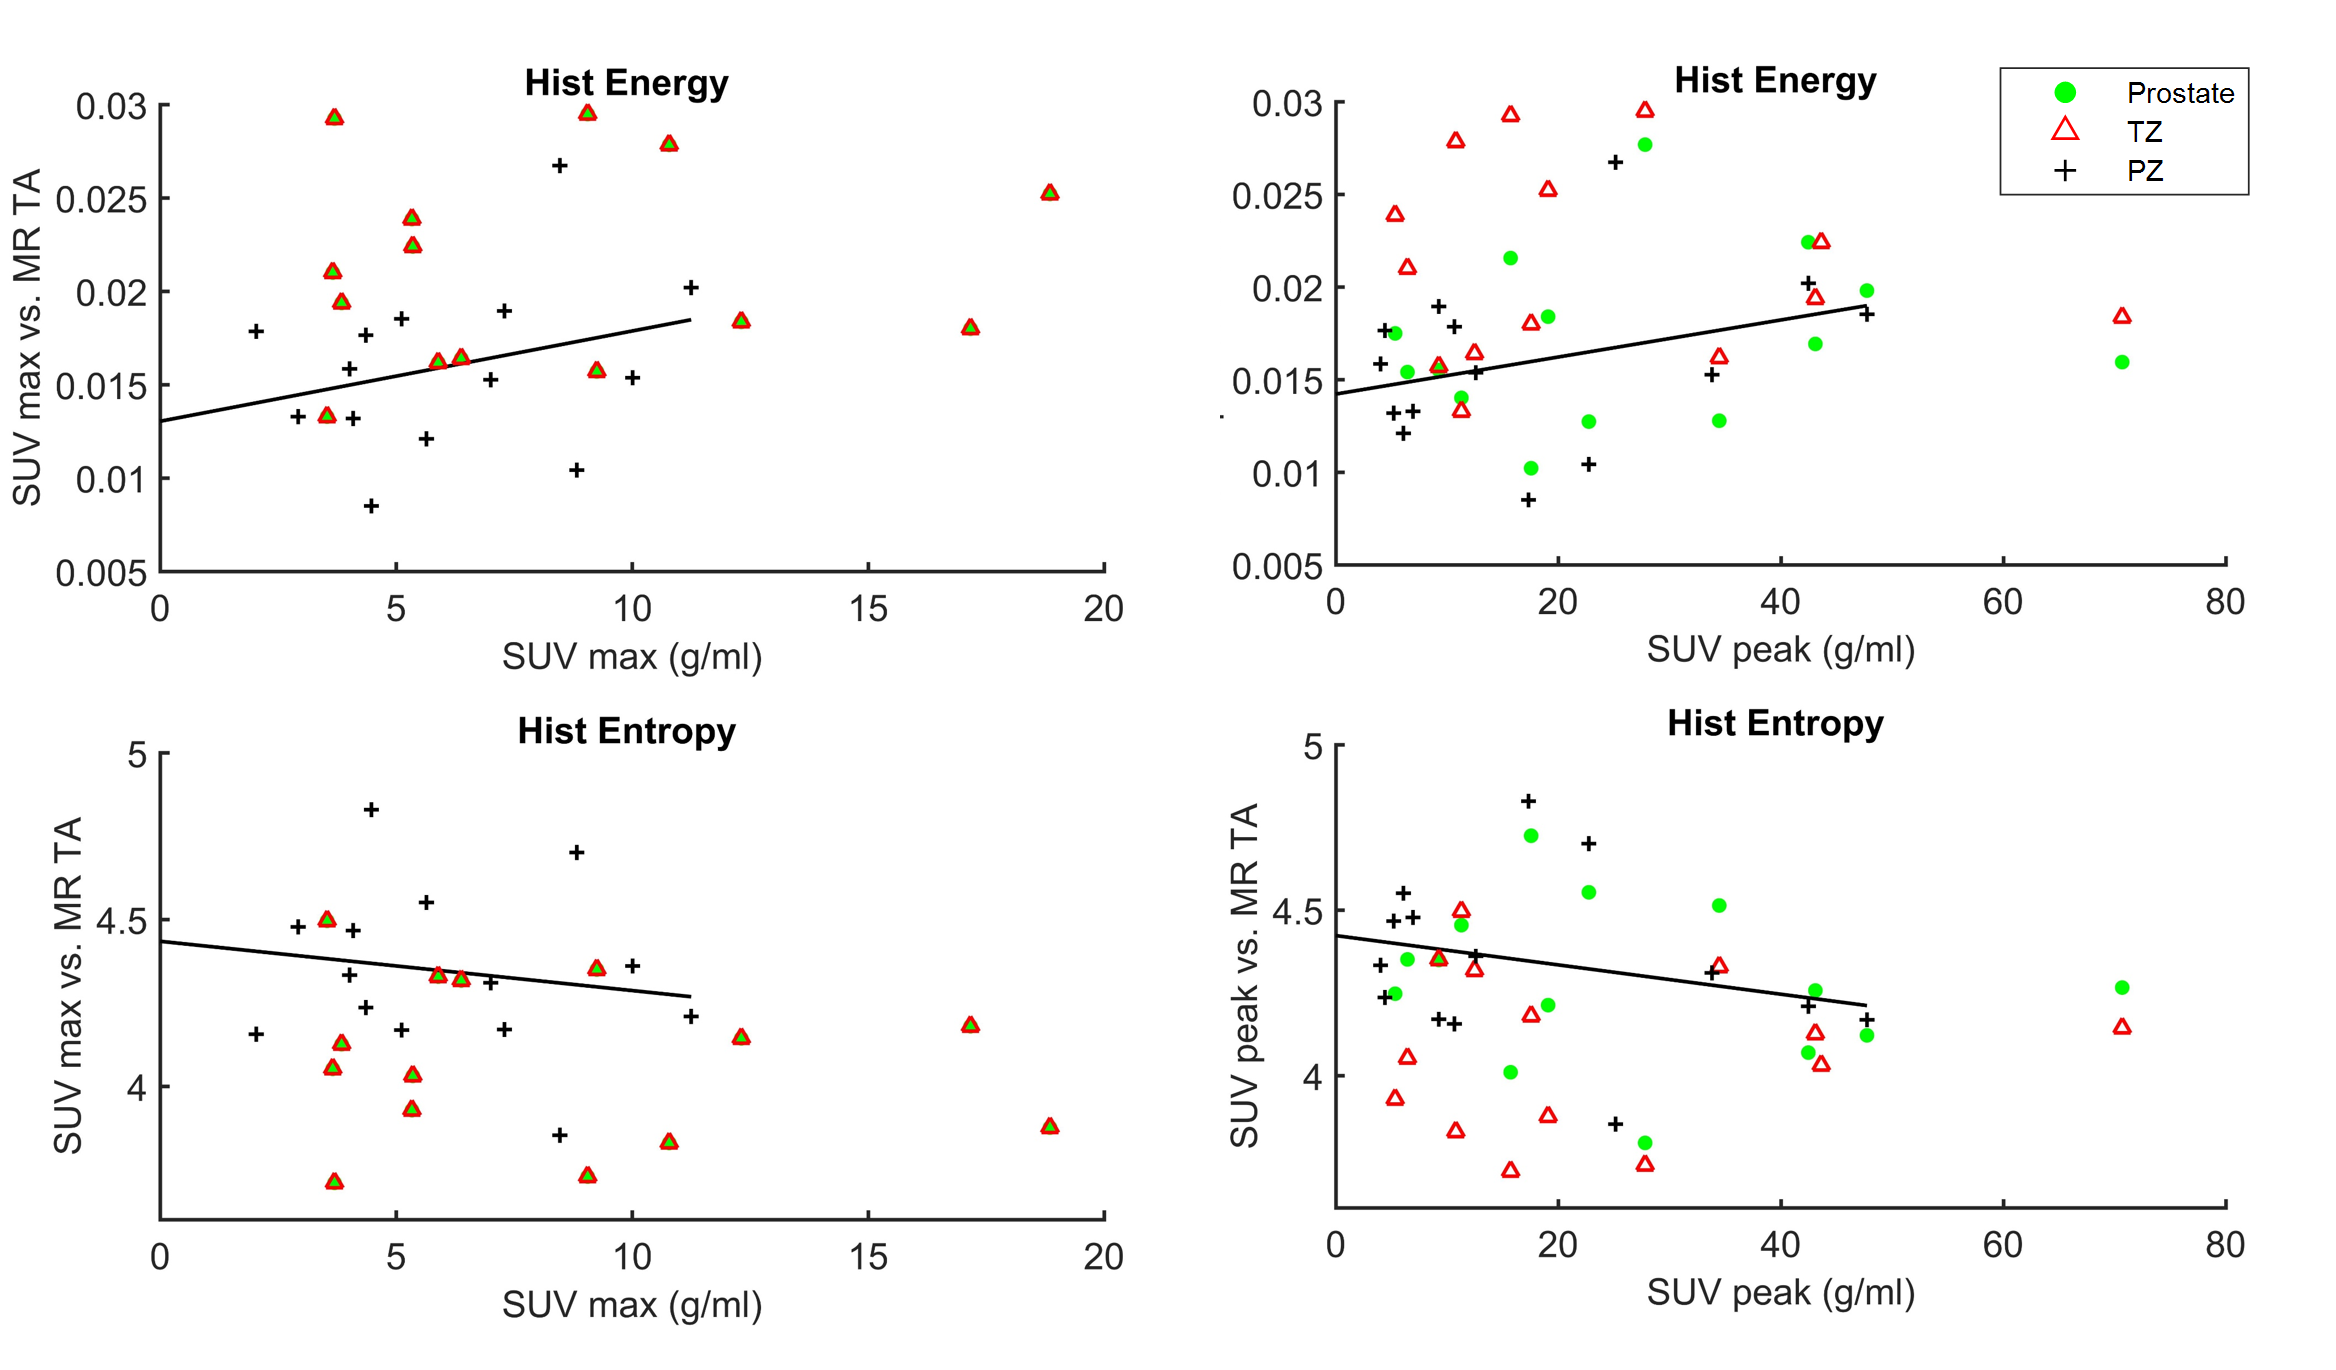
To compare MRI texture feature maps to tumor malignancy, first the relation between SUVmax/SUVpeak (PET intensity) and PI-RADS (likelihood of presumed malignancy) category was compared. The SUVmax indicates the maximum standardized uptake value of PSMA at each voxel location and SUVpeak shows maximum uptake within a sphere with radius of 6.2 mm. The PI-RADS category were obtained from a trained prostate specialized radiologist and it indicates a score of tumor malignancy based on prostate MRI. Radiologist segmented prostate was calculated for global and local texture features of T2 weighted MRI. After comparing various texture feature, energy and entropy were found to have better correlations to SUVmax and SUVpeak. Energy is calculated as the average intensity of all voxels in a kernel, and entropy measures how often a pixel intensity (i) occurs with adjacent pixel intensity (j) in an image kernel.Results
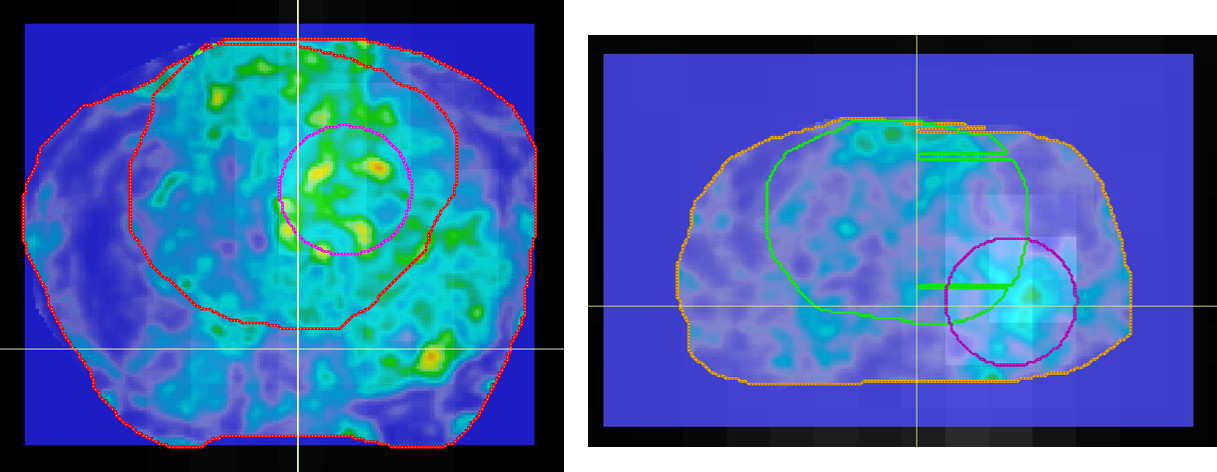
The relation between the SUVs and the PI-RADS scores were calculated to observe whether SUVmax/SUVpeak could be used as a ground truth for tumor malignancy. As indicated in Fig. 2, as PI-RADS category increases, the SUV max and SUV peak correspondingly increase. This positive correlation is present for the entire prostate, and transitional(TZ) and peripheral zones(PZ). Comparison between global energy/entropy and SUV values in Fig. 3 indicated that as SUV increased, energy of the peripheral zone increased but the peripheral zone entropy decreased. Local texture values as seen in Fig.4 and 5 indicated that regions with high SUV correlated with high energy values and low entropy values, in most patients. Together, these results suggest that highly malignant tumor lesions detected in PET scans exhibit low texture in MR images.Discussion
The positive correlation between PI-RADS category and SUVmax/SUVpeak and high energy suggests that high energy and low entropy texture feature is able to detect tumor aggressiveness. One limitations of this analysis was small sample size in PI-RADS category 2 to 3, which makes it is difficult to say whether all patients with a low SUVmax/SUVpeak will have a low PI-RADS category. The relation between low texture and high tumor malignancy seems to match previous reports by Sidju et al. 2 They demonstrated regions containing significant tumor have an entropy value of 5.04 while regions containing benign tumor have a T2 entropy values of 5.12, furthering support this data that malignant tumor display lower entropy. However, other studies 3,4 indicated that tumors with Gleason scores of 6-7 displayed higher entropy and lower energy, which contrasts with this study and Sidhu et al. Furthermore, though six out of the eight patients demonstrated high energy and low entropy near the lesion, some of these also exist outside SUV peak circle.Conclusion
Texture analysis between MR T2 scans and PET images indicate that, T2 energy and PET lesion might overlap, that increasing energy, decreasing entropy, and less texture might correlate with high tumor recurrence, and that SUV peak and SUV max can be use as predictors for the PI-RADS score, or tumor malignancy. Despite these promising preliminary results, one major drawback of this study is its small sample size of 16 patients, with only 9 patients for the image overlay analysis. As this is an ongoing study, adding more patients will indicate whether the trends observed currently are still retained. Future studies include adding more patients to this ongoing study and validating tumor aggressive regions with Gleason score of pathology slides. Overall, this study indicates that MR T2 entropy texture has a possibility of identifying lesion location similar to PET scanning.Acknowledgements
No acknowledgement found.References
1. Zamuner, Marina et al. "Impact Of Benign Prostatic Hyperplasia Pharmacological Treatment On Transrectal Prostate Biopsy Adverse Effects". Advances In Urology, vol 2014, 2014, pp. 1-4. Hindawi Limited, doi:10.1155/2014/271304.
2. Sidhu, Harbir S. et al. "“Textural Analysis Of Multiparametric MRI Detects Transition Zone Prostate Cancer”". European Radiology, vol 27, no. 6, 2016, pp. 2348-2358. Springer Nature, doi:10.1007/s00330-016-4579-9.
3. Wibmer, Andreas et al. "Haralick Texture Analysis Of Prostate MRI: Utility For Differentiating Non-Cancerous Prostate From Prostate Cancer And Differentiating Prostate Cancers With Different Gleason Scores". European Radiology, vol 25, no. 10, 2015, pp. 2840-2850. Springer Nature, doi:10.1007/s00330-015-3701-8.
4. Alexandratou, E., Yova, D., Gorpas, D., Maragos, P., Agrogiannis, G., & Kavantzas, N. (2008). Texture analysis of tissues in Gleason grading of prostate cancer. Imaging, Manipulation, and Analysis of Biomolecules, Cells, and Tissues VI,6859(4). doi:10.1117/12.763377
Figures