1638
Axillary MRI relaxometry as a tool for assessing risk of lymphedema development1Physical Medicine and Rehabilitation, Vanderbilt University Medical Center, Nashville, TN, United States, 2Radiology, Vanderbilt University Medical Center, Nashville, TN, United States
Synopsis
We applied a novel application of T2 mapping in a longitudinal study to evaluate whether MRI relaxometry may hold more potential than current measures for portending breast-cancer-treatment-related-lymphedema (BCRL) progression. Baseline biophysical and T2 measurements were performed in patients following lymph node removal. Patients were then monitored for BCRL progression (duration=two years). Baseline descriptive (age, BMI, number of nodes removed) and biophysical (bioimpedance, tissue dielectric, and arm volume) measures did not discriminate between patients who did vs. did not progress, yet baseline T2 was regionally elevated in those who progressed. MRI relaxometry may serve as a tool to identify BCRL risk.
Introduction
The overall goal of this work is to apply novel MRI approaches, sensitive to hypothesized indicators of lymphatic flow dysfunction, to evaluate the potential for these methods to portend lymphedema progression in breast cancer survivors following lymph node (LN) removal. The lymphatic system comprises a central component of the circulatory system, and lymphatic dysfunction and secondary lymphedema is the most common chronic comorbidity associated with cancer therapies1, 2. A fundamental limitation pertains to inabilities to identify early markers of lymphatic dysfunction following LN removal in a stage where prophylactic therapies can reduce the risk of irreversible damage. Risk prediction is currently performed using coarse measurements such as body-mass-index (BMI), number of LN removed, limb circumference, and bioimpedance spectroscopy (BIS), yet these metrics provide incomplete indicators of progression risk3. This study objective was to test the hypothesis that following LN removal, water relaxation time variations, which have demonstrated sensitivity to lymphatic mobilization therapies4, have potential for indicating lymphedema progression risk.Methods
All volunteers (n=13; age=61±11 years; BMI=29.3±4.9 kg/m2; axillary LN removed=6±6) provided informed written consent and were scanned at 3.0T (Philips) using dual B1 transmit and 16-channel torso receive coil. Patients were scanned following LN removal surgery prior to overt signs of swelling and were monitored for progression for two years.
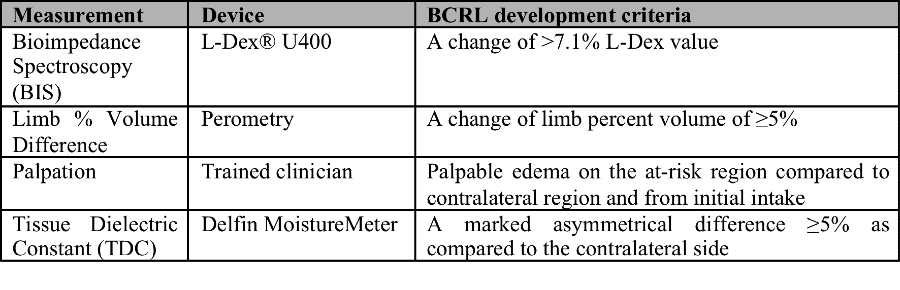
Clinical endpoint. The clinical endpoint of breast cancer treatment related lymphedema (BCRL) was determined (Table 1) in each participant by a certified lymphedema physical therapist.
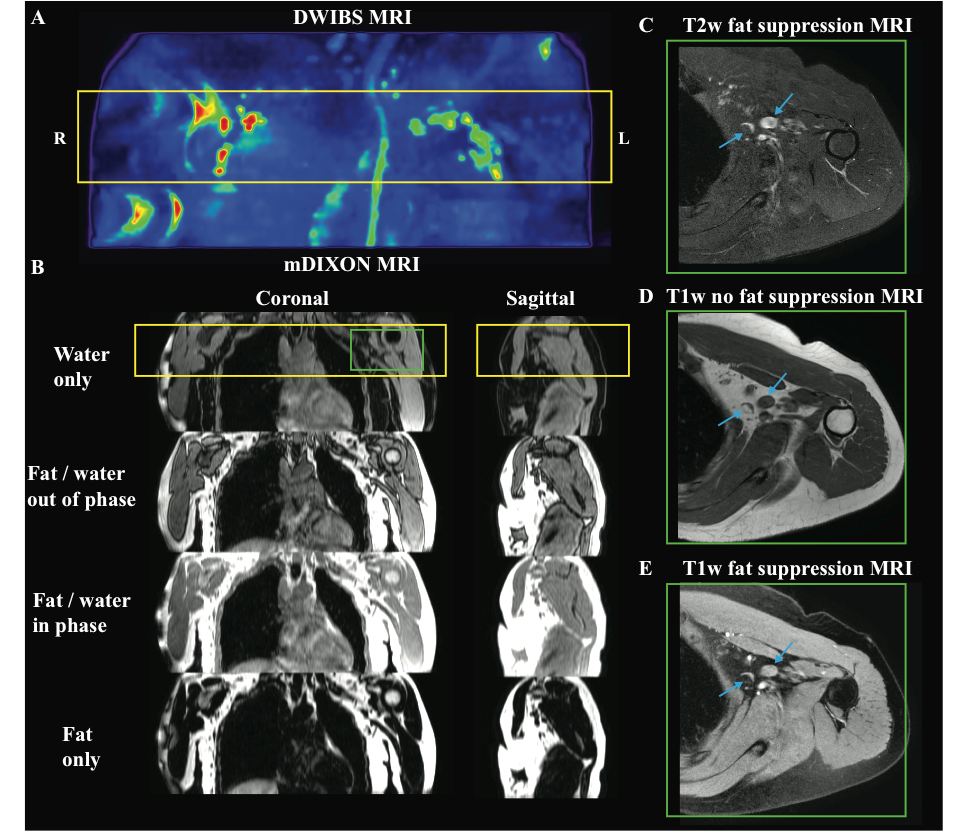
MRI Experiment. Recently published lymphatic MRI relaxation times5 were utilized to perform high spatial resolution imaging of the axilla and LN for planning purposes (Figure 1). Multi-point Dixon imaging was applied (spatial resolution of 0.9x0.7x2.5 mm3; dual-echo per TR=3.5 ms, TE1=1.15, TE2=2.3 ms, flip angle=10 degrees; 3D gradient echo readout; duration=18s) in the transverse imaging plane over a bilateral field-of-view (FOV=520x424x202.5 mm3). Quantitative T2 relaxation time mapping with B0 and B1 correction was performed over the axillary region (FOV=520x424x50 mm3; spatial resolution=1.8x1.5x5.5 mm3; slices=9) using a multi-echo turbo-spin-echo sequence (TE=9–189 ms; TE-interval=12 ms; TR=4000 ms)4.
Biophysical measures. Biophysical exams were performed at post-surgical baseline and repeated for BCRL monitoring during the two-year surveillance period. Biophysical measurements included arm volume (mL; Perometer 400NT, Pero-System, Wuppertal, Germany), tissue dielectric constant (TDC; Delphin MoistureMeterD, Kuopio, Finland) at the inner upper arm, and bioimpedance spectroscopy (BIS; ImpediMed L-Dex® U400, Carlsbad, CA) measuring impedance of each arm, which scales with the extracellular fluid content of the arm6.
Analysis. T2 maps were calculated from the baseline post-surgical scan using a constrained fitting routine of the signal intensity as a function of TE. Deep arm muscle and superficial skin tissue were analyzed separately. Participants were grouped into those patients who did vs. did not meet the BCRL clinical endpoint at two-years. A Wilcoxon rank-sum test was applied to determine if the mean T2 at baseline imaging was different between groups.
Results
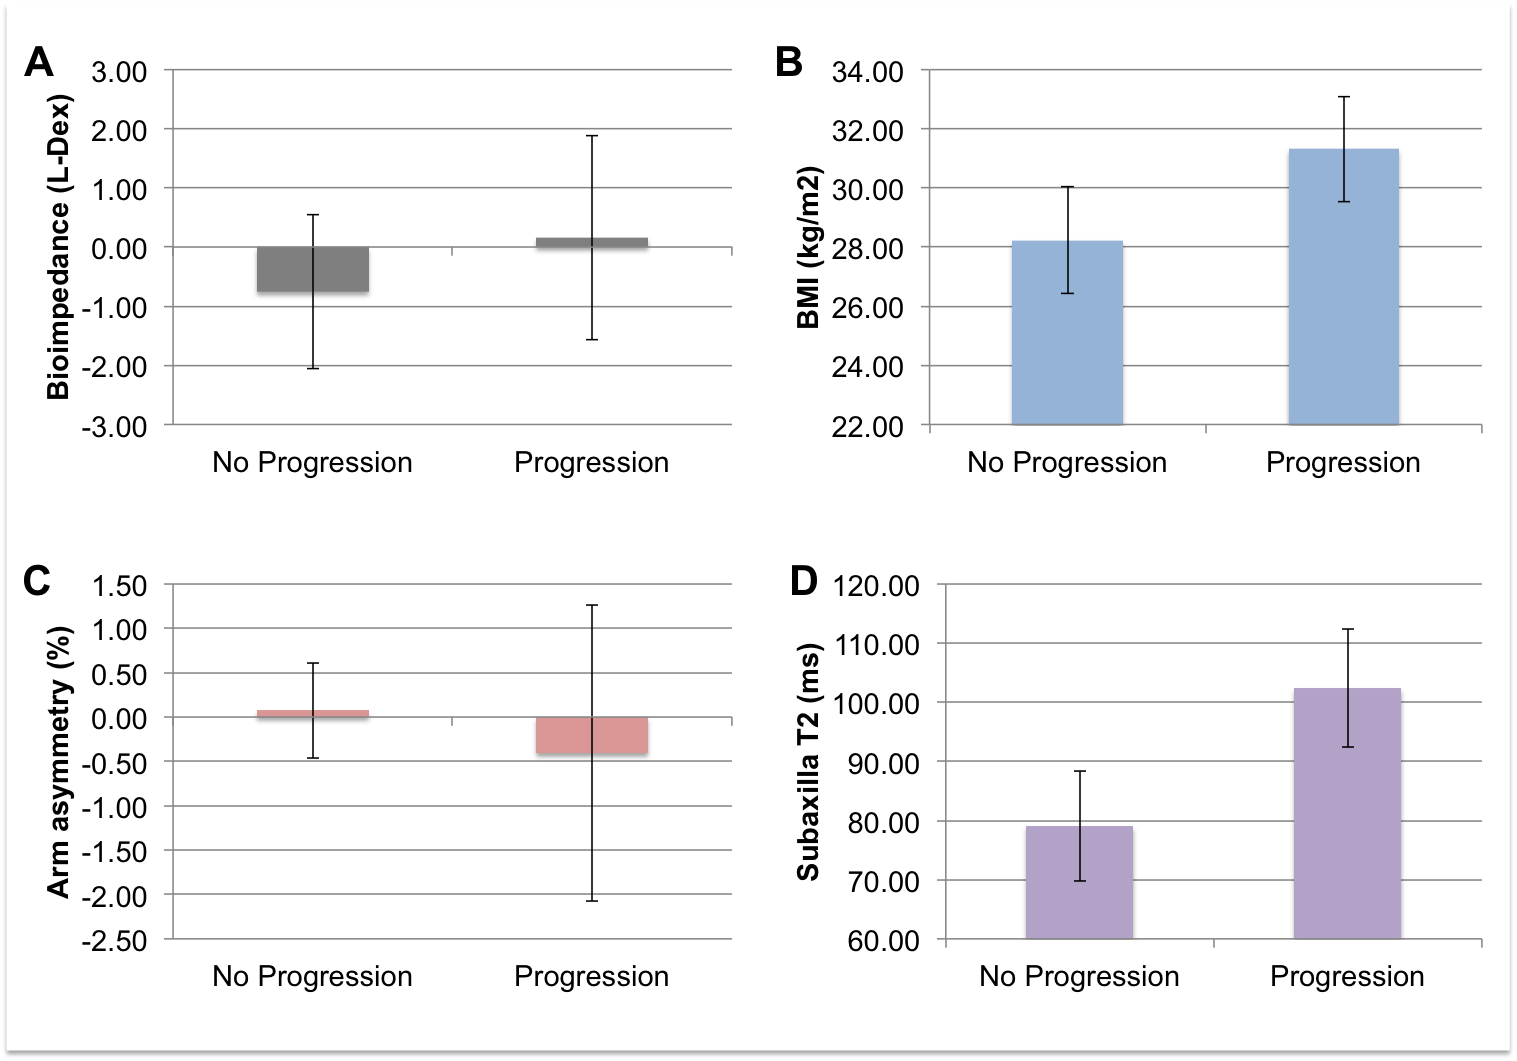
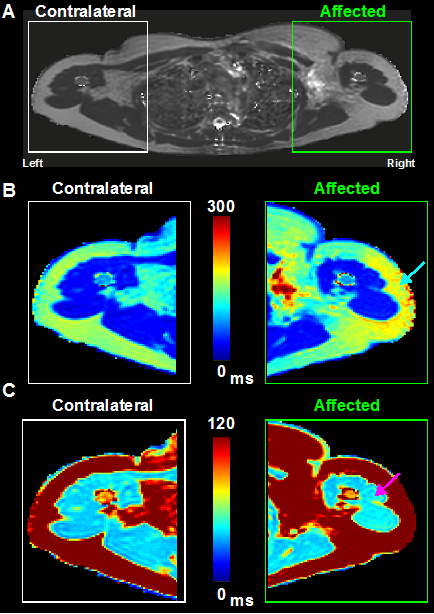
38.5% of patients (5/13) met the endpoint of lymphedema during this two-year surveillance. The BMI, age, and number of LN removed in patients who progressed vs. did not progress (BMI=31.3±4.0 kg/m2 vs. 29.3±5.09 kg/m2; age=59.4±9.65 years vs. 62±11.9 years; LN removed=6±5.6 vs. 5.5±6.3) were not statistically different (p>0.20in all cases). Additionally, commonly-applied biophysical measures at baseline did not yield any significant findings between those that eventually progressed vs. those that did not progress to BCRL (BIS=0.16±3.86 vs.-0.76±3.67; arm volume % difference= -0.41±3.34 vs. 0.07±1.52; inner upper arm TDC absolute difference=1.00±5.68 vs. 0.25±3.29). By contrast, a strong trend for elevated baseline T2 was observed in those who progressed (subaxilla T2 involved limb=102.43±19.32 ms and contralateral limb=85.26±25.44 ms) vs. those who did not progress (subaxilla T2 involved limb=79.07±21.15 ms and contralateral limb=70.46±30.63 ms) to BCRL (Figure 2,3).Discussion
A strong trend for baseline T2 elevation in the entire subaxilla region was found in patients who progressed to developing BCRL compared to those who were at-risk but did not progress. This finding was visually conspicuous across multiple axillary regions (Figure 3). Alternatively, age, BMI, number of LN removed, and the current biophysical methods for surveillance of BCRL risk did not demonstrate differences between these two groups. Quantitative T2 may provide an attractive noninvasive internal marker to identify and triage patients most at-risk for BCRL into early treatment to address this currently unmet clinical need.Conclusions
Quantitative T2 in superficial tissue was regionally elevated in patients at-risk for BCRL who progressed to meet clinical lymphedema criteria in two years. MRI may provide a more sensitive subclinical biomarker for lymphedema risk than current clinical standards. Future larger cohort studies following patients longitudinally is warranted.Acknowledgements
We would like to thank our research coordinators, Helen Mahany and Katie Lants as well as our MRI technicians, Chris Thompson, Leslie Mcintosh and Claire Jones for assisting with recruitment and care of the study participants. We would like to thank the NIH/NINR for funding this study (NIH/NINR 1R01NR01507901) and all of our study participants in the giving of their time and dedicated support.References
1. Can AG, Eksioglu E, Bahtiyarca ZT, Cakci FA. Assessment of Risk Factors in Patients who presented to the Outpatient Clinic for Breast Cancer-Related Lymphedema. J Breast Health. 2016;12(1):31-6. doi: 10.5152/tjbh.2015.2801. PubMed PMID: 28331728; PMCID: PMC5351432.
2. Brayton KM, Hirsch AT, PJ OB, Cheville A, Karaca-Mandic P, Rockson SG. Lymphedema prevalence and treatment benefits in cancer: impact of a therapeutic intervention on health outcomes and costs. PLoS One. 2014;9(12):e114597. doi: 10.1371/journal.pone.0114597. PubMed PMID: 25470383; PMCID: PMC4255037.
3. DiSipio T, Rye S, Newman B, Hayes S. Incidence of unilateral arm lymphoedema after breast cancer: a systematic review and meta-analysis. Lancet Oncol. 2013;14(6):500-15. Epub 2013/04/02. doi: 10.1016/S1470-2045(13)70076-7. PubMed PMID: 23540561.
4. Donahue PM, Crescenzi R, Scott AO, Braxton V, Desai A, Smith SA, Jordi J, Meszoely IM, Grau AM, Kauffmann RM, Sweeting RS, Spotanski K, Ridner SH, Donahue MJ. Bilateral Changes in Deep Tissue Environment After Manual Lymphatic Drainage in Patients with Breast Cancer Treatment-Related Lymphedema. Lymphat Res Biol. 2017;15(1):45-56. doi: 10.1089/lrb.2016.0020. PubMed PMID: 28323572; PMCID: PMC5369395.
5. Crescenzi R, Donahue PM, Braxton VG, Scott AO, Mahany HB, Lants SK, Donahue MJ.3.0 T relaxation time measurements of human lymph nodes in adults with and without lymphatic insufficiency: Implications for magnetic resonance lymphatic imaging. NMR Biomed. 2018 Oct 12:e4009. doi: 10.1002/nbm.4009.
6. Ridner SH, Bonner CM, Doersam JK, Rhoten BA, Schultze B, Dietrich MS. Bioelectrical impedance self-measurement protocol development and daily variation between healthy volunteers and breast cancer survivors with lymphedema. Lymphat Res Biol. 2014;12(1):2-9. doi: 10.1089/lrb.2013.0020. PubMed PMID: 24502422; PMCID: PMC3961792.
Figures