1630
MR Fingerprinting and Diffusion Mapping based Neural Network Classifier for significant prostate cancer characterization in Peripheral Zone and Transition Zone1BME, Case Western Reserve University, Cleveland, OH, United States, 2Radiology, Mayo Clinic, Rochester, MN, United States, 3Radiology, Case Western Reserve University, Cleveland, OH, United States, 4Department of Diagnostic, Interventional and Pediatric Radiology, Inselspital, Bern, Switzerland
Synopsis
This study demonstrates the utility of a neural network classifier in separating significant cancer from low-grade cancer and non-cancerous lesions, based on the quantitative MRF and diffusion mapping. Using targeted biopsy data for training, the neural network classifier outperforms the linear regression model in both peripheral zone (PZ) and transition zone (TZ). The differentiation results showed an AUC of 0.90 in PZ and AUC of 0.89 in the TZ, comparing to AUC of 0.86 and 0.81 using Logistic Regression respectively. After applying the adaptive data oversampling algorithm, the AUC in characterizing TZ lesions can reach 0.96. Further classification utilizing patient clinical information showed statistically better accuracy in PZ while worse in TZ.
Introduction
Currently, men with prostate abnormalities undergo a systematic trans-rectal ultrasound guided (TRUS) biopsy, with no prospectively identified focus suspicious for cancer. MRI is rapidly emerging as a strategy to identify cancer suspicious foci prior to biopsy. However, there is a need to better differentiate foci with likelihood of significant cancer (Gleason Grade ≥ 7) from low-grade cancer (Gleason Grade 6) and benign lesions (prostatitis and others) which can be followed in active surveillance protocols. Here we explore a neural network classifier for differentiating clinically significant cancer from low-grade plus benign lesions in the peripheral zone (PZ) and transition zone (TZ) using the T1, T2 values from MR Fingerprinting and ADC values from a published protocol1, and with targeted biopsy verification of suspicious lesions.Methods
In this IRB approved retrospective analysis of prospectively collected data, we studied 101 PZ cancer suspicious regions and 63 TZ lesions in 138 patients who prospectively underwent MRF and clinical prostate MRI. Targeted biopsy was performed (cognitive targeting in 81 patients, in-gantry targeting in 57 patients). The biopsy results were divided into two histopathologic groups: Clinically significant Cancer (n = 72) and non-cancerous plus low-grade lesions (n = 92). Based on the clinical reads by a radiologist (17 years’ experience), another (8 years’ experience) blinded to final pathology diagnosis drew ROI on cancer suspicious regions on T1, T2, ADC maps and the means of {T1, T2, ADC} values are extracted.
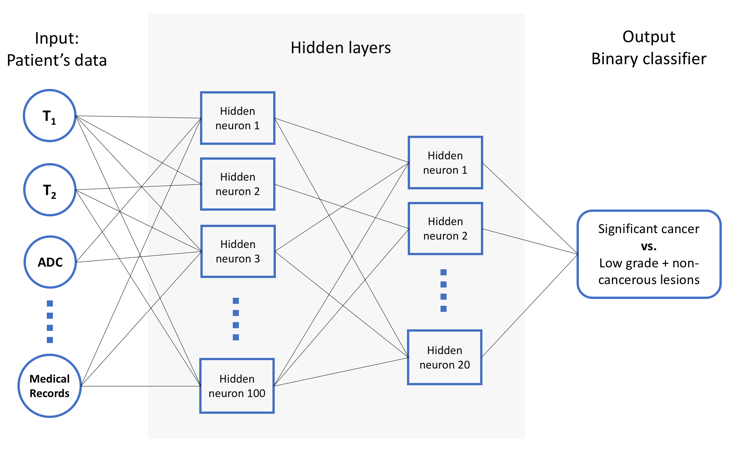
A four-layer feedforward neural network classifier3,4 was developed (Figure 1). Due to the two categories are not approximately equally represented in TZ (n = 18 vs 45), an oversampling technique called ADASYN5 has been applied to reduce the bias introduced by the class imbalance. To guarantee their generalizability, ten-fold cross validation was applied to avoid model overfitting.
The first inputs of the NN classifier are the T1, T2, ADC quantitative parameters, and then more clinical features were considered, including prostate-specific antigen (PSA) and Prostate Imaging Reporting and Data System (PIRADS) categorization, patient age, weight, height, smoking history, as inputs to the classification model. Lastly, we evaluated and compared the discriminative performances of interpreting radiologists with our NN classifier and previous logistic regression model with use of receiver operating characteristic (ROC) curves.
Results
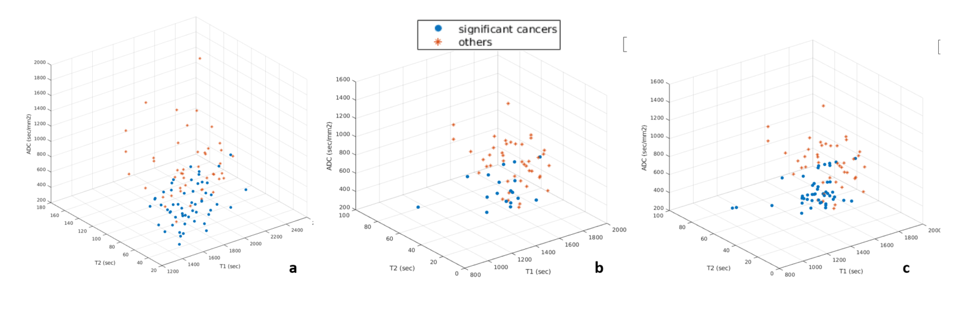
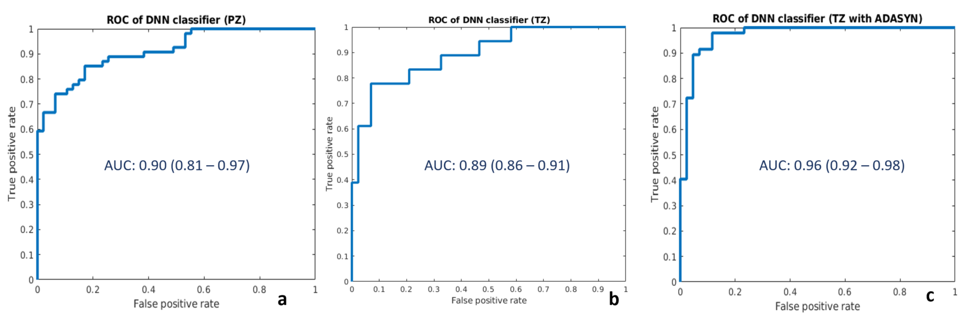
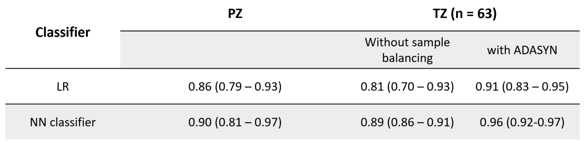
Quantitative parameters {T1, T2, ADC} in significant cancer vs. non-cancerous plus low-grade lesions was plotted in Figure 2. The spatial distribution of the two categories indicated they are separable. The purposed NN classifier applied to the inputs of {T1, T2, ADC} and the ROC-AUC were shown in Figure 3. The AUC of 0.90 (0.81 – 0.97) in PZ was statistically better than the logistic regression classifier 0.86 (0.79 – 0.93, p = 0.033). In TZ lesions, NN classifier had AUC 0.89 and 0.96 before and after ADASYN, which is a statistically significant improvement compare to logistic regression classifier (0.81 and 0.91 before/after ADASYN). The two classifiers’ performance is summarized in table 1.
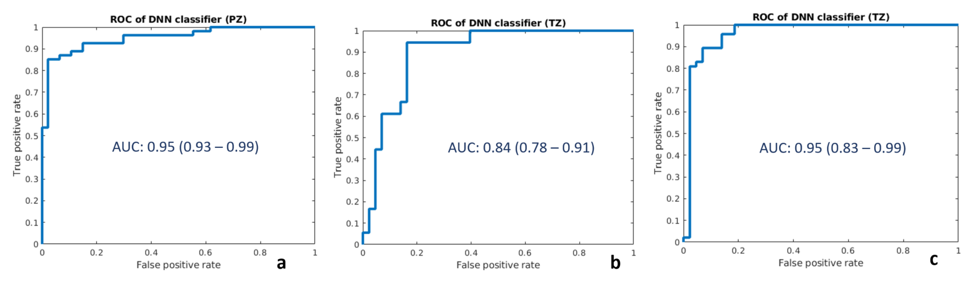
The proposed classification and validation methods also applied to the inputs with more features, The classification accuracy in PZ was improved, leading to the AUC of 0.95, while the TZ had AUC of 0.84 which is lower than the three quantitative parameters input. TZ with ADASYN shows similar results as 0.95 (0.92 – 0.98), the corresponding ROC-AUC plots are shown in Figure 4. The neural network weights analysis showed the PIRADS contributes more to the classifier than other features.
Conclusion and Discussion
This work demonstrates preliminary utility of a NN classifier in separating significant cancer from low-grade plus non-cancerous lesions, based on a quantitative MRF protocol. These results are promising as they may be useful in improving imaging classification of patients into groups that can be safely followed in surveillance protocols, and those that may need more aggressive management. In general, the NN classifier had better performance than logistic regression in both PZ and TZ. Compared to logistic regression, neural network models are more flexible, but more susceptible to overfitting. Thus, cross validation was performed to ensure the model generalizability. The TZ dataset was imbalanced because the two classification categories are not approximately equally represented (18 vs 45), which will cause potential high false negative rate (9). After applying adaptive data oversampling algorithm ADASYN, the AUC in TZ improved from 0.89 to 0.96. Finally, more features were added for the classification decision, statistical improvement was seen from AUC of 0.90 to 0.95 in PZ, while in TZ, the classification is worse (AUC of 0.84) compare to the results using quantitative parameters alone (AUC of 0.89). This might be because adding more features would also introducing more noise to the classification model. The chief limitation of this study is the small sample size, limiting robust multivariate analysis.Acknowledgements
Research Support: NIH grants 1R01EB016728, 1R01DK098503, 1R01CA208236 and Siemens HealthineersReferences
1. Yu, et al. Radiology. 2017;283(3):729-738. doi:10.1148/radiol.2017161599
2. Ananya, et al, ISMRM, 3415, 2017
3. Hepner, et al. Photogrammetric Engineering and Remote Sensing 56.4 (1990): 469-473.
4. Gletsos, et al. IEEE transactions on information technology in biomedicine 7.3 (2003): 153-162.
5. He, et al. IEEE International Joint Conference on. IEEE, 2008.
6. Chawla, et al. Journal of artificial intelligence research16 (2002): 321-357.
Figures