1629
Radiomics based on Multiparametric MRI for Predicting Upgrading of Prostate Cancer from Biopsy to Radical Prostatectomy1Peking Union Medical College Hospital, Beijing, China, 2School of Life Science and Technology, Xidian University, Xi'an, China, 3Key Laboratory of Molecular Imaging, Institute of Automation, Chinese Academy of Sciences, Beijing, China
Synopsis
The disparity of biopsy Gleason score of prostate cancer (PCa) with that of the corresponding radical prostatectomy (RP) remains an unsolved problem. We developed and validated radiomics model based on T2-weighted, fat-suppressed T2W, apparent diffusion coefficient and dynamic contrast enhancement images to predict upgrading from biopsy to RP. The radiomics model achieved the area under the curve values of 0.977 and 0.931 for the training and validation cohorts, and outperformed the clinical model combining clinical stage and time from biopsy to RP. The radiomics model could serve as a non-invasive tool for individualized prediction of upgrading of PCa.
Introduction
Prostate cancer (PCa) is the second most common malignancy and a primary cause of cancer-related death in males worldwide 1. Histopathologic evaluation at biopsy is crucial for prostate cancer (PCa) management, but the disparity of biopsy Gleason score (bGS) with that of the corresponding radical prostatectomy (RP) remains an unsolved problem2. Radiomics has gradually become a research focus in the past few years, to the best of our knowledge, no published literature has investigated whether a radiomics approach based on multiparametric magnetic resonance imaging (mp-MRI) could improve prediction of GS upgrading from biopsy to RP. Therefore, this study aims to develop and validate a radiomics model based on mp-MRI for predicting PCa upgrading in GS from biopsy to RP.Methods
We enrolled 166 RP-confirmed PCa patients (training cohort, n=116; validation cohort, n=50) with preoperative prostate mp-MRI performed on a 3T MR system with a pelvic phased-array surface coil. Transverse T2-weighted (T2W), fat-suppressed T2W (fs-T2W), ADC and selected dynamic contrast enhancement (DCE) images were reviewed to identify each tumor on mp-MRI through side-by-side comparison with RP specimens. Three-dimensional segmentation was performed manually by using ITK-SNAP software (open source software; www.itk-snap.org). Regions of interest (ROI) covering the whole tumor were delineated on each slice, and radiomic features were extracted from the four sequences (T2W, fs-T2W, ADC, DCE). Clinicopathologic factors including age, time from biopsy to RP, prostate specific antigen (PSA) and clinical stage (cT) were derived from medical records. Multivariate logistic regression analysis was used to develop predictive models and a radiomics nomogram. The performance of predictive models and nomogram was evaluated with respect to discrimination, calibration and clinical usefulness. Receiver operating characteristic (ROC) curve analysis was performed and AUCs were figured out for both training and validation cohorts.The statistical analysis was performed in R Version 3.4.4.Results
Among the 166 patients, 94 (56.6%) had upgrading from biopsy to RP with 66 patients (66/116, 56.9%) in the training cohort and 28 patients (28/50, 56.0%) in the validation cohort, respectively.The radiomics signature demonstrated favorable discrimination on T2W, fs-T2W, ADC and DCE images with AUC ranges of 0.800-0.857 in the training cohort and 0.730-0.786 in the validation cohort. These four signatures were used to construct the final radiomics model, which achieved better performance than any single sequence, with the AUCs for training and validation cohorts were 0.977 (95% CI: 0.956-0.998) and 0.931 (95% CI: 0.864-0.998). Two clinical variables, time from biopsy to RP and cT were selected to build the clinical model which produced an AUC of 0.677 (95% CI: 0.578-0.776) in the training cohort and an AUC of 0.646 (95% CI: 0.492-0.800) in the validation cohort. The Delong test showed that the radiomics model outperformed the clinical model (p < 0.001 both in training and validation cohorts). Fig. 1 and Table 1 shows the performance of the radiomics and clinical models. The AUCs of the nomogram (Fig. 2) was 0.977 (95% CI: 0.956-0.998) in the training cohort and 0.931 (95% CI: 0.864-0.998) in the validation cohort and the calibration curves (Fig. 3) demonstrated good agreementbetween the predictive and observation probabilities of upgrading.Decision curve analysis showed the radiomics nomogram was clinically useful with a threshold probability >7.0% (Fig. 4).Discussion
In this study, we focused on predicting GS upgrading, we selected the most significant predictive radiomic features extracted from prostate mp-MRI and developed radiomics models for individualized prediction of GS upgrading of PCa from biopsy to RP, which demonstrated favorable discrimination and calibration. The radiomics model incorporating the four sequences of T2W, fs-T2W, ADC and DCE showed better performance than any single sequence and outperformed the clinical model. We could infer that currently available standard clinical parameters are insufficiently predictive. The radiomics nomogram successfully stratified patients with PCa according to their risk of GS upgrading and may facilitate individualized treatment decision making for patients with PCa.Conclusion
Our study presents a mp-MRI-based radiomics approach to accurately predict upgrading in GS, and it has the potential to be applied as a non-invasive tool in clinical practice to assist in individualized treatment decision making for patients with PCa.Acknowledgements
The authors would like to acknowledge the instrumental and technical support of Multi-modal biomedical imaging experimental platform, Institute of Automation, Chinese Academy of Sciences.References
1. Bray F, Ferlay J, Soerjomataram I, et al. Global cancer statistics 2018: GLOBOCAN estimates of incidence and mortality worldwide for 36 cancers in 185 countries. CA Cancer J Clin 2018; doi: 10.3322/caac.21492.2.
2. Djavan B, Kadesky K, Klopukh B, et al. Gleason scores from prostate biopsies obtained with 18-gauge biopsy needles poorly predict Gleason scores of radical prostatectomy specimens. Eur Urol 1998; 33(3):261–270.
Figures
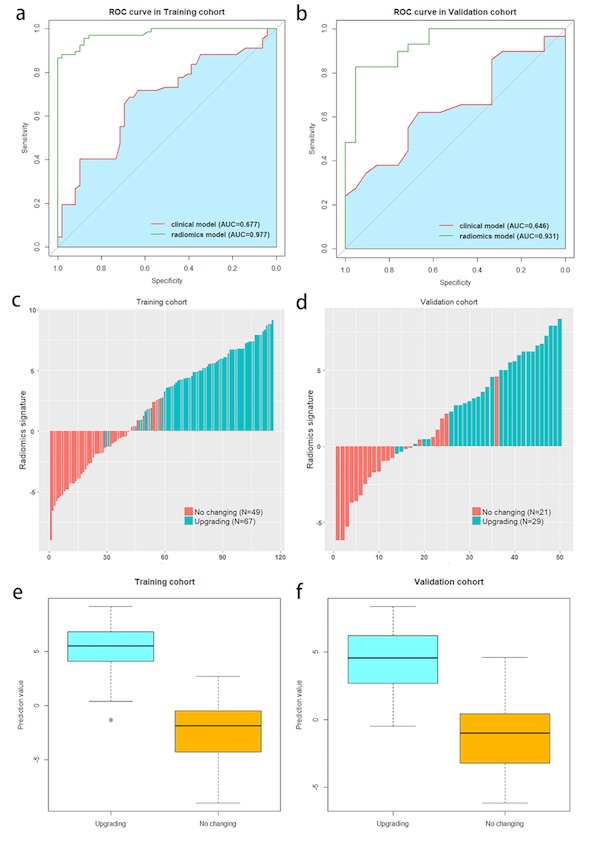


Table 1. Predictive performance of different models. Note: AUCs are mean (95%CI). AUC=are under the curve, ACC=accuracy, SEN=sensitivity, SPE=specificity.