1627
Heterogeneous alternation of fat content of varied adipose deposits in prostate cancer patients1The Department of Radiology, The First Affiliated Hospital of Wenzhou Medical University, Wenzhou, China
Synopsis
Prostate cancer (PCa) is characterized with dysregulated lipid metabolism. The function and fat content of adipose deposits varied with anatomical location. In our study, we explored the characteristic alternation of fat content of adipose tissues and muscle of pelvic region in prostate cancer (PCa) patients using mDixon.
Introduction
Prostate cancer (PCa), one of the most common malignant tumors in men1, is prominently characterized with dysregulated lipid metabolism2. Aberrant lipid metabolism of PCa plays an important role in the survival of cancer cells under adverse environmental conditions3. The function of adipose tissue is heterogeneous and varies with anatomical location. Yet, no consensus has been achieved regarding the correlation between fat distribution and the risk of PCa due to, in part, the selection of different techniques. Our study applied mDixon technique, which could achieve improved accuracy of fat quantification4, to study the relationship between fat content of varied adipose deposits/muscle and PCa.
Materials and methods
Study population
From April 2017 to April 2018, 109 patients, who underwent multiparametric MRI (mpMRI) and subsequently received systematic ultrasound guided biopsy, were reviewed. Twenty-one patients were further excluded for previous treatment for PCa, suboptimal imaging and the mpMRI-biopsy interval longer than 6 months. Two radiologists reviewed the MR images according to the guideline of PI-RADS version 2 and assigned score for the index suspicious lesion in consensus5. The index suspicious lesion is defined as the lesion with highest PI-RADS v2 score. The largest lesion was selected if two or more lesions showed equally highest score. Given lesion with PI-RASD v2 score 2 rarely presented PCa6, patients were assigned into two groups basing on the PI-RADS v2 score and histological findings: (I) PCa: patients who were confirmed with PCa by biopsy, n=32; (II) BPH: patients with PI-RADS v2 score of index suspicious lesion≤2 and negative biopsy findings, n=25.
MRI acquisition
MR examinations were carried out at 3.0-T MR scanner (Achieva; Philips Healthcare, Best, the Netherlands) equipped with standard abdominal phased-array coil without endorectal coil. The mpMRI protocol included: orthogonal T2-weighted imaging (T2WI); T1-weighted imaging (T1WI), diffusion-weighted imaging (DWI), mDixon and dynamic contrast-enhanced MRI (DCE-MRI) on the transversal plane. The mDixon was acquired with multiple echo spoiled gradient-echo sequence. The imaging parameters were as follows: TR=30ms, minTE=2.30ms, ∆TE=1.13ms, 6 echo times, flip angle=4°,FOV=352×264mm2,matrix=176×189, , slice thickness=5.0mm, No. of slices=16, NA=4,SENSE=2, scan time=3min2.8sec. Both amplitude and phase images were saved.
Post-processing of mDixon
All mDixon parametric mappings were constructed pixel-wisely using home-develop programming in Matlab (The MathWorks Inc., Natick, MA, USA)7.
Image analysis
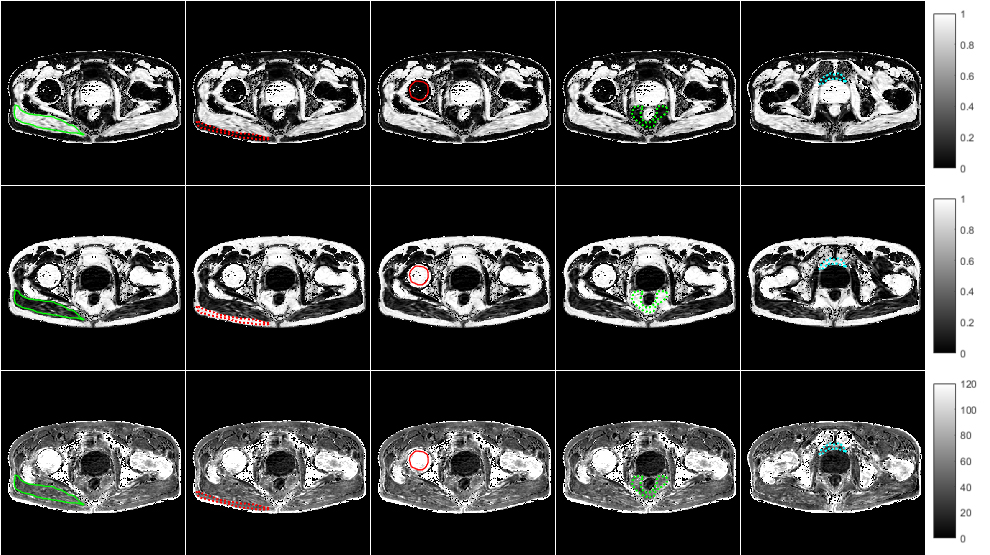
Representative mDixon parametric mappings are shown in Fig 1. Bilateral muscle (gluteus maximus), subcutaneous fat, bone marrow, visceral fat surrounding rectum, peri-prostate fat tissue (PPAT) were manually outlined in imageJ (NIH, USA).
Statistics
Data is presented as mean ± standard deviation (STD), unless noted. Analysis was done in Matlab (version R2017b; MathWorks, Natick, Mass), SPSS (version 16.0; IBM, Armonk, NY 16.0) and MedCals (version 18.6; MedCalc Software) sequentially. Sample t-test and Mann-Whitney U test were applied for group comparison. Spearman’s rank correlation was performed to assess the parametric correlation. Receiver operation characters (ROC) analysis was used to evaluate the differential ability. P<0.05 was considered significant.
Results
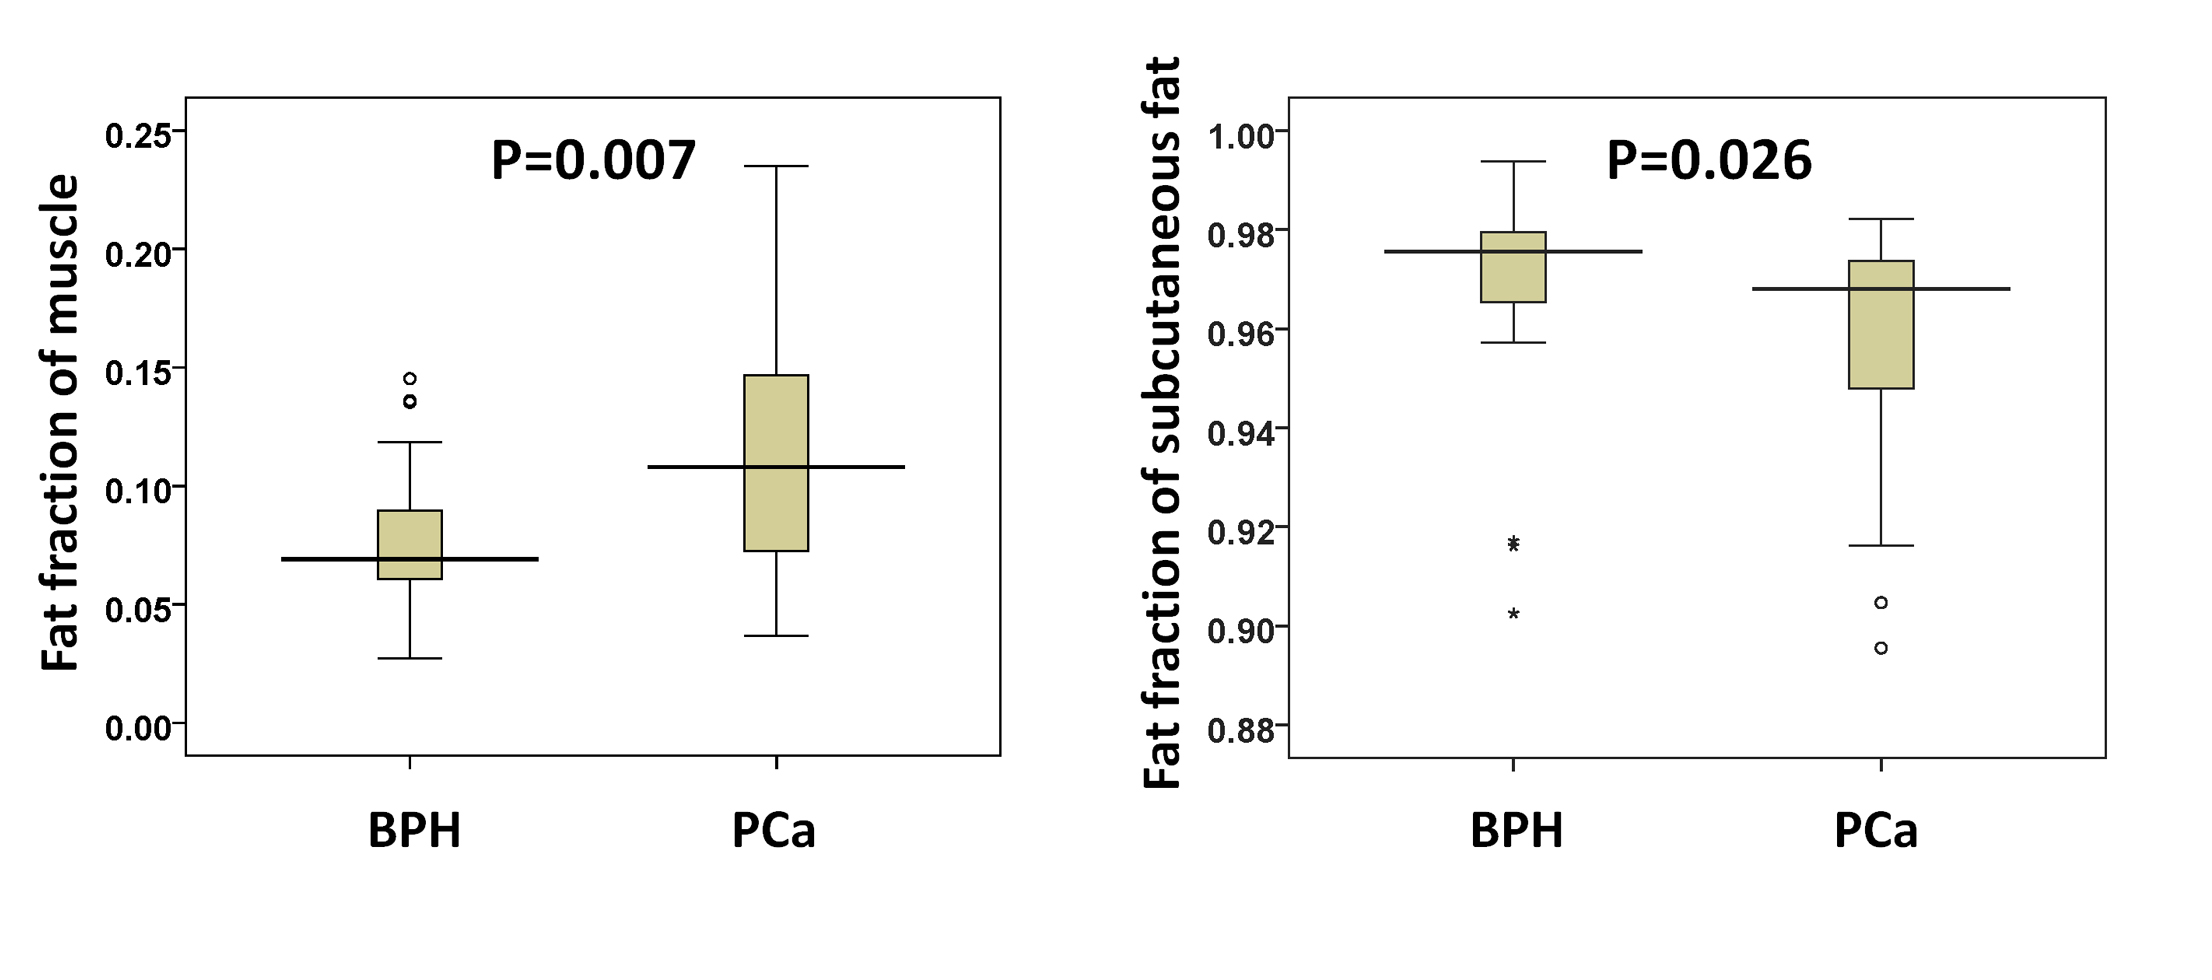
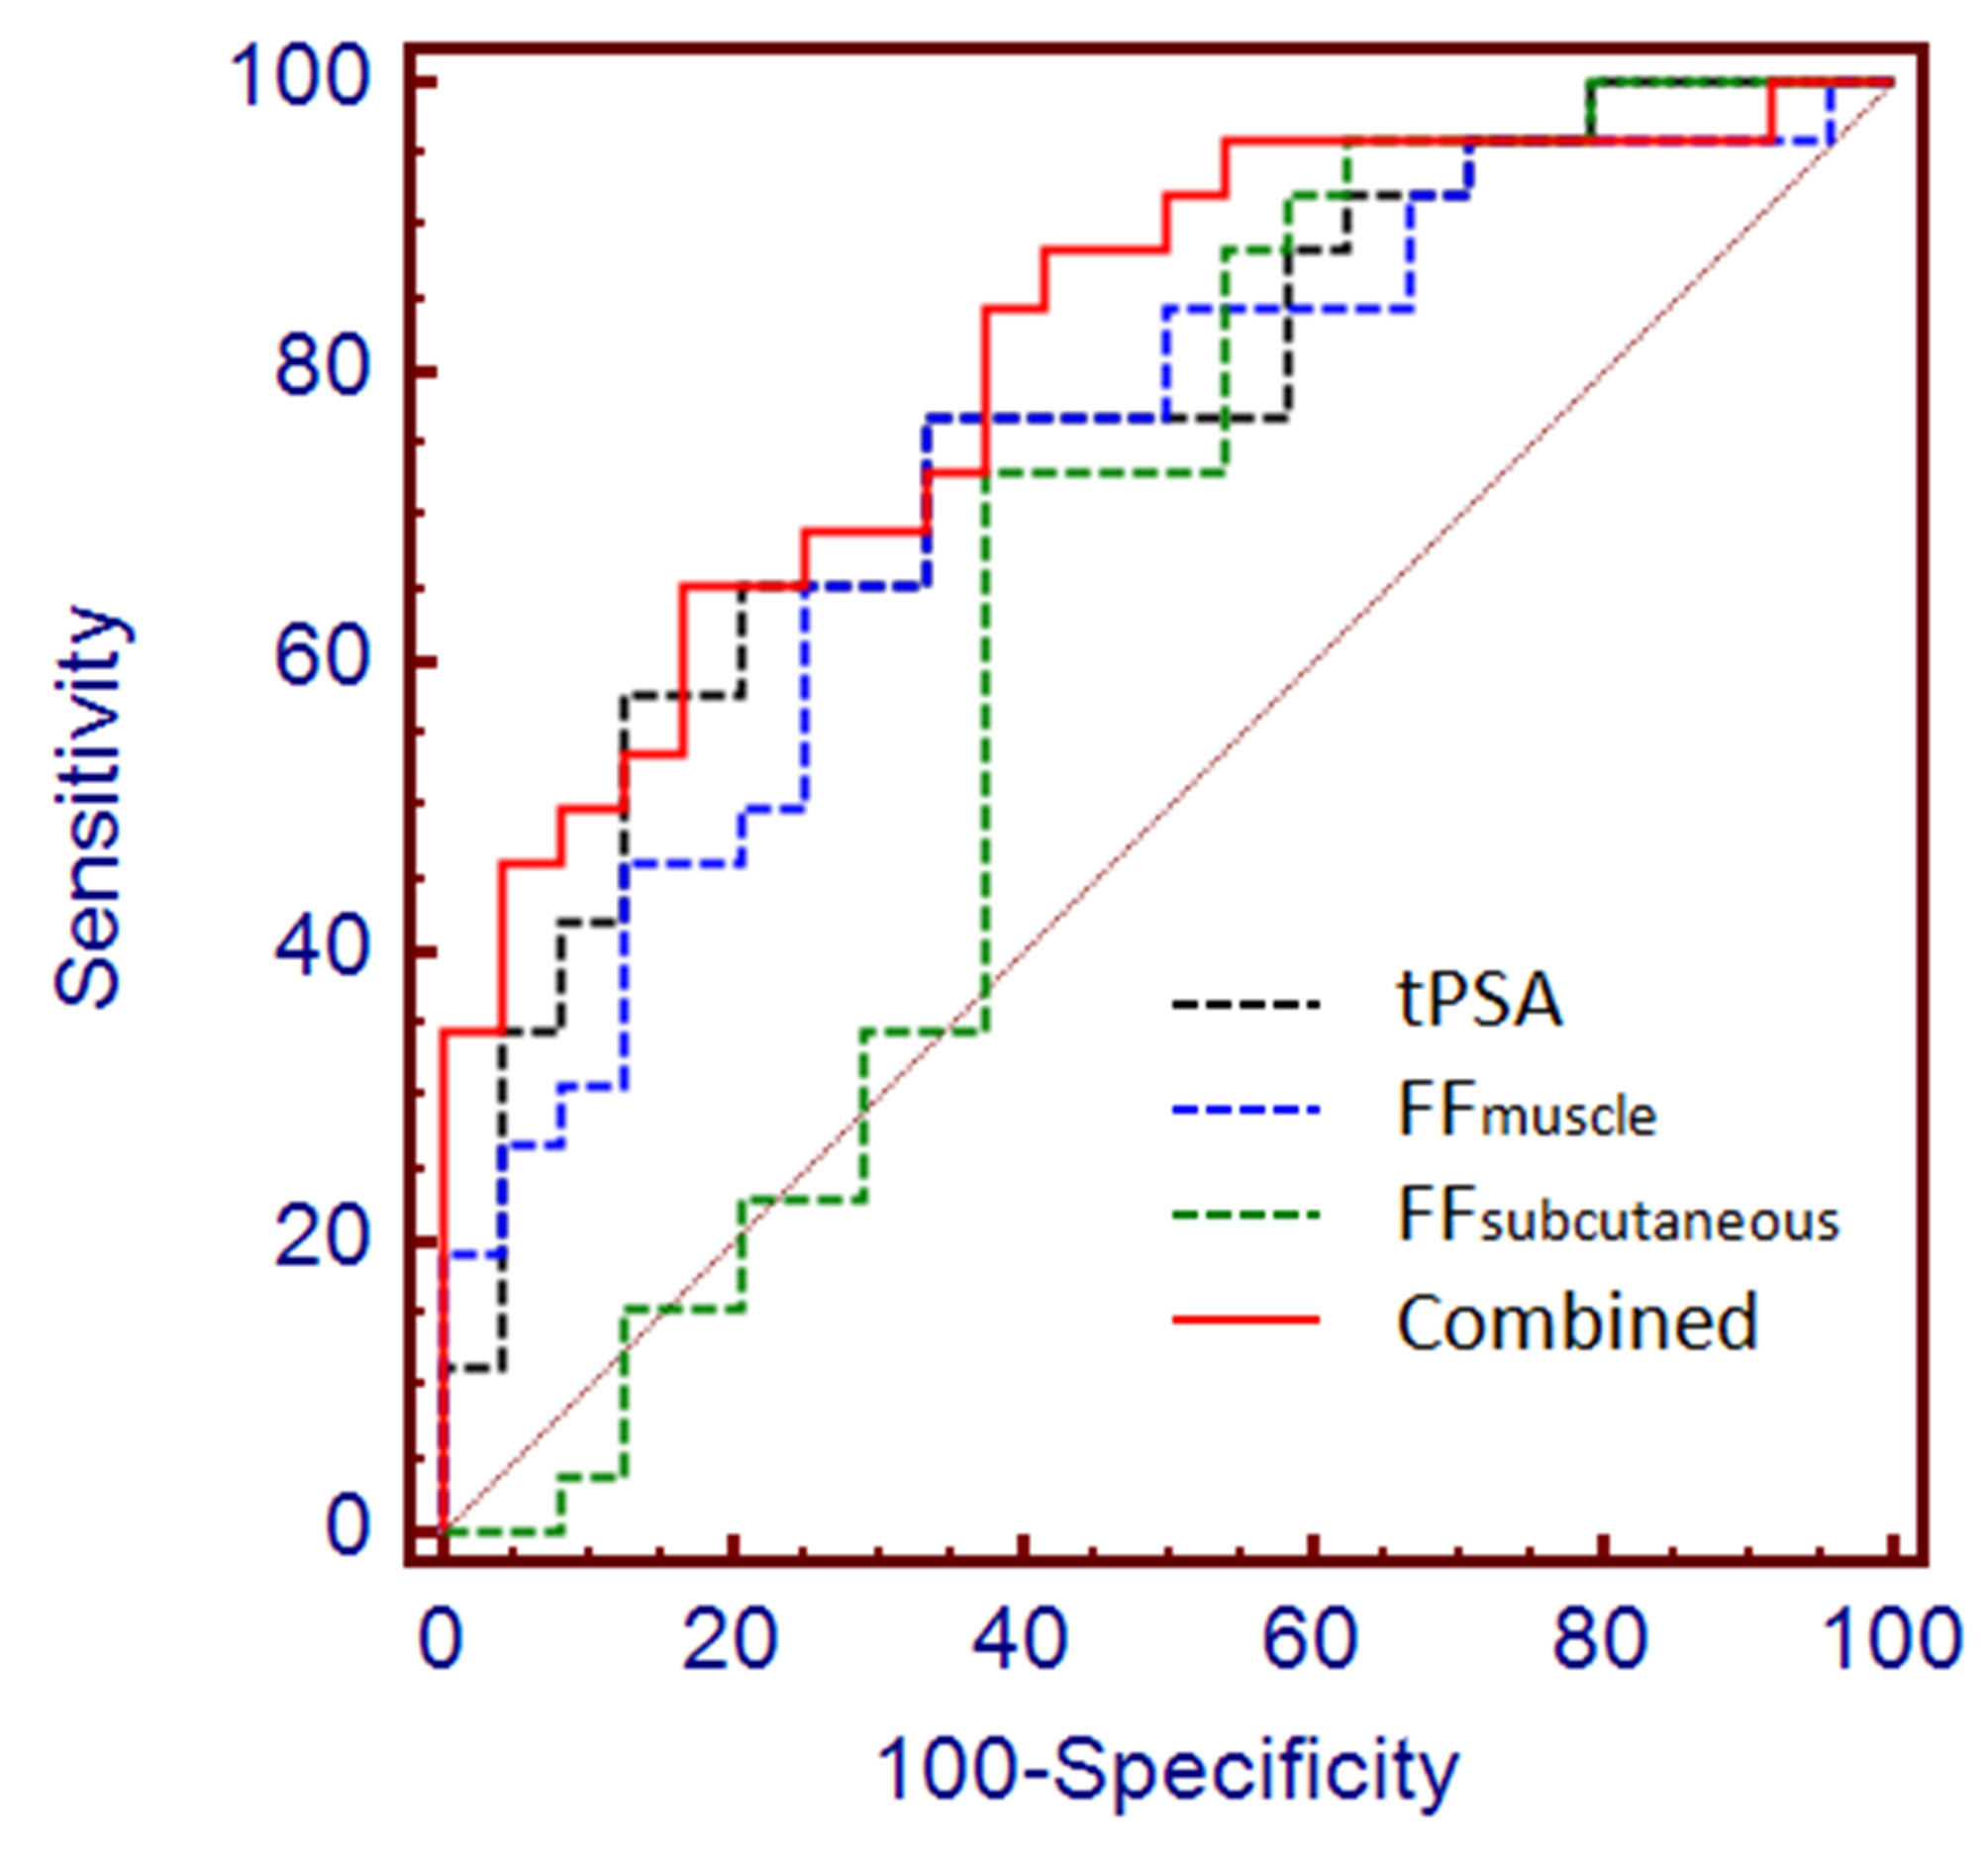
No significant difference in BMI was found between PCa and BPH groups (p=0.252). As shown in Fig 2, fat fraction of muscle increased in PCa group compared to BPH group (PCa: 0.11±0.05, BHP: 0.08±0.03, p=0.007), whereas fat fraction of subcutaneous adipose tissue declined slightly but significantly in PCa group (PCa: 0.96±0.02, BPH: 0.97±0.02, p=0.026). Significant association was found between T2* of bone marrow and tPSA/fPSA for pooled dataset. As shown in Fig 3, increased AUC was obtained when combing PSA and mDixon derived parameters (AUCtPSA=0.761, AUCcombined=0.811), yet the difference was insignificant.
Discussion
There are two main findings from this work. Firstly, the fat contents of muscle and subcutaneous fat were significantly different between untreated PCa and BPH, which would indicate an altered lipid metabolism of these adipose depots in PCa. Increased fatty infiltration was reported in response to ADT treatment by several studies8-11, yet our results might suggest that the alternation of fat content in muscle after ADT might be partially contributed by the intrinsic altered fat metabolism of PCa. Secondly, T2* of bone marrow instead of the fat content was significantly correlated with tPSA, which is a good indicator of PCa, which might be explained the participation of iron deposition in the progress of PCa.
Conclusion
Fat content of both muscle and subcutaneous fat changed significantly in PCa patients compared to BPH. The mDixon might be a powerful tool to explore the dyslipid metabolism in PCa. Moreover, the mDixon could potentially advance the diagnosis of PCa.
Acknowledgements
Project supported by the National Natural Science Foundation of China (Grant No. 81401544) and Natural Science Foundation of Zhejiang Province of China (Grant No. LQ14H180006).References
1. Siegel RL, Miller KD, Jemal A. Cancer statistics, 2015. CA: a cancer journal for clinicians. 2015;65(1):5-29.
2. Poulose N, Amoroso F, Steele RE, Singh R, Ong CW, Mills IG. Genetics of lipid metabolism in prostate cancer. Nat Genet. 2018;50(2):169-171.
3. Deep G, Schlaepfer IR. Aberrant Lipid Metabolism Promotes Prostate Cancer: Role in Cell Survival under Hypoxia and Extracellular Vesicles Biogenesis. International journal of molecular sciences. 2016;17(7).
4. Henninger B, Zoller H, Kannengiesser S, Zhong X, Jaschke W, Kremser C. 3D Multiecho Dixon for the Evaluation of Hepatic Iron and Fat in a Clinical Setting. Journal of magnetic resonance imaging : JMRI. 2017.
5. Weinreb JC, Barentsz JO, Choyke PL, et al. PI-RADS Prostate Imaging - Reporting and Data System: 2015, Version 2. European urology. 2016;69(1):16-40.
6. Thai JN, Narayanan HA, George AK, et al. Validation of PI-RADS Version 2 in Transition Zone Lesions for the Detection of Prostate Cancer. Radiology. 2018:170425-170425.
7. Zhong X, Nickel MD, Kannengiesser SAR, Dale BM, Kiefer B, Bashir MR. Liver Fat Quantification Using a Multi-Step Adaptive Fitting Approach with Multi-Echo GRE Imaging. Magn Reson Med. 2014;72(5):1353-1365.
8. Chang D, Joseph DJ, Ebert MA, et al. Effect of androgen deprivation therapy on muscle attenuation in men with prostate cancer. Journal of medical imaging and radiation oncology. 2014;58(2):223-228.
9. Mitsuzuka K, Kyan A, Sato T, et al. Influence of 1 year of androgen deprivation therapy on lipid and glucose metabolism and fat accumulation in Japanese patients with prostate cancer. Prostate Cancer Prostatic Dis. 2016;19(1):57-62.
10. Mitsuzuka K, Arai Y. Metabolic changes in patients with prostate cancer during androgen deprivation therapy. International Journal of Urology. 2018;25(1):45-53.
11. Torimoto K, Samma S, Kagebayashi Y, et al. The Effects of Androgen Deprivation Therapy on Lipid Metabolism and Body Composition in Japanese Patients with Prostate Cancer. Japanese journal of clinical oncology. 2011;41(4):577-581.
Figures