1626
Association of peri-prostatic adipose tissue (PPAT) and prostate cancer (PCa)1The Department of Radiology, The First Affiliated Hospital of Wenzhou Medical University, Wenzhou, China, 2The Department of Urology, The First Affiliated Hospital of Wenzhou Medical University, Wenzhou, China
Synopsis
The association between peri-prostatic adipose tissue (PPAT) and prostate volume (PV) was controversial in literatures. In our study, we adapted more reasonable definition of PPAT according to the observation during the surgery of radical prostatectomy (RP), and used histological finding from RP as reference, to explore the association between PPAT and PCa.
Introduction
Prostate cancer (PCa) is one of most common malignant tumors in man [1]. It’s noted that increased incidence of PCa is companied by the prevalence of obesity. Adipose tissue is associated with various tumor types through a direct impact on tumor or providing a microenvironment which influences cancer progression [2-4]. But the effect of adipose tissue on PCa is not fully explored. The association between adipose tissue and PCa was inconsistent in literature [5]. Therefore, the aim of this study was to investigate the relationship between PPAT determined by using MRI and aggressiveness of PCa with radical prostatectomy (RP) as reference.
Materials and Methods
Patients
Our institutional review board approved this retrospective study and waived the requirement for informed consent. In total, 105 PCa patients, who underwent prostate MRI and subsequent RP in our hospital between March 2014 and March 2018, were included in this study. Histopathological finding from RP specimen was used as reference standard. Patients were classified into low-risk group (LR, Gleason score, GS≤6) and intermediate-to-high risk group (HR, GS≥7) according to histological report. Age, levels of serum PSA and total cholesterol (TC), high density lipoprotein cholesterol (HDL-C), low density lipoprotein cholesterol (LDL-C) and triglyceride (TG) were analyzed as well.
MRI acquisition
All patients underwent prostate MRI at one of these two 3.0T MR scanners (Achieva, Philips, Best, Netherlands; Signa Excite HD, GE, Milwaukee, WI) equipped with abdominal phased array coil without endorectal coil. T2-weighted imaging (T2WI) was acquired in three orthogonal directions. Axial T1-weighted imaging (T1WI) was acquired using Turbo spin-echo sequence without fat suppression with the following parameters: echo time/repetition time (TE/TR) = 7.29–10.00/420.00–720.00 msec, flip angle=90°, field of view (FOV) = 200-340 × 200-340 mm2, reconstruction matrix = 224–704 ×224–704, No. of slices=16-32, slice thickness = 3.0-5.0 mm, gap = 0–1.0 mm, number of averages = 0.5–4. Fasting prior to MR scan was required to suppress bowel peristalsis.
Volume measurement of PPAT and prostate
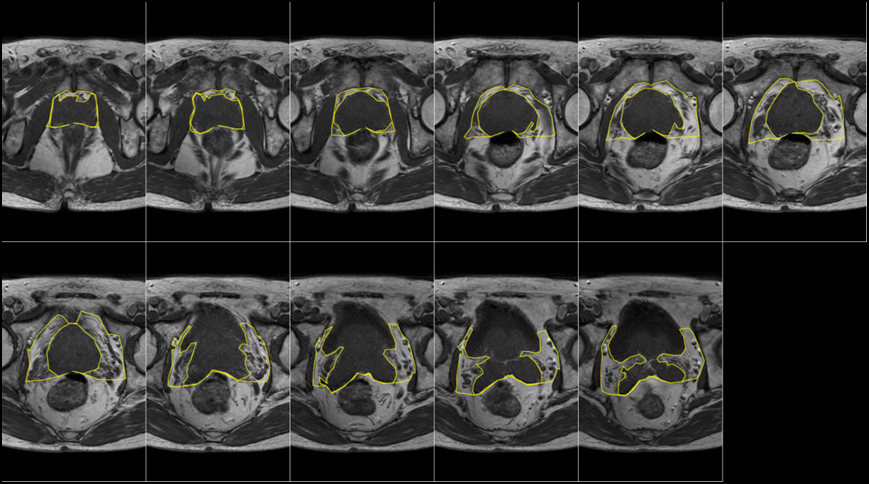
A radiologist (Zhao Zhang, with 6 years of experience), who was blind to the histological findings, reviewed the images and outlined the peri-prostatic adipose tissue (PPAT) and prostate volume (PV) manually in imageJ (NIH, USA). A representative T1WI was shown in Fig 1, with PPAT contoured from the first visible facial of obturator internus muscle laterally, by Denonvillier’s fascia posteriorly and symphysis pubis anteriorly[6]. The volumes of PPAT and PV were calculated by the number of outlined pixel and the volume of single voxel in matlab (Mathworks, Natick, MA). At the end, we normalised PPAT (NPPAT) in the way of PPAT divided by PV (NPPAT=PPAT/PV)[7].
Statistical analysis
Data are presented as mean±standard deviation (STD). Statistical analysis was performed in SPSS (IBM SPSS, version 23). For group comparison, Wilcoxon ranksum test was used for non-normally distributed continuous variables, while T-test was applied for normally distributed continuous variables. The Spearman’s Rank correlation was applied to evaluate the relationship between each variable, including PPAT, PV, NPPAT, tPSA, fPSA, f/tPSA, age, TG, TC, LDL-C and HDL-C. P < 0.05 was considered significant.
Results
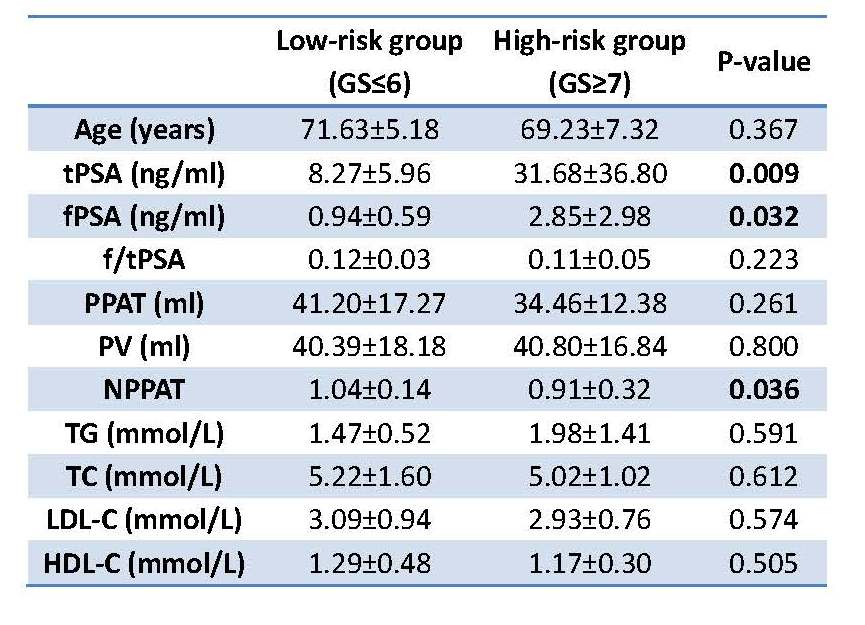
As shown in Fig 2, there was a significantly higher level of NPPAT in LR group compared with HR group (1.04 vs 0.87; p=0.036), whereas HR group had higher total prostate specific antigen (tPSA) and free prostate specific antigen (fPSA) levels than that in LR group (tPSA: 31.68 vs 8.27 ng/ml, p=0.009; fPSA: 2.85 vs 0.94 ng/ml, p=0.032). Moreover, NPPAT was significantly correlated with total cholesterol (TC) and low density lipoprotein cholesterol (LDL-C) (TC: ρho=0.211, p=0.031;LDL-C: ρho=0.204, p=0.037).
Discussion
PPAT is an active endocrine organ liking other adipose tissue, which can secrete growth factors, hormones, pro-inflammatory molecules or chemokine, and these substances are thought to be involved in the development of tumor [8]. Moreover, lipolysis and release of FFAs can sustain inflammation which is believed to be a cause of cancer[9]. PCa cell mainly use fatty acids through β-oxidation rather than glucose to provide energy[10]. To get enough energy, cancer cell can stimulate mobilization of lipids which are stored in the tumor microenvironment [11; 12]. This can result in decreased adipose tissue surrounding higher-grade tumor. This might explain the decreased NPPAT in HR PCa in our study. Besides, a positive association between the aggressiveness of PCa and high serum cholesterol is supported by epidemiologic data [13]. In our study, NPPAT is relevant to TC, which might suggest PPAT affect PCa by TC level.
Conclusion
Aggressiveness of PCa is significant associated with NPPAT, suggesting that a lower PPAT reflected an increased risk of aggressive PCa.
Acknowledgements
Project supported by the National Natural Science Foundation of China (Grant No. 81401544) and Natural Science Foundation of Zhejiang Province of China (Grant No. LQ14H180006).References
1. Venderbos LD, Roobol MJ. PSA-based prostate cancer screening: the role of active surveillance and informed and shared decision making. Asian journal of andrology. 2011;13(2):219-224.
2. Booth A, Magnuson A, Fouts J, Foster M. Adipose tissue, obesity and adipokines: role in cancer promotion. Hormone molecular biology and clinical investigation. 2015;21(1):57-74.
3. Renehan AG, Zwahlen M, Egger M. Adiposity and cancer risk: new mechanistic insights from epidemiology. Nat Rev Cancer. 2015;15(8):484-498.
4. Louie SM, Roberts LS, Nomura DK. Mechanisms linking obesity and cancer. Biochim Biophys Acta. 2013;1831(10):1499-1508.
5. Nassar ZD, Aref AT, Miladinovic D, et al. Peri-prostatic adipose tissue: the metabolic microenvironment of prostate cancer. BJU international. 2018;121:9-21.
6. Salji M, Hendry J, Patel A, Ahmad I, Nixon C, Leung HY. Peri-prostatic Fat Volume Measurement as a Predictive Tool for Castration Resistance in Advanced Prostate Cancer. European urology focus. 2017.
7. Dahran N, Szewczyk-Bieda M, Wei C, Vinnicombe S, Nabi G. Normalized periprostatic fat MRI measurements can predict prostate cancer aggressiveness in men undergoing radical prostatectomy for clinically localised disease. Sci Rep-Uk. 2017;7.
8. Laurent V, Guerard A, Mazerolles C, et al. Periprostatic adipocytes act as a driving force for prostate cancer progression in obesity. Nat Commun. 2016;7.
9. Iyengar NM, Gucalp A, Dannenberg AJ, Hudis CA. Obesity and Cancer Mechanisms: Tumor Microenvironment and Inflammation. J Clin Oncol. 2016;34(35):4270-4276.
10. Liu Y, Zuckier LS, Ghesani NV. Dominant uptake of fatty acid over glucose by prostate cells: a potential new diagnostic and therapeutic approach. Anticancer Res. 2010;30(2):369-374.
11. Kuemmerle NB, Rysman E, Lombardo PS, et al. Lipoprotein lipase links dietary fat to solid tumor cell proliferation. Mol Cancer Ther. 2011;10(3):427-436.
12. Zaidi N, Lupien L, Kuemmerle NB, Kinlaw WB, Swinnen JV, Smans K. Lipogenesis and lipolysis: the pathways exploited by the cancer cells to acquire fatty acids. Prog Lipid Res. 2013;52(4):585-589.
13. Platz EA, Till C, Goodman PJ, et al. Men with Low Serum Cholesterol Have a Lower Risk of High-Grade Prostate Cancer in the Placebo Arm of the Prostate Cancer Prevention Trial. Cancer Epidem Biomar. 2009;18(11):2807-2813.
Figures