1625
Use of kz-Space for Sub-mm Through-Plane Resolution in Multi-slice MRI: Application to Prostate1Biomedical Engineering and Physiology, Mayo Graduate School, Rochester, MN, United States, 2Radiology, Mayo Clinic, Rochester, MN, United States, 3Radiology, Mayo Clinic, Scottsdale, AZ, United States
Synopsis
The goal of this work is to demonstrate sub-mm through-plane resolution in multislice T2SE MRI using kZ-space processing of overlapping slices and to show applicability in prostate MRI. Multiple overlapped slices are acquired and Fourier transformed in the slice-select direction. The slice profile is taken into account in the reconstruction using Tikhonov regularization. Sub-mm resolution is possible from 3.2mm thick slices. The method is applied to 16 consecutive subjects for whom prostate MRI was indicated. The in vivo results from prostate MRI show improved sharpness in the axial reconstructions when compared to the standard axial multislice method.
Introduction:
Two-dimensional (2D) multi-slice T2-weighted spin-echo acquisition is a mainstay of clinical MRI but continues to be limited by spatial resolution along the slice select direction, typically 3-6× coarser than the inplane resolution and generally no finer than 2mm. To address limited through-plane resolution, there is a class of methods referred to as "super resolution" as reviewed by Van Reeth (1). These methods acquire multiple sets of data with limited resolution and estimate a high resolution image set from them (2,3). The goal of this work is to demonstrate sub-mm through-plane resolution using slices that have overlap (4) but use processing in kZ-space similar to that recently described in Ref.(5) as applied to 2D time-of-flight MR angiography.Methods:
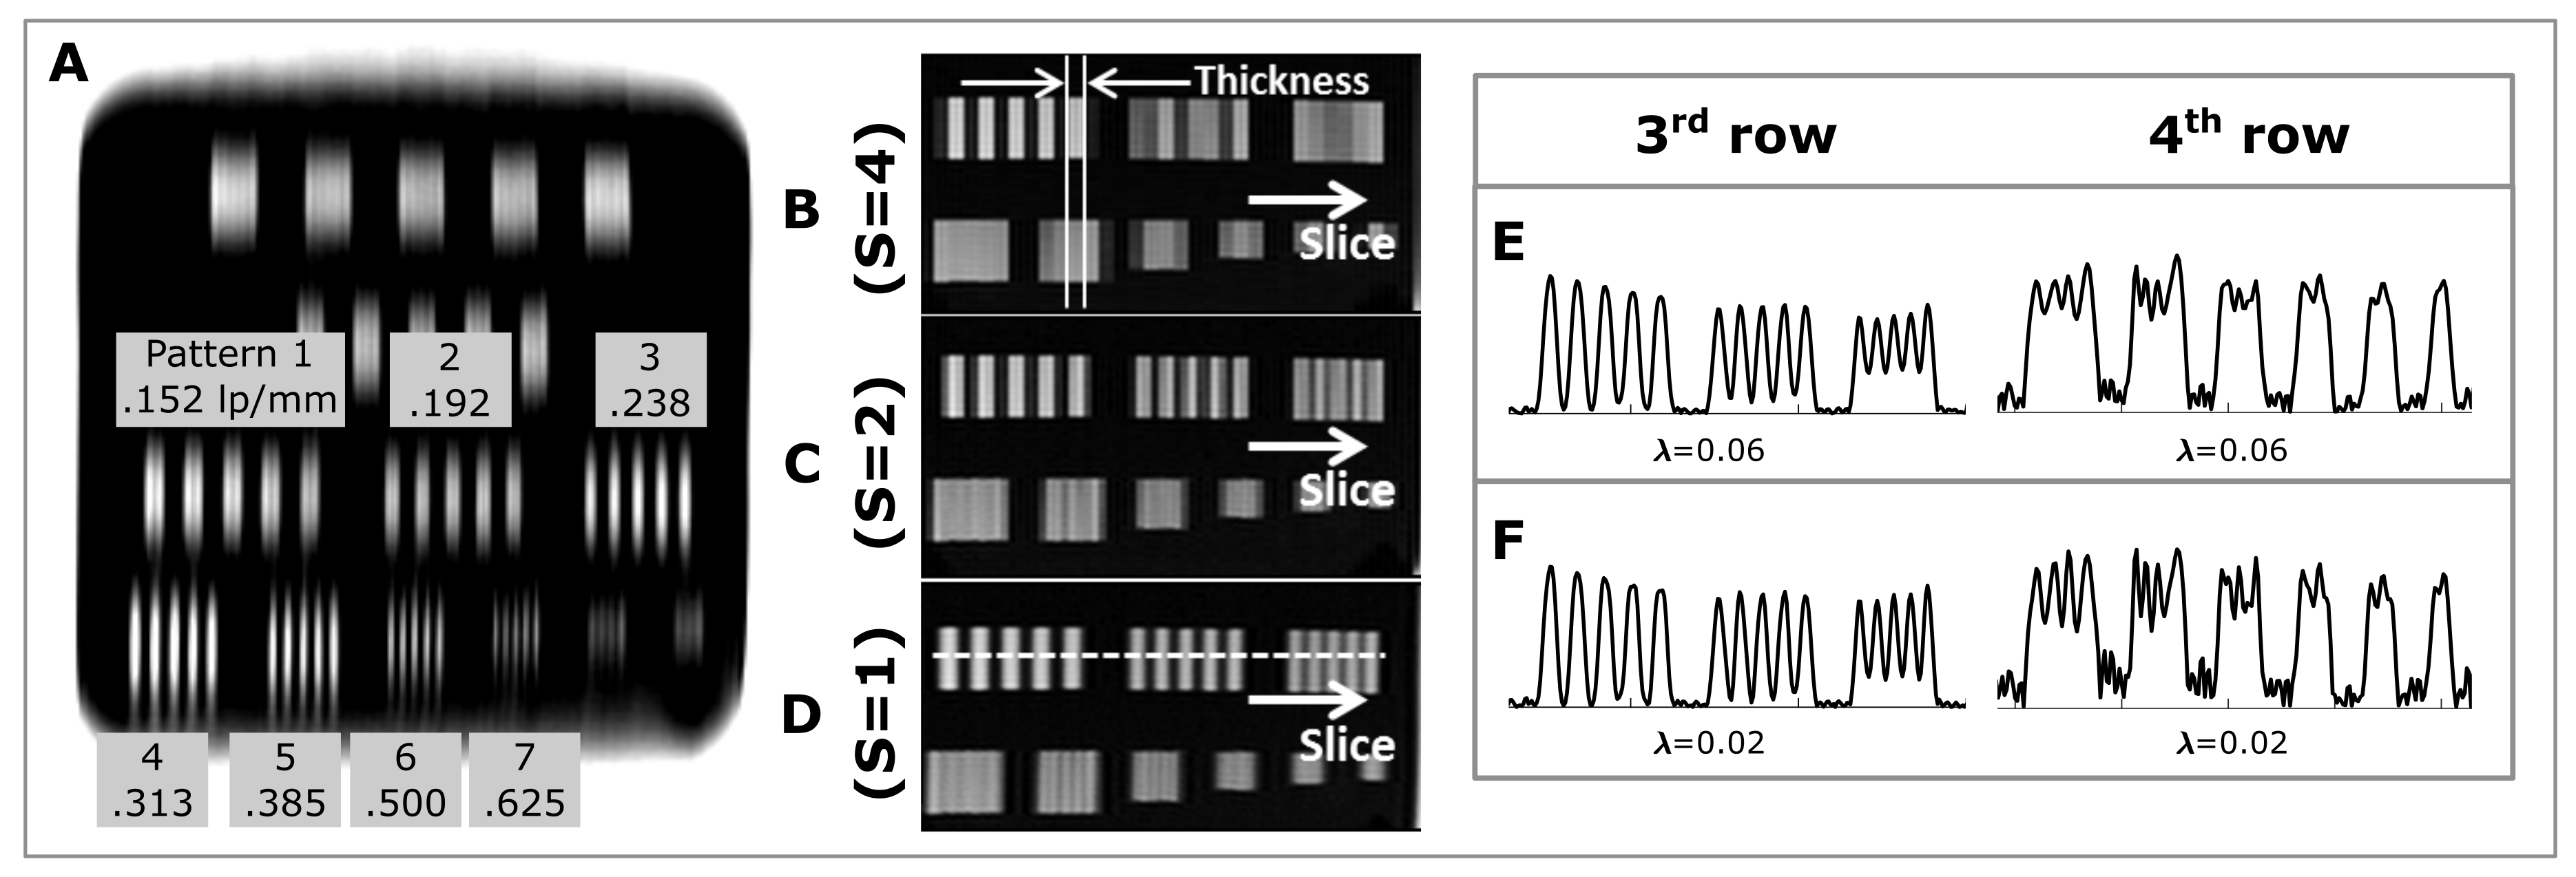
A resolution phantom was used to portray spatial frequencies in the through-slice direction. 256 slices were acquired using a T2SE multislice sequence in sagittal orientation (“L/R” slice select direction) using 3.2mm slice thickness and 0.8mm slice-to-slice increment. The slices were acquired in six passes of a multislice scan to avoid slice-to-slice interference. As a reference (Fig.1A), an axial image of the phantom was acquired with the frequency direction along the L/R direction (FOV=256mm with 320 readout points). The sagittal data was Fourier transformed along the slice direction and then reconstructed using the slice profile measured separately.
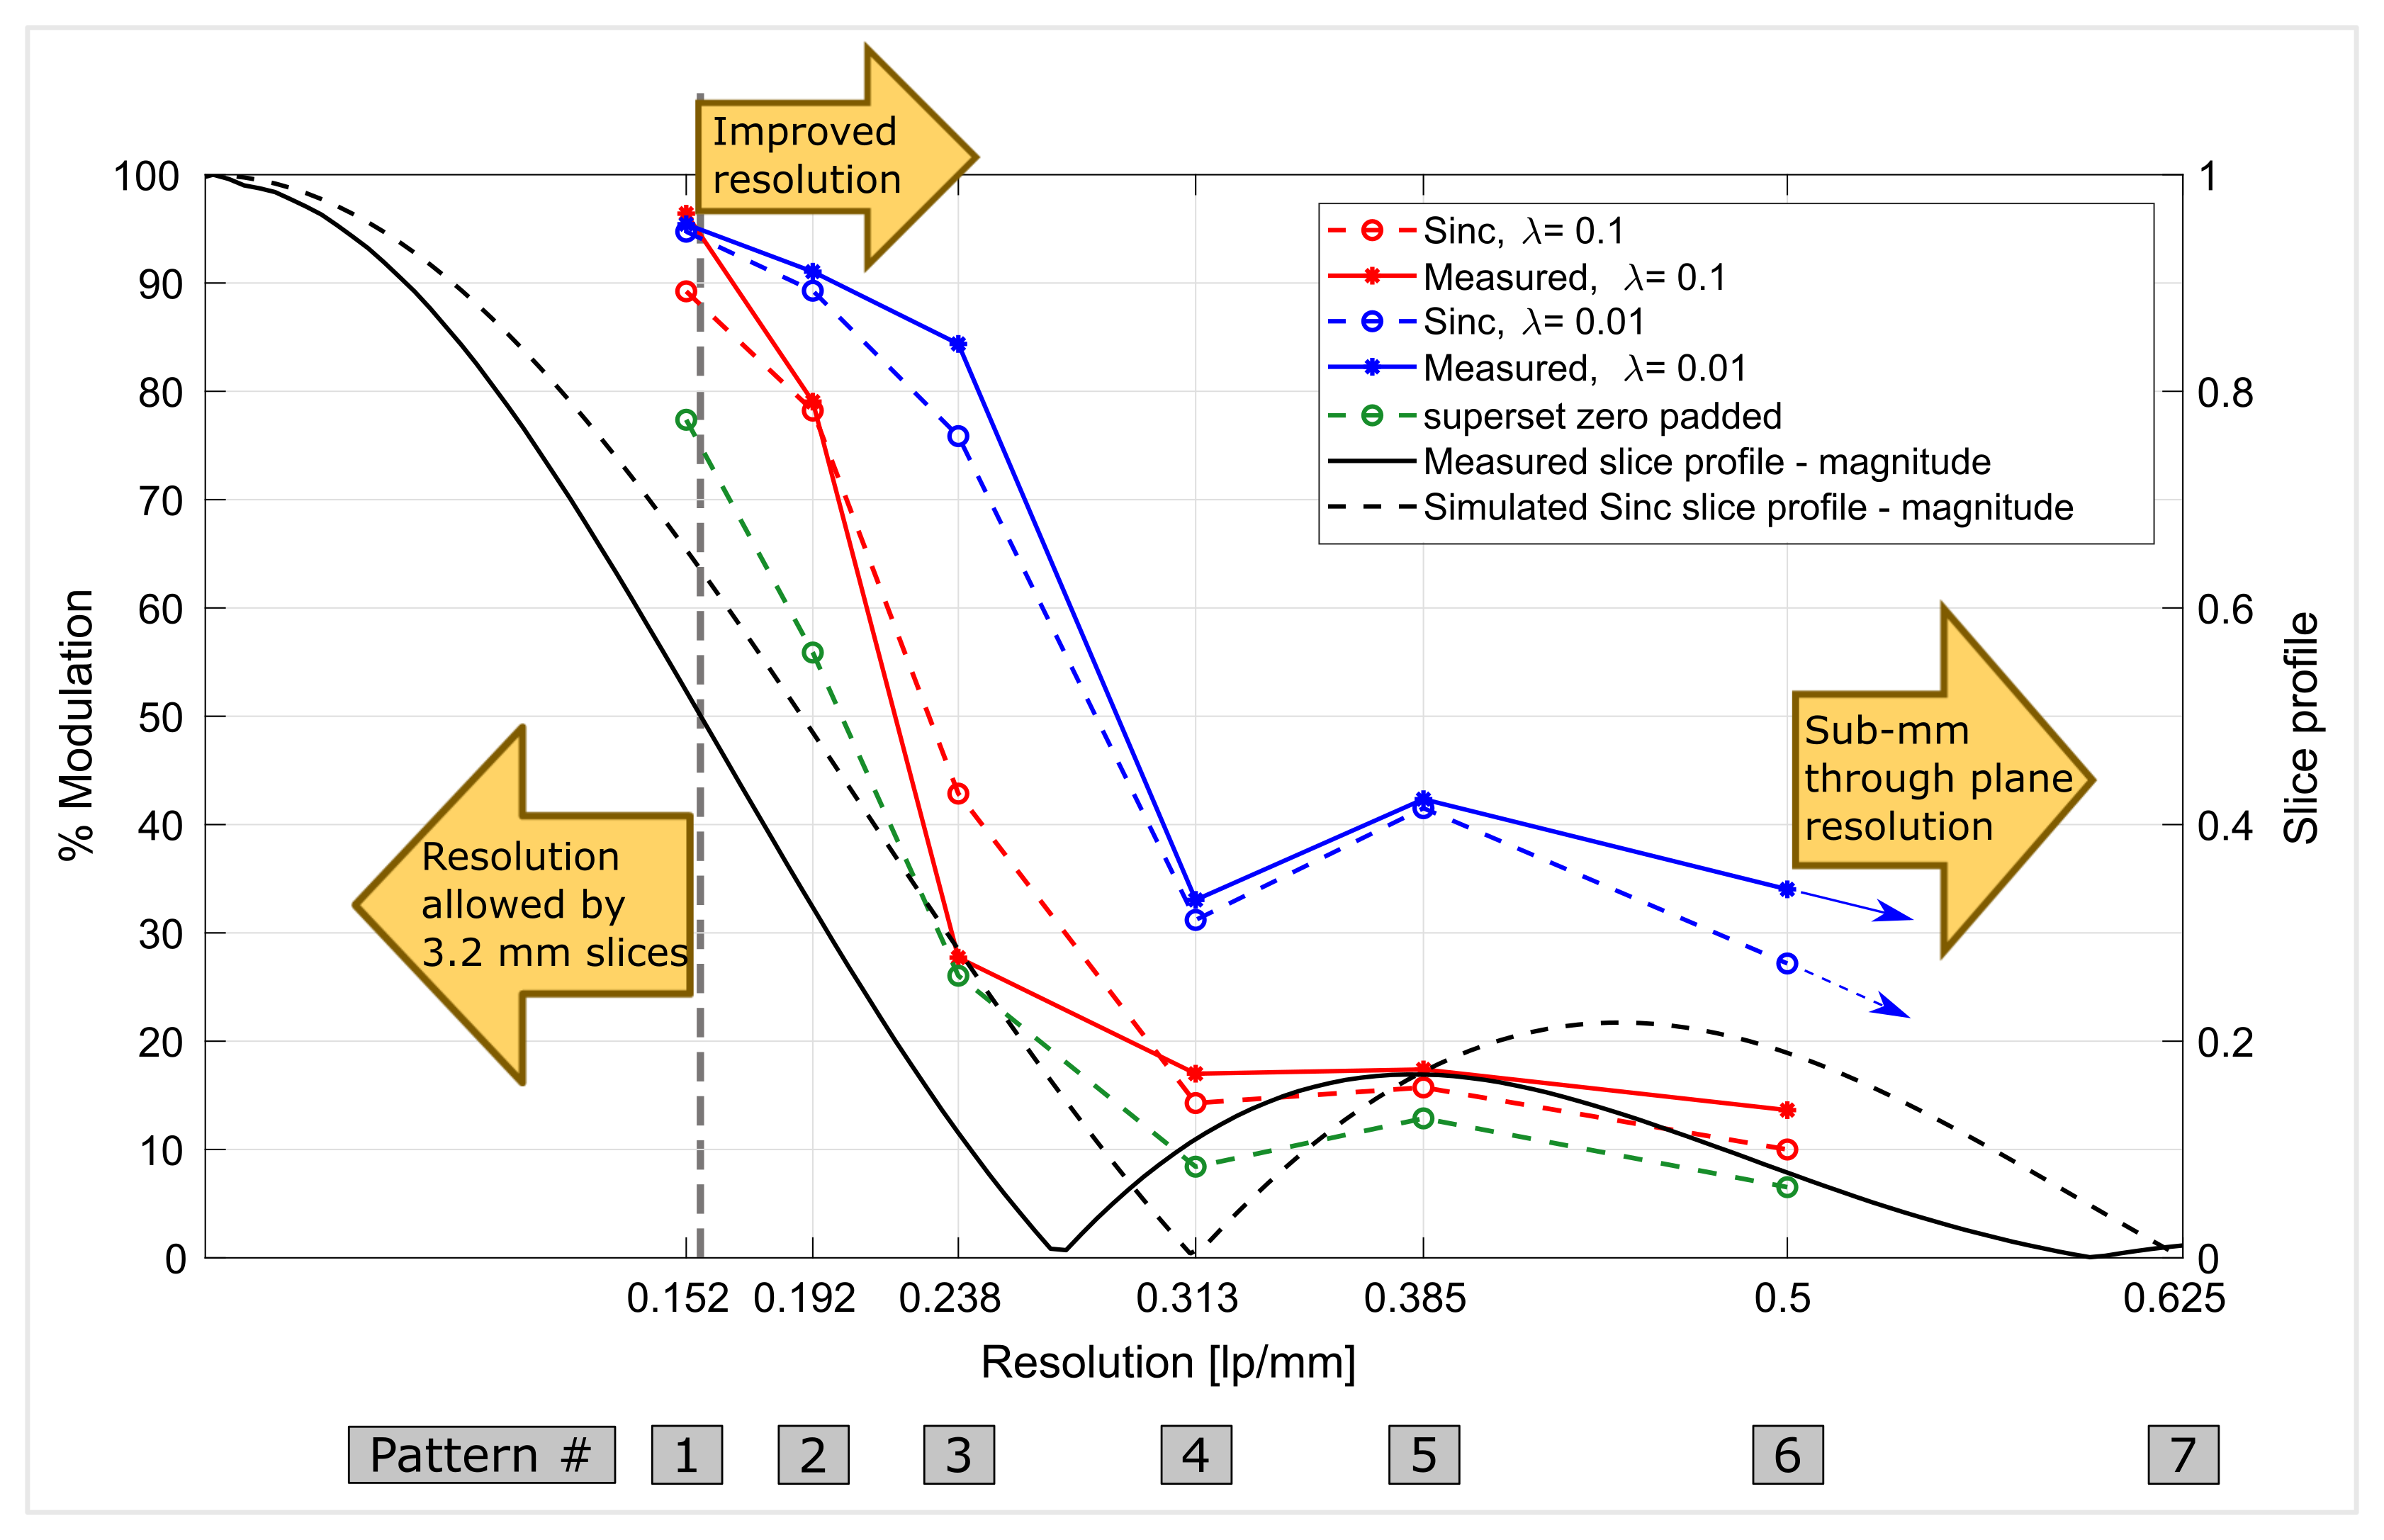
Resolution was assessed by measuring the percent modulation within the patterns of the axial images reconstructed from the sagittal data and plotted vs. spatial frequency (Fig.2) resulting in a modulation transfer function (6).
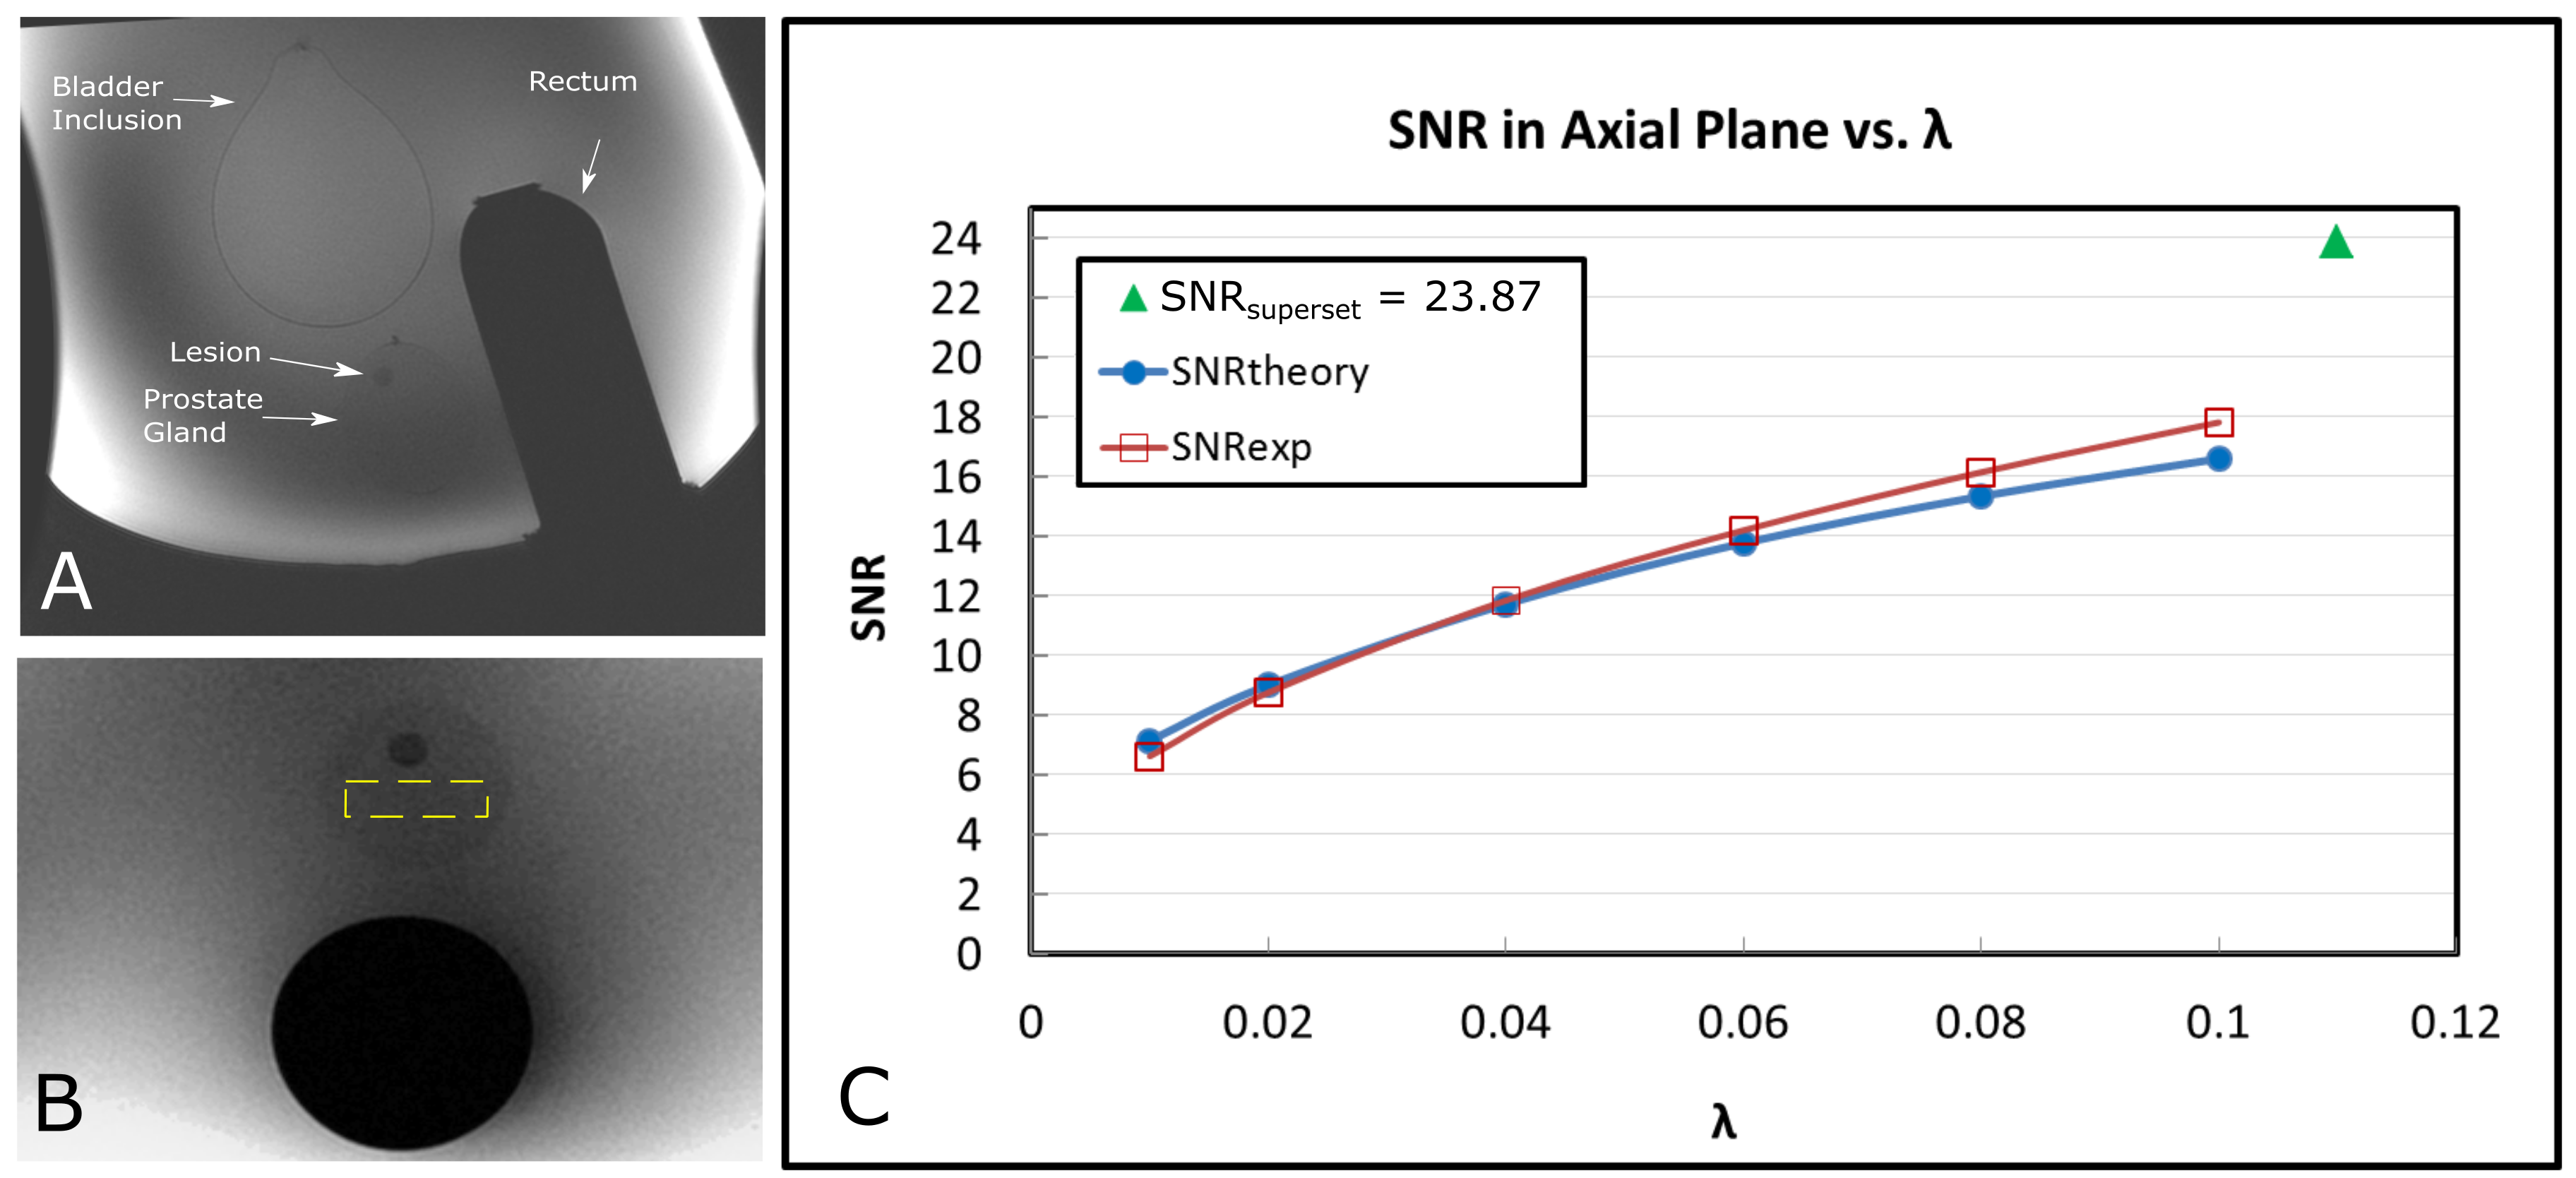
To assess SNR performance, a prostate phantom was imaged with a T2SE sequence in axial orientation using 112 slices, 3.2mm thick, and 0.8mm slice-to-slice increment with FOVz=89.6mm. SNR was measured in the acquired and reconstructed axial images using a 600mm2 rectangular ROI within the prostate inclusion. The mean signal was determined within the ROI of the magnitude image and the standard deviation, σ, was measured in the same ROI in a difference image made from axial partitions separated by 2mm.
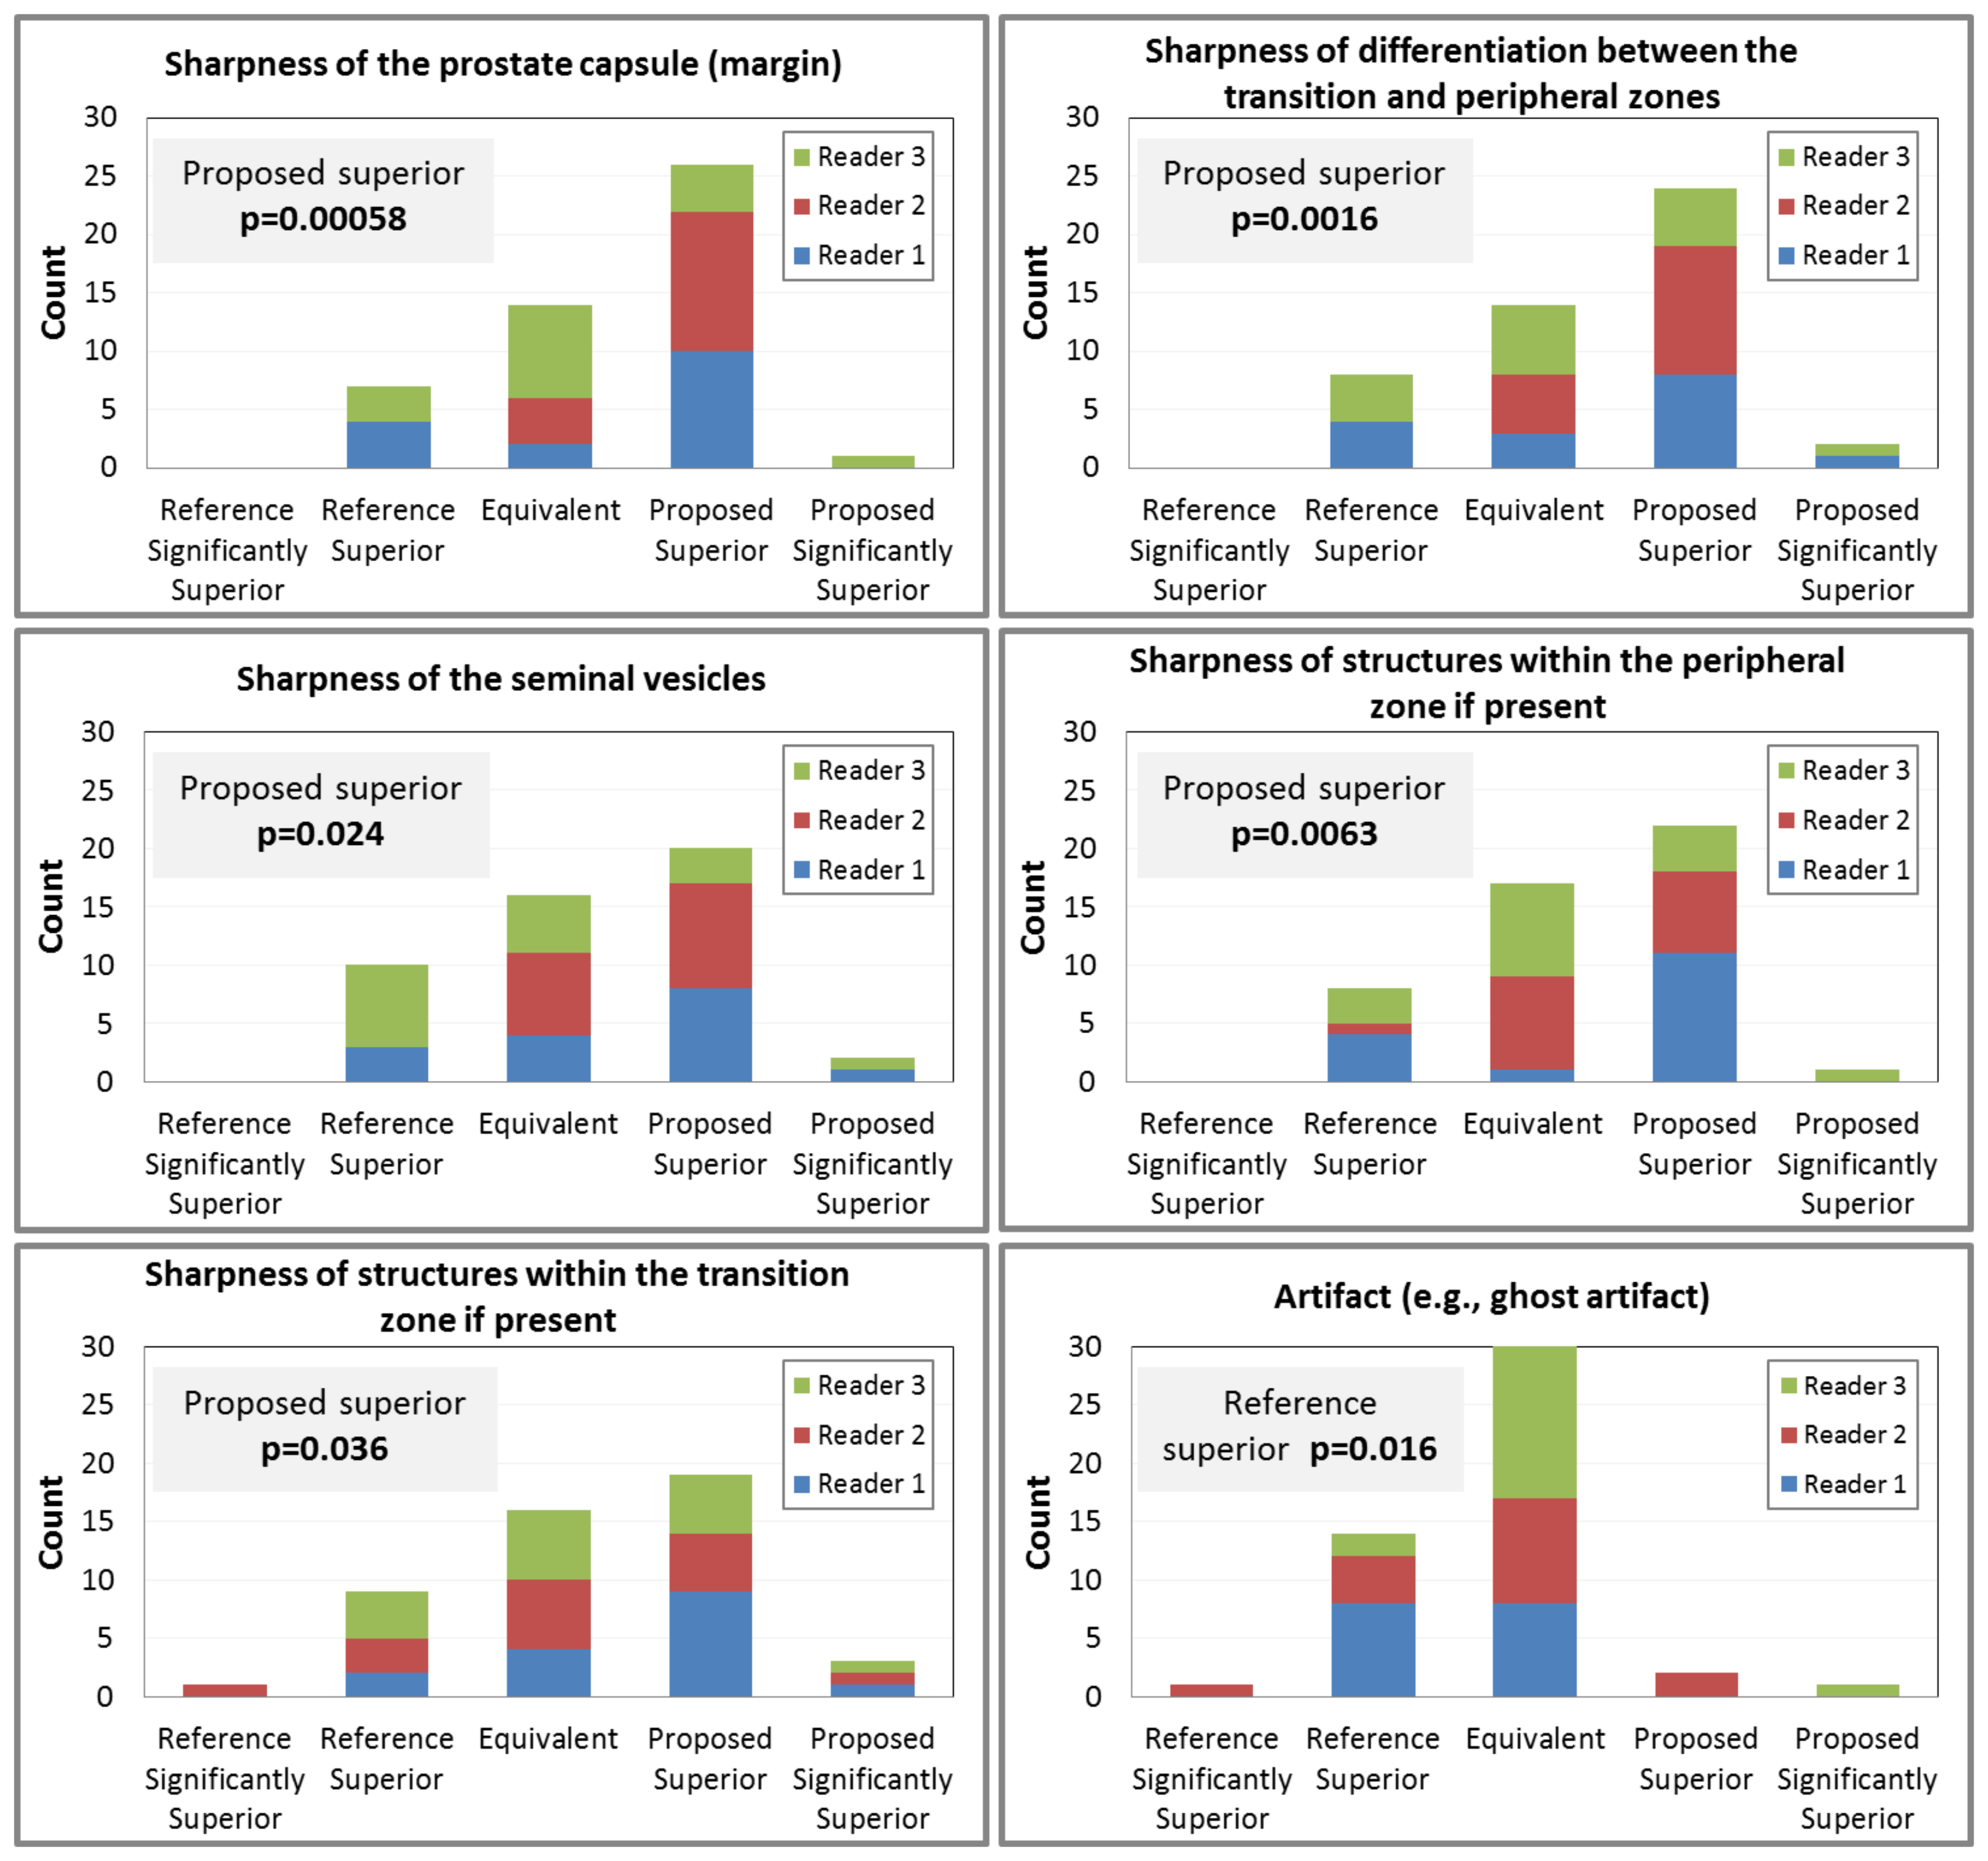
After obtaining an informed consent the proposed method was also evaluated in 16 subjects for whom prostate MRI was indicated. A reference (TR/TE 3000/100, 28 3.0mm thick slices, 4:14min scan time, 0.75×0.75×3.00mm3 resolution) and proposed (TR/TE 3000/100, 78 overlapped 3.0mm thick slices, 6:38min scan time, 0.75×0.75×1.00mm3 final resolution) axial scans were performed. Axial images from the two were compared blindly by three experienced uroradiologists using five prostate-specific evaluation criteria of sharpness and one for artifact.
Results:
The patterns contained in the third and fourth rows in the resolution phantom correspond to frequencies from 0.152 to 0.625 lp/mm (Fig.1A). Magnifications of those patterns reconstructed from the sagittal multislice images are shown in Fig.1B-D for abutting 3.2mm acquired slices (B) and slices with 1.6mm (C) and 0.8mm (D) slice-to-slice increment. All images are zero padded along the L/R direction to 0.8mm spacing. Fig.1E-F show plots of the modulation along the third (identified in D) and fourth rows of the phantom reconstructed using the 75% overlap data (S=1) for λ=0.06 (E) and λ=0.02 (G).
Fig.2 shows the modulation percentage plotted for Patterns 1-6. For λ=0.02 note that there is approximately 30% modulation at frequency 0.5 lp/mm, indicating sub-mm spatial resolution. The “valley” in the MTF in the vicinity of 0.313 lp/mm is due to the zero crossing of the kZ representations of the slice profile near this frequency.
Fig.3 shows results of SNR measurement with sagittal image of the phantom in (A) and ROI in the axial image in (B). Fig.3C is a plot of the SNR expected theoretically in the kZ-processed images vs. the regularization parameter λ compared with the values of SNR measured using the phantom images.
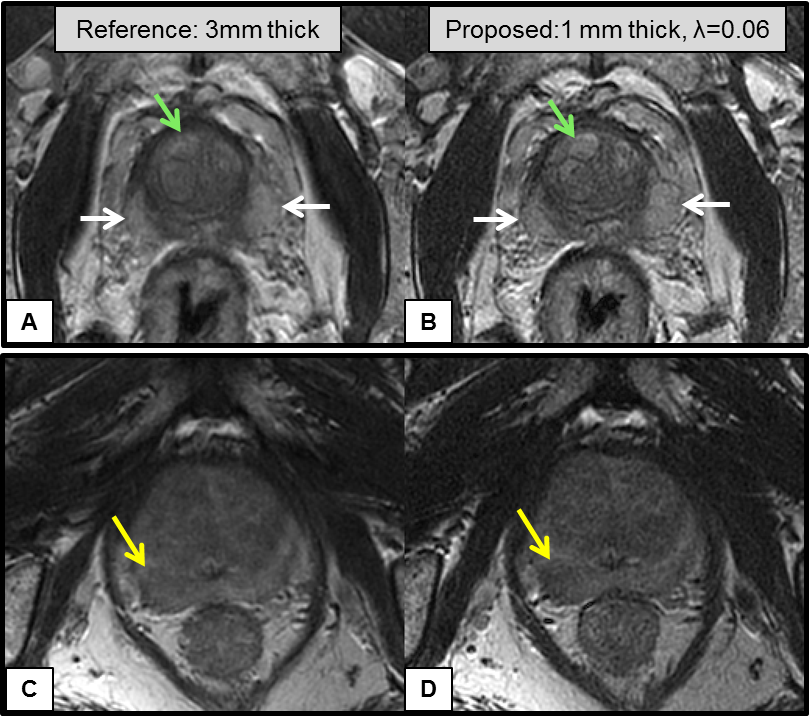
Results from the blinded comparison of the “reference” vs. the “proposed” patient studies are shown in Fig.4. For all five criteria of sharpness (A-E) the kZ-processing method was statistically superior. However, the kZ-processed results had an increased level of artifact (F), also statistically significant. Sample axial images from the clinical study are shown in Fig.5.
Conclusions:
We have described a kZ-space-based approach for providing improved through-plane spatial resolution in 2D MR image acquisition and applied it to T2-weighted spin-echo imaging. Results from the phantom study showed the ability to resolve a through-plane frequency of 0.5 lp/mm using 3.2mm thick slices with 0.8mm slice-to-slice spacing, suggesting sub-mm performance. The observed SNR performance matches that predicted theoretically. Results from the study of 16 subjects showed that kZ-processed images provided statistically significantly improved performance compared to the reference T2SE scan for all of five evaluation criteria of through-plane sharpness in prostate MRI. Increased sharpness can help in PI-RADS v2 scoring of the transition zone where differentiating benign nodules from cancer can be difficult.Acknowledgements
We would like to acknowledge Kathy Brown and Diane Sauter for assistance in the patient studies, Phil Rossman and Thomas Hulshizer for constructing the prostate phantom, and Joshua Trzasko, Ph.D. for technical assistance. This work was supported by the funding from NIH Grant RR018898 and Mayo Graduate School.References
1. Van Reeth E, Tham IWK, Tan CH, Poh CL. Super-resolution in magnetic resonance imaging: A review. Concepts Magn Reson Part A 2012;40A:306–325.
2. Tamez-Pena JG, Totterman S, Parker KJ. MRI isotropic resolution reconstruction from two orthogonal scans. In: Sonka M, Hanson KM, editors. SPIE Medical Imaging - Image Processing. Vol. 4322. International Society for Optics and Photonics; 2001. pp. 87–97.
3. Shilling RZ, Robbie TQ, Bailloeul T, Mewes K, Mersereau RM, Brummer ME. A super-resolution framework for 3-D high-resolution and high-contrast imaging using 2-D multislice MRI. IEEE Trans Med Imaging 2009;28:633–44.
4. Greenspan H, Oz G, Kiryati N, Peled S. MRI inter-slice reconstruction using super-resolution. Magn Reson Imaging 2002;20:437–46.
5. Okanovic M, Hillig B, Breuer F, Jakob P, Blaimer M. Time-of-flight MR-angiography with a helical trajectory and slice-super-resolution reconstruction. Magn Reson Med 2018;80:1812–1823. doi: 10.1002/mrm.27167.
6. Bushberg JT. The essential physics of medical imaging. Lippincott Williams & Wilkins; 2002.
Figures