1622
A quality control system for automated prostate segmentation on T2-weighted MRI1Department of Circulation and Medical Imaging, NTNU, Norwegian University of Science and Technolog, Trondheim, Norway, 2Department of Radiology and Nuclear Medicine, St. Olavs Hospital, Trondheim, Norway, 3Department of Radiation Oncology, University of Miami Miller School of Medicine, Miami, FL, United States
Synopsis
Computer-aided detection and diagnosis (CAD) systems have the potential to improve robustness and efficiency compared to traditional radiological reading of MRI in prostate cancer. Fully automated segmentation of the prostate is a crucial step of CAD. With the advent of the deep learning-based (DL) methods in medical imaging, series of networks have been developed to segment the prostate. Automated detection of poorly segmented cases would therefore be a useful supplement. Therefore, we proposed a quality control (QC) system to detect the cases that will result in poor prostate segmentation. The performance results shows that the proposed QC system is promising.
Purpose
Computer-aided detection and diagnosis (CAD) systems have been proposed to overcome the limitations of radiological reading of multiparametric MRI1. A primary step in an efficient prostate CAD system is fully automated segmentation of the prostate2. The performance of the most promising automated prostate segmentation methods, in most cases deep learning-based (DL) methods, is approximately equal to that of comparing segmentations of one expert with another3. However, manual quality control (QC) is still necessary, as poorly segmented prostates may lead to poor CAD performance leading to inaccurate diagnosis. Our aim was therefore to establish a fully automated QC system for prostate segmentation based on T2-weighted MRI.Methods
An overview of the proposed method is shown in Figure 1.
Prostate segmentation: The PROMISE12 challenge multi-centre/multi-vendor training dataset (N=50)4 was used to train a 3D prostate volume segmentation algorithm, proposed by Mirzaev5. This method is based on a fully convolutional neural network (CNN) with residual connections. The CNN architecture is a seven layer deep encoder-decoder. The convolution layers use zero padding and a rectified linear unit activation function.
The trained network was subsequently used to segment the images from the PROSTATEx challenge6 (N=342), PROMISE12 testing dataset (N=30) and the Medical Segmentation Decathlon7 training dataset (N=32), resulting in total N=404 in the combined dataset.
Prior to segmentation, all images were pre-processed by resizing into a matrix of 256*256, contrast limited adaptive histogram equalization and curvature driven image denoising.
Quality control system:
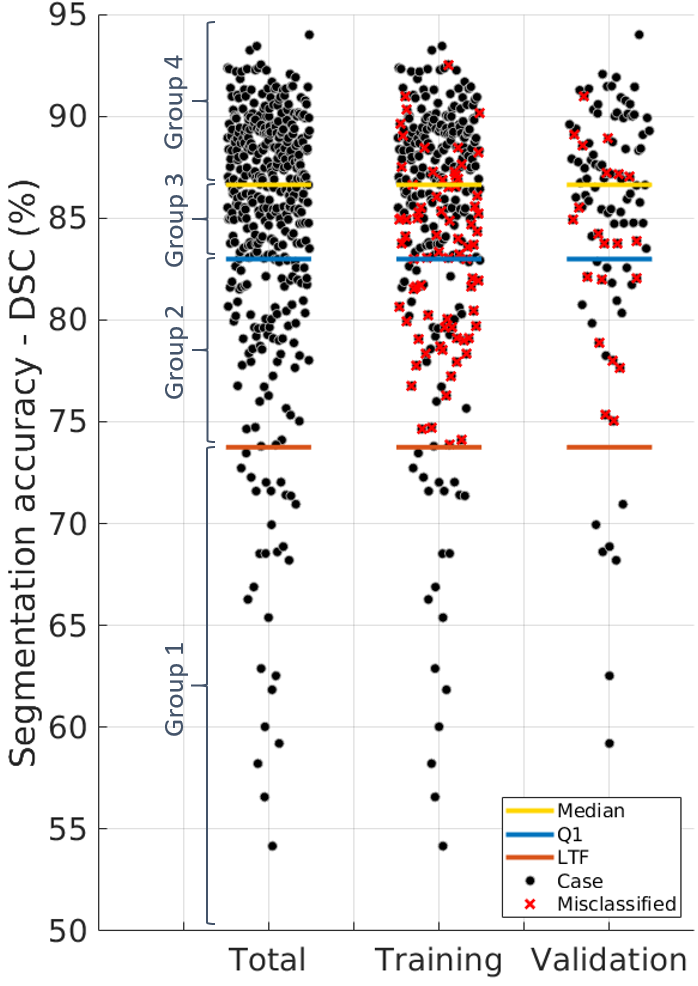
Firstly, the dice similarity coefficient (DSC) was calculated to evaluate the segmentation accuracy in comparison to available experts’ delineations. The interquartiles Q1, Q2 and Q3 of the DSC distributions and the Lower Tukey Fence (LTF), defined as Q1 – 1.5*(Q3-Q1), were calculated. The segmentations were categorized into 4 groups: Group 1 (Poor, DCS ≤ LTF), Group 2 (lower intermediate, LTF < DSC ≤ Q1), Group 3 (upper intermediate, Q1< DSC ≤ Q2 (median DSC)) and Group 4 (good, DSC > Q2).
Then, series of features (Table 1, column 1 - 5) were extracted using four different scaling approaches (Table 1, column 6) from four areas of the segmented prostate masks (Table 1, column 7) to create multiple feature combinations. Prior to feature extraction, all T2W images were N4 bias field corrected8 and slices in the masks covering less than 100 pixels were ignored.
Finally, a decision tree bagger classifier9 with 100 trees was trained (N=303) and validated (N=101) to distinguish the poor segmentations (Group 1) from the rest (Group 2-4). During the training, all of the feature combinations were ran to choose the one with the best performance on the training set, and which was used for validation.
To investigate the stability of the method, the process was repeated 10 times with different, randomly assigned training and validation groups.
Results
Figure 2 presents the QC system’s performance over the 10 models.
The median of the training classification errors was 0.00% and 26.90% for the poor and rest of cases, respectively. The median of the validation classification errors was 0.00% and 27.01% for the poor and rest of cases, respectively. As may be expected, the classification accuracy is better for the good segmentations (Group 4) than for the intermediate segmentations (Group 2 and 3).
In the 10 different models, histogram intensity features played a role in 5 models, while both the texture and shape features played a role in all 10 models. A combination of apex and middle of the prostate was chosen in 8 of the models. Six models chose features extracted with a scaling approach.
Discussion
The system was capable of detecting most of the poor segmented cases, which is its main task, in the 10 models at the cost of erroneously flagging some of the intermediate and good cases as poor. In clinical practice, this could mean that a radiologist would avoid manually checking up to approximately 73% of the automated segmentations.
Although slightly different features were selected in each of the 10 models, the validation performance was relatively stable. Figure 3 shows the distribution of the cases in one of the models.
We also observed that the texture and shape features played an important role in all of the models. This is in the accordance with the way the DL algorithms work, gradually moving from shape-based to texture-based features through layers. A combination of extracted features from apex and middle of the prostate with a scaling approach would be preferred over others.
Conclusion
We developed and evaluated a QC system that shows promise for automatic detection of poor segmentations from DL-based prostate segmentation on T2-weighted MR images.Acknowledgements
We would like to thank SPIE, the AAPM, the NCI, and Radboud University in addition to the organizers of PROSTATEx, Medical Segmentation Decathlon and PROMISE12 challenges for making their datasets available. Also, We would like to thank Dr. Inom Mirzaev from Ohio State University for sharing his method. In addition, we would like to thank Dr. Geert Litjens from Radboud University for his help with providing the DSC scores for the PROMISE12 testing dataset.References
1. Litjens G, Debats O, Barentsz J, Karssemeijer N, Huisman H. Computer-aided detection of prostate cancer in MRI. IEEE Trans Med Imaging 2014; 33(5): 1083-92.
2. Lemaitre G, Marti R, Freixenet J, Vilanova JC, Walker PM, Meriaudeau F. Computer-Aided Detection and diagnosis for prostate cancer based on mono and multi-parametric MRI: a review. Comput Biol Med 2015; 60: 8-31.
3. Shahedi M, Cool DW, Romagnoli C, et al. Spatially varying accuracy and reproducibility of prostate segmentation in magnetic resonance images using manual and semiautomated methods. Med Phys 2014; 41(11).
4. Litjens G, Toth R, van de Ven W, et al. Evaluation of prostate segmentation algorithms for MRI: the PROMISE12 challenge. Med Image Anal 2014; 18(2): 359-73.
5. Mirzaev I. Fully convolutional neural network with residual connections for automatic segmentation of prostate structures from MR images. 2017. https://promise12.grand-challenge.org/serve/public_html/pdfs/MBIOS.pdf (accessed 06 Nov 2018).
6. SPIE, AAPM, NCI. PROSTATEx-2 CHALLENGE. https://www.aapm.org/GrandChallenge/PROSTATEx-2/ (accessed 06 Nov 2018).
7. Medical Segmentation Decathlon - Generalisable 3D Semantic Segmentation http://medicaldecathlon.com/ (accessed 06 Nov 2018).
8. Tustison NJ, Avants BB, Cook PA, et al. N4ITK: improved N3 bias correction. IEEE Trans Med Imaging 2010; 29(6): 1310-20.
9. Breiman L. Bagging predictors. Mach Learn 1996; 24(2): 123-40.
Figures