1618
New three-parameter mathematical model for accurately fitting early enhancement of ultrafast dynamic contrast enhanced MRI to improve diagnosis of prostate cancer1Radiology, University of Chicago, Chicago, IL, United States
Synopsis
Ultrafast DCE-MRI shows promise for detection of cancers. However, existing simple mathematical models do not have a smooth transition from baseline to early uptake phase and thus do not accurately model the early kinetics. Here we developed a new three-parameter model by combining a 4th-order rational and exponential function, namely REM (rational-exponential-model). Ultrafast prostate DCE-MRI was used to verify the accuracy of REM and compare the REM with two other models. The curvatures during initial enhancement and transition to washout were calculated. The REM characterized contrast agent kinetics for ultrafast DCE-MRI more accurately than previously developed models and thus improved diagnostic accuracy.
INTRODUCTION
Recent studies show promise for detection of cancers in the prostate and breast using ultrafast dynamic contrast enhanced (DCE) MRI.1,2 The important new diagnostic information from ultrafast DCE-MRI comes from the very early contrast uptake phase. However, common simple mathematical models for fitting DCE-MRI data do not accurately model the early kinetics as they do not have a smooth transition from the baseline to the early uptake phase. Therefore, significant errors in data fitting result in loss of diagnostic accuracy. There are two common three-parameter mathematical models, the empirical mathematical model (EMM) (Eq. [1])3 and Weibull (Eq. [2])4, that are often used for fitting contrast agent concentration curves (C(t)) as function of time (t) obtained in DCE-MRI:
$$C(t)=A\cdot\left(1-e^{-\alpha t}\right)\cdot e^{-\beta t}-----[1],$$
and
$$C(t)=A\cdot t\cdot e^{-(\beta t)^\alpha}-----[2].$$
Although both models have zero contrast agent concentation value at t = 0 (enhancement starting point), these models have no derivative at t = 0 due to the fact that transition from baseline to the uptake phase is instantaneous, i.e., $$$\lim_{t \rightarrow 0^-} C(t)^{'}\neq\lim_{t \rightarrow 0^+} C(t)^{'}$$$. This could cause inaccurate fitting near the time of initial enhancement for ultrafast DCE-MRI curves. Therefore, a new simple model that rectifies this problem is needed.
In this research, we developed a new three-parameter model that fits C(t) accurately and compared it with the EMM and Weibull model. In addition, the sum of two peak maximum curvatures (during initial enhancement and transition from enhancement to washout) was calculated to characterize tissue contrast agent uptake and washout simultaneously to determine whether this can be used to differentiate cancer from benign tissue.
THEORY and METHODS
The new model uses a combination of a 4th order rational and an exponential function, namely the rational exponential model (REM):
$$C(t)=A\cdot \frac{(\alpha t)^4}{1+(\alpha t)^4}\cdot e^{-\beta t}-----[3].$$
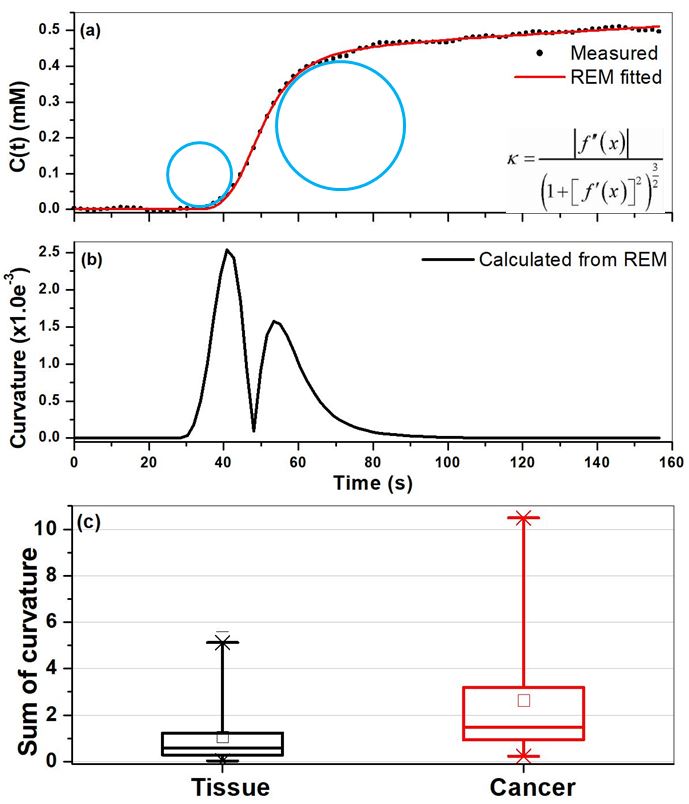
The REM has derivative at t = 0, which provides smooth transition from baseline to the start of enhancement for ultrafast DCE-MRI. Curvatures were measured from REM fitted curves, and the sum of two maximum curvatures (during initial enhancement and transition from enhancement to washout) was calculated to characterize tissue contrast agent uptake and washout simultaneously.
Eighteen patients with biopsy-confirmed prostate cancer were included in this IRB-approved study. The MR imaging was performed on a Philips Achieva 3T-TX scanner. DCE-MRI data were acquired with T1-FFE sequence (typically TR/TE = 3.5/1.0 ms, FOV = 180 mm, matrix size = 160×160, slice thickness = 3 mm, flip angle = 10°) at 150 dynamic scan points with a temporal resolution of 1.35 - 4.3 s (mean 2.2 s) before, during, and after intravenous administration of contrast agent DOTAREM with dose 0.1 mmol/kg.
Regions-of-interest (ROIs) for prostate cancer (n = 44), normal tissue (n = 64) in different prostate zones were drawn on T2W images and transferred to DCE images. For each ROI, the average signal intensity was calculated, and then C(t) was calculated from the non-linear model using the gradient echo signal equation.
RESULTS
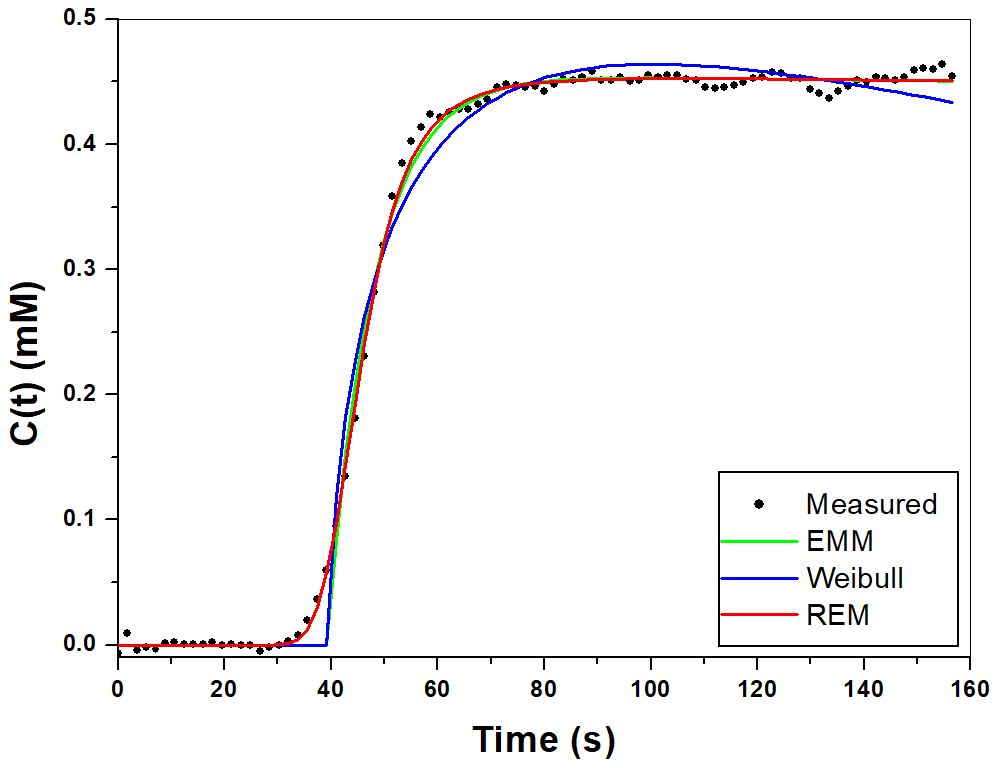
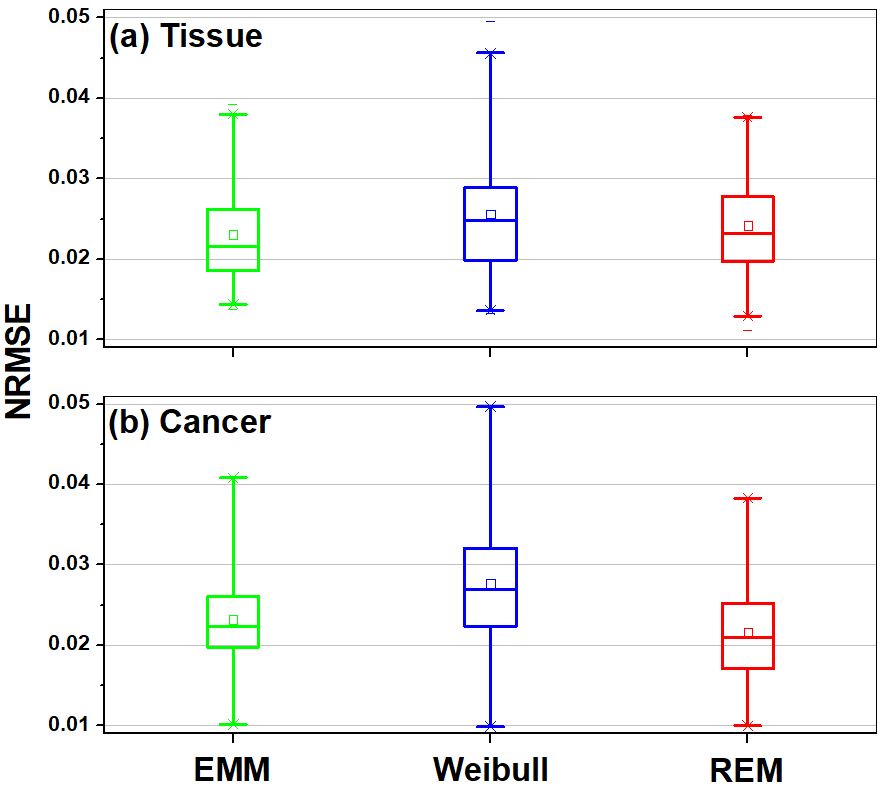
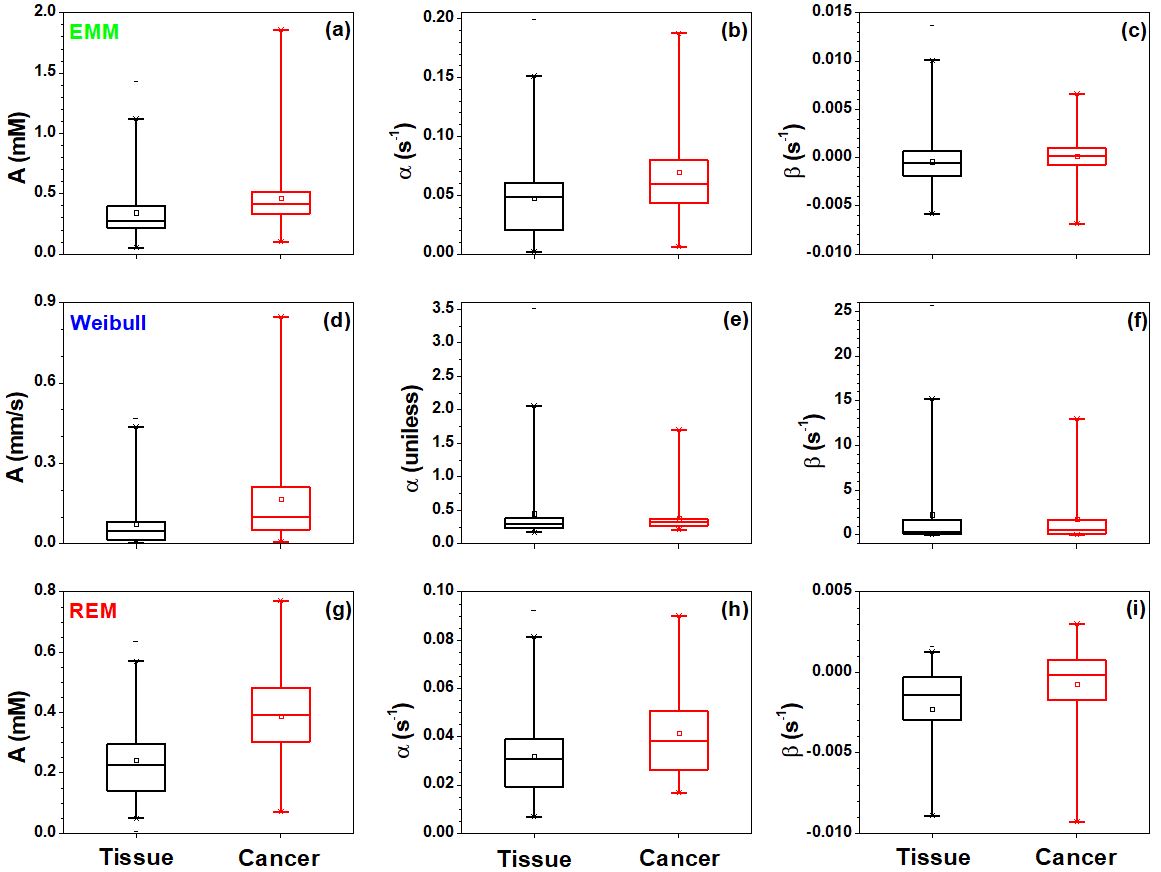
Figure 1 shows an example of prostate cancer C(t) fitted by the EMM (green line), Weibull (blue line) and REM (red line). The REM accurately characterized early contrast agent uptake kinetics and the normalized root-mean-square-errors between C(t) and fitted curves for the REM were much smaller for cancers (Fig. 2) than other models. The REM parameters A (maximum enhancement) and α (uptake rate) were much better for differentiating between prostate tissue and cancers than other two models (Fig. 3). Figure 4 illustrates the use of curvatures calculated from fitted REM curves to differentiate between prostate tissue and cancers. The area under ROC curve (AUC) for REM parameters (A and α) and the sum of peak curvatures were about 0.79, which was at least 15% higher than other two models parameters.DISCUSSION
The simple three-parameter mathematical model was developed for ultrafast DCE-MRI. The REM fits to ultrafast DCE-MRI data more accurately for early lesion kinetics and improves diagnostic accuracy. The 2nd order rational function could be used instead of 4th order in the REM for DCE-MRI with slightly lower temporal solution than ultrafast sequence.
The concept of curvature for C(t) is introduced and can be calculated from the REM fitted curves. The REM parameter may improve in diagnosis of prostate cancer. The combination of parameters could be further improving the cancer diagnostic accuracy.
The REM is likely to be a very powerful method for analyzing low dose DCE-MRI.5 Because of with low dose of contrast agents and short injection time, the initial uptake tends to be much sharper and possibly the transition from rapid uptake to slower uptake, plateau, and/or washout tends to be much sharper too than with higher dose of contrast agents.
Acknowledgements
This research is supported by Guerbet LLC and National Institutes of Health (R01 CA172801-01, R01 CA218700-01, and 5U01 CA142565-09).References
1. Pineda FD, Medved M, Wang S, Fan X, Schacht DV, Sennett C, Oto A, Newstead GM, Abe H, Karczmar GS. Ultrafast Bilateral DCE-MRI of the Breast with Conventional Fourier Sampling: Preliminary Evaluation of Semi-quantitative Analysis. Acad Radiol. 2016; 23(9):1137-44.
2. Chatterjee A, He D, Fan X, Wang S, Szasz T, Yousuf A, Pineda F, Antic T, Mathew M, Karczmar GS, Oto A. Performance of Ultrafast DCE-MRI for Diagnosis of Prostate Cancer. Acad Radiol. 2018; 25(3):349-358.
3. Jansen SA, Fan X, Karczmar GS, Abe H, Schmidt RA, Newstead GM. Differentiation between benign and malignant breast lesions detected by bilateral dynamic contrast-enhanced MRI: a sensitivity and specificity study. Magn Reson Med. 2008; 59(4):747-54.
4. Gal Y, Mehnert A, Bradley A, McMahon K, Crozier S. An evaluation of four parametric models of contrast enhancement for dynamic magnetic resonance imaging of the breast. Conf Proc IEEE Eng Med Biol Soc. 2007; 2007:71-4.
5. He D, Chatterjee A, Fan X, Wang S, Eggener S, Yousuf A, Antic T, Oto A, Karczmar GS. Feasibility of Dynamic Contrast-Enhanced Magnetic Resonance Imaging Using Low-Dose Gadolinium: Comparative Performance With Standard Dose in Prostate Cancer Diagnosis. Invest Radiol. 2018; 53(10):609-615.
Figures