1617
Computer aided diagnosis of prostate cancer in central gland using GOIA-sLASER 1H MRS1The University of Newcastle, Newcastle, Australia, 2Calvary Mater Newcastle, Newcastle, Australia, 3Hunter Medical Research Institute (HMRI), Newcastle, Australia, 4Radboud University Medical Center, Nijmegen, Nijmegen, Netherlands
Synopsis
The aim of the work described in this paper is twofold. First, evaluate the efficacy of the GOIA-
Introduction
TRUS guided biopsy of central gland lesions with malignant potential causes false negative findings 1. MRSI provides metabolic information in the form of spectra, which are associated with the presence and aggressiveness of primary and recurrent prostate cancer2-4. The predominant prostate metabolites detected by 1H MRSI are citrate (Cit), choline (Cho), creatine (Cr) and polyamines, mostly spermine (Spm) 5. Previous studies of prostate cancer expressed high Cho levels and low Cit and Spm levels in tumour when compared to normal tissues 6,7. However, MRSI has been excluded from routine clinical mp-MRI in the most recent updated PI-RADS V2, probably due to moderate metabolite signal-to-noise ratio (SNR), relatively long acquisition times, need for a high level of operator expertise, low spectral resolution (especially at 1.5T) and non-standard acquisition and post-processing techniques 8. The current wide use of high field scanners at 3T and above has led to substantial improvements in 1H MRSI SNR. Recently, a gradient-modulated offset-independent adiabatic (GOIA) semi-localized adiabatic selective refocusing (sLASER) sequence was introduced to address these problems 9,10. The improvements offered by this sequence may lead to a more prominent role for 1H MRSI in prostate cancer management, especially in classification of normal vs cancer and low risk vs high risk in central gland prostate cancer tissue where diagnosis remains challenging.
The purpose of this study is to evaluate the efficacy of in vivo 3-dimensional (3D) 1H GOIA-sLASER MRSI in diagnosing central gland prostate cancer and developing four risk models to differentiate a) normal vs cancer, b) low risk vs high risk cancer, c) low risk vs intermediate risk cancer and d) intermediate risk vs high risk cancer voxels.
Material and methods
3D 1H MRSI using GOIA-sLASER was performed on 36 patients with biopsy-proven low and high risk central gland prostate cancer (age range: 53-72 years) using a 3T MRI scanner with external phase-array coil. 3D 1H MRSI data were acquired using a GOIA-sLASER sequence with TE = 88 ms, TR = 930 ms, averages = 4, FOV (LR x AP x HF) = 84 × 84 × 70 mm3, dual MEGA RF pulses for water and lipid saturation, weighted k-space sampling and Hamming filtering, matrix = 12 × 12 × 10, nominal voxel size = 7×7×7 mm3. Eight outer-volume suppression (OVS) slabs were used to suppress peri-prostatic lipid and water signals. B0 was optimized using a vendor provided localized B0 shimming tool, followed by manual shimming to improve the water line width. The 1H MRSI data acquisition took 8.42 minutes. All cancer region of interests (ROI)s were selected by an experienced radiologist. For each voxel within the ROI, seven metabolite ratios were calculated and split into two subsets, one for training and another for model testing. Four support vector machine (SVM) models were built using the four training datasets. The accuracy, sensitivity and specificity for each model were calculated using the testing dataset.Results
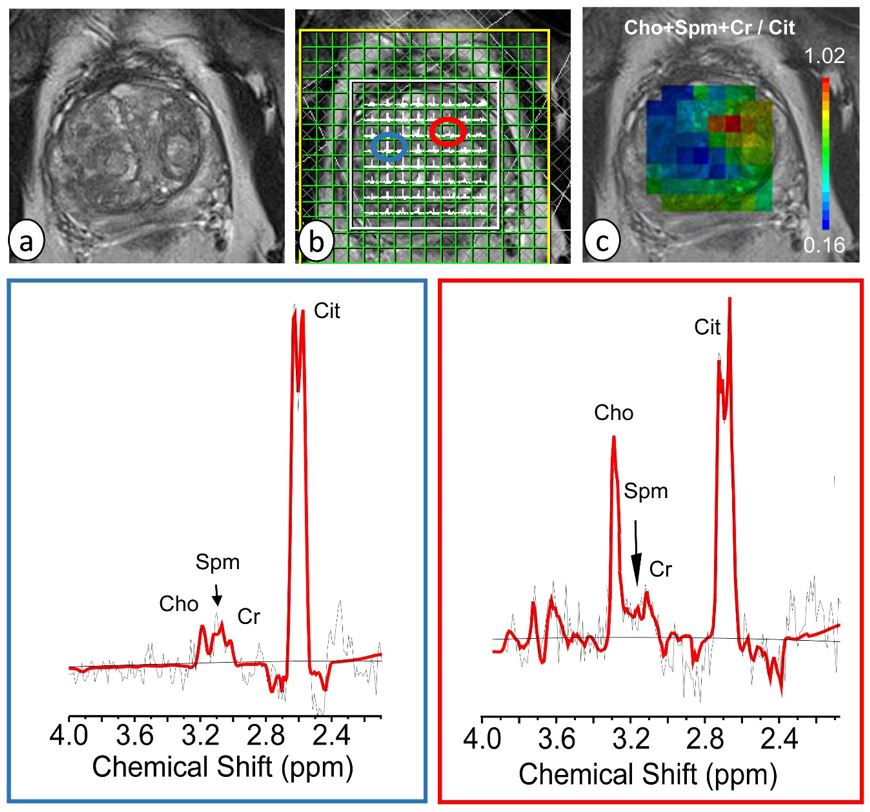
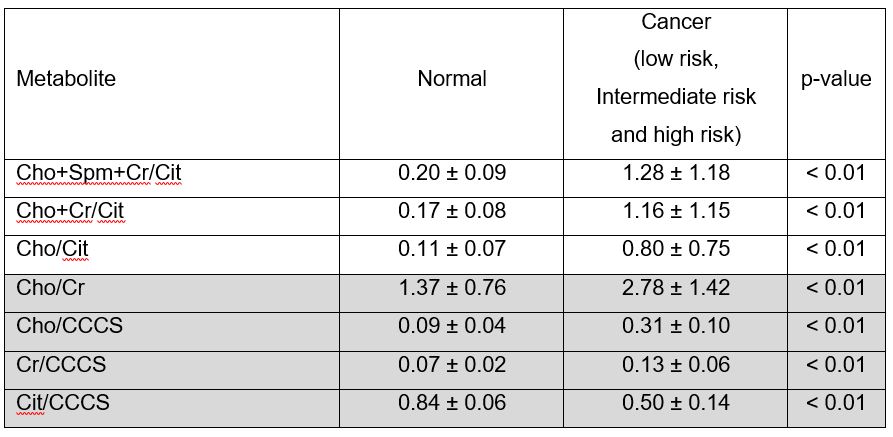
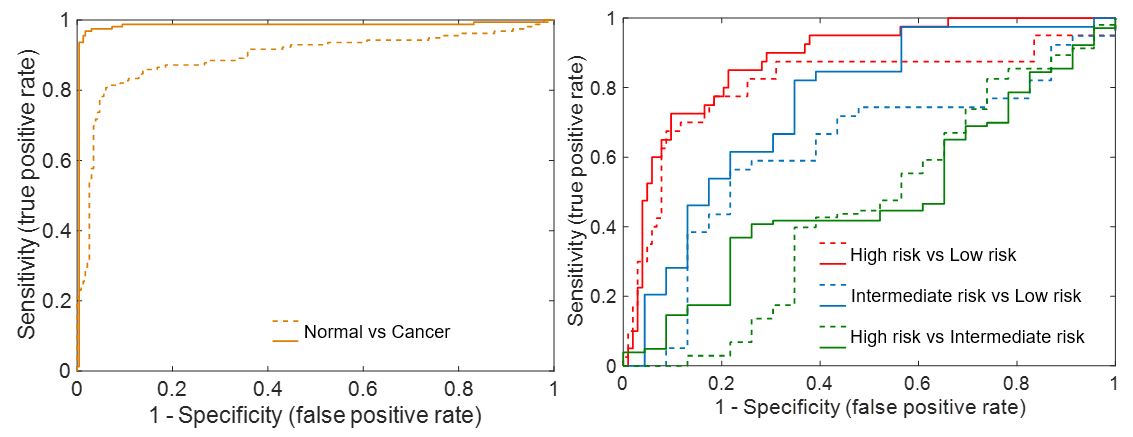
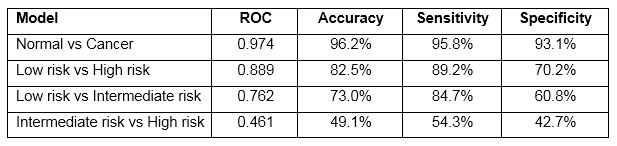
The results demonstrated high quality spectra for central gland prostate cancer. The MR spectra of the prostate obtained with GOIA-sLASER in the selected normal and cancer voxels of the prostate cancer patient showed a good separation of Cr and Cho peaks from each other as can be seen in the spectral fitting with LCModel (Figure 1). The mean values of seven ratios; Cho+Spm+Cr/Cit, Cho+Cr/Cit, Cho/Cit, Cho/Cr, Cr/CCCS, Cho/CCCS and Cit/CCCS from MRSI examinations using GOIA-sLASER in cancer and normal ROIs for all included patients were calculated and summarized in Table 1. The ROC curve of the final radial basis function (RBF) SVM model for each set of two groups was plotted and the area under the curve (AUC) used to describe and compare the diagnostic performance of each model (Figure 2). The normal vs cancer diagnostic model achieved the highest predictive performance with an accuracy, sensitivity and specificity of 96.2%, 95.8% and 93.1%, respectively. The accuracy, sensitivity and specificity of the low risk vs high risk cancer and low risk vs intermediate risk cancer models were 82.5%, 89.2% and 70.2% and 73.0%, 84.7% and 60.8%, respectively. The intermediate risk vs high risk cancer model yielded the lowest accuracy, sensitivity and specificity at 49.1%, 54.3% and 42.7%, respectively (Table 2).Conclusion
GOIA-sLASER sequence implementation with an external phase-array coil can be used for in vivo, non-invasive and fast assessment of central gland prostate cancer. All cancer voxels showed highly abnormal spectra in GOIA-sLASER spectroscopy dataset (high Cho+Cr/Cit, Cho/Cit and Cho/Cr levels). The classification offers promising possibilities as a diagnostic tool for discriminating normal vs cancer, low risk vs high risk cancer and low risk vs intermediate risk cancer.Acknowledgements
This study was supported by Hunter Research Cancer Alliance (HCRA).References
1. Oto A, Kayhan A, Jiang Y, et al. Prostate cancer: differentiation of central gland cancer from benign prostatic hyperplasia by using diffusion-weighted and dynamic contrast-enhanced MR imaging. Radiology. 2010; 257(3): 715-723.
2. Posse S, Otazo R, Dager SR, et al. MR spectroscopic imaging: principles and recent advances. Journal of Magnetic Resonance Imaging. 2013; 37(6): 1301-1325.
3. Kobus T, Wright AJ, Van Asten JJ, et al. In vivo 1 H MR spectroscopic imaging of aggressive prostate cancer: Can we detect lactate? Magnetic resonance in medicine. 2014; 71(1): 26-34.
4. Nagarajan R, Margolis D, Raman S, et al. MR spectroscopic imaging and diffusion‐weighted imaging of prostate cancer with Gleason scores. Journal of Magnetic Resonance Imaging. 2012; 36(3): 697-703. 5. Kurhanewicz J, Vigneron DB, Nelson SJ. Three-dimensional magnetic resonance spectroscopic imaging of brain and prostate cancer. Neoplasia. 2000 Jan 1;2(1-2):166-89.
6. Fusco R, Sansone M, Petrillo M, Setola SV, Granata V, Botti G, Perdonà S, Borzillo V, Muto P, Petrillo A. Multiparametric MRI for prostate cancer detection: Preliminary results on quantitative analysis of dynamic contrast enhanced imaging, diffusion-weighted imaging and spectroscopy imaging. Magnetic resonance imaging. 2016 Sep 1;34(7):839-45.
7. Kobus T, Wright AJ, Weiland E, Heerschap A, Scheenen TW. Metabolite ratios in 1H MR spectroscopic imaging of the prostate. Magnetic resonance in medicine. 2015 Jan;73(1):1-2.
8. Rosenkrantz AB, Ginocchio LA, Cornfeld D, et al. Interobserver reproducibility of the PI-RADS version 2 lexicon: a multicenter study of six experienced prostate radiologists. Radiology. 2016; 280(3): 793-804. 9. Steinseifer IK, van Asten JJ, Weiland E, et al. Improved volume selective 1H MR spectroscopic imaging of the prostate with gradient offset independent adiabaticity pulses at 3 tesla. Magnetic resonance in medicine. 2015; 74(4): 915-924.
10. Steinseifer IK, Philips BW, Gagoski B, et al. Flexible proton 3 D MR spectroscopic imaging of the prostate with low‐power adiabatic pulses for volume selection and spiral readout. Magnetic resonance in medicine. 2017; 77(3): 928-935.
Figures