1616
Optimized 3D Variable Flip Angle Fast Spin Echo: Simulating Different Prostate Tissue Types to Improve Contrast for Prostate Cancer Detection1Stritch School of Medicine, Loyola University Chicago, Maywood, IL, United States, 2Radiology, Loyola University Medical Center, Maywood, IL, United States
Synopsis
MRI of the prostate has become a crucial component of prostate cancer diagnosis. Most clinical sites use 2D FSE for T2 imaging. However, drawbacks exist and some institutions have moved to 3D using FSE-VFL. While groups have presented clinical results using FSE-VFL, none have published detailed investigations of different flip angle trajectories and parameter choices for maximizing lesion contrast in prostate cancer imaging. Flip angle trajectories were simulated for 3D FSE-VFL using T1 and T2 appropriate for prostate and then tested in a phantom. Overall, signal simulations proved useful for analyzing different parameters and flip angle trajectories for T2-weighted sequences.
Introduction
Since the advent of commercially available systems and software that enable radiologists to draw target regions for MR-Ultrasound fused biopsy procedures, MR prostate exam volume has exploded. While diffusion weighted imaging (and dynamic contrast-enhanced imaging to some extent) has rapidly increased in importance over the last decade for detecting suspicious lesions, T2-weighted (T2w) imaging still has a primary role in detection of transitional zone lesions (PI-RADS v2, (1)). In addition, target regions are always drawn on T2w images due to their superior resolution and geometric integrity. The vast majority of literature and most clinical sites have used 2D fast spin echo (FSE) pulse sequences for T2w imaging. However, multiplanar (axial, coronal, and sagittal) images must be acquired due to the large difference between slice thickness and in-plane resolution. The thick slices can also lead to partial volume averaging artifacts, which can blur features and make identifying benign prostatic hyperplasia nodules more difficult. Due to this, some institutions have moved to 3D imaging, as slice thickness can be reduced by a factor of 2-3. These 3D T2w pulse sequences are typically described as variable flip angle (VFL) FSE sequences, as the refocusing pulse flip angles vary as compared to fixed angle 2D FSE sequences. 3D FSE based sequences require long echo trains to ensure acquisition times are clinically feasible and the VFL refocusing pulse train ensures that signal remains at the later echoes. The drawback to this technique is that contrast also changes compared to standard 2D FSE and inferior contrast is often cited as a reason to not use 3D T2w FSE-VFL for prostate cancer imaging.
While a variety of groups have presented clinical results using 3D T2w FSE-VFL (2–5), very few, if any, have published detailed investigations of different flip angle trajectories and parameter choices (especially TE) for maximizing lesion contrast in prostate cancer imaging. I propose to simulate several flip angle trajectories for 3D FSE-VFL and compare to standard 2D FSE using T1 and T2 values appropriate for prostate and validate signal trajectories in a phantom.
Methods
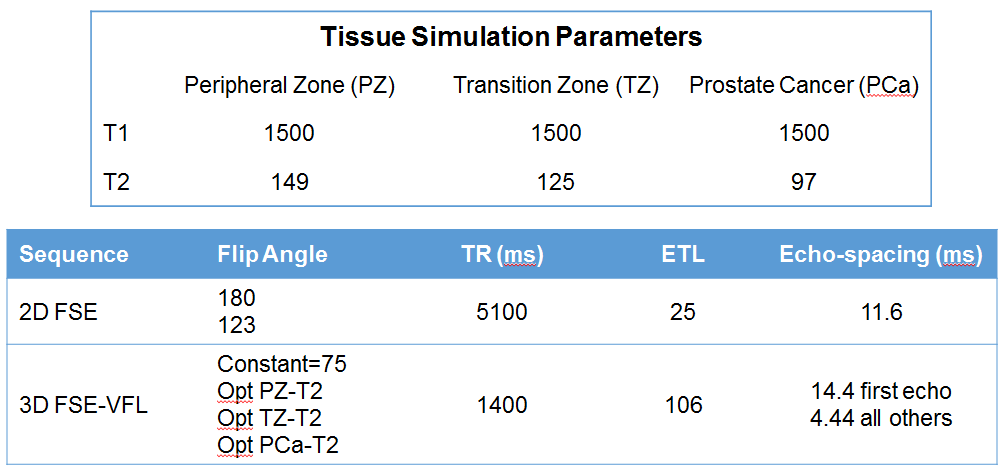
Standard 2D FSE and 3D FSE-VFL sequences were simulated across Peripheral Zone, Transition Zone, and tumor T1 & T2 times (6–8). Optimized VFL's were calculated from the method proposed by Mugler et al. (9). Sequence parameters were chosen based on typical clinical protocols at our institution. Figure 1 shows the specific parameters. To validate the signal trajectories generated in the simulations, gel phantoms were made (10) to target the T1 and T2 of the PZ, TZ, and tumor. The 3D FSE-VFL optimized sequences were then run without phase-encoding gradients on the TZ phantom to generate a signal trajectory in the raw kspace data.Results
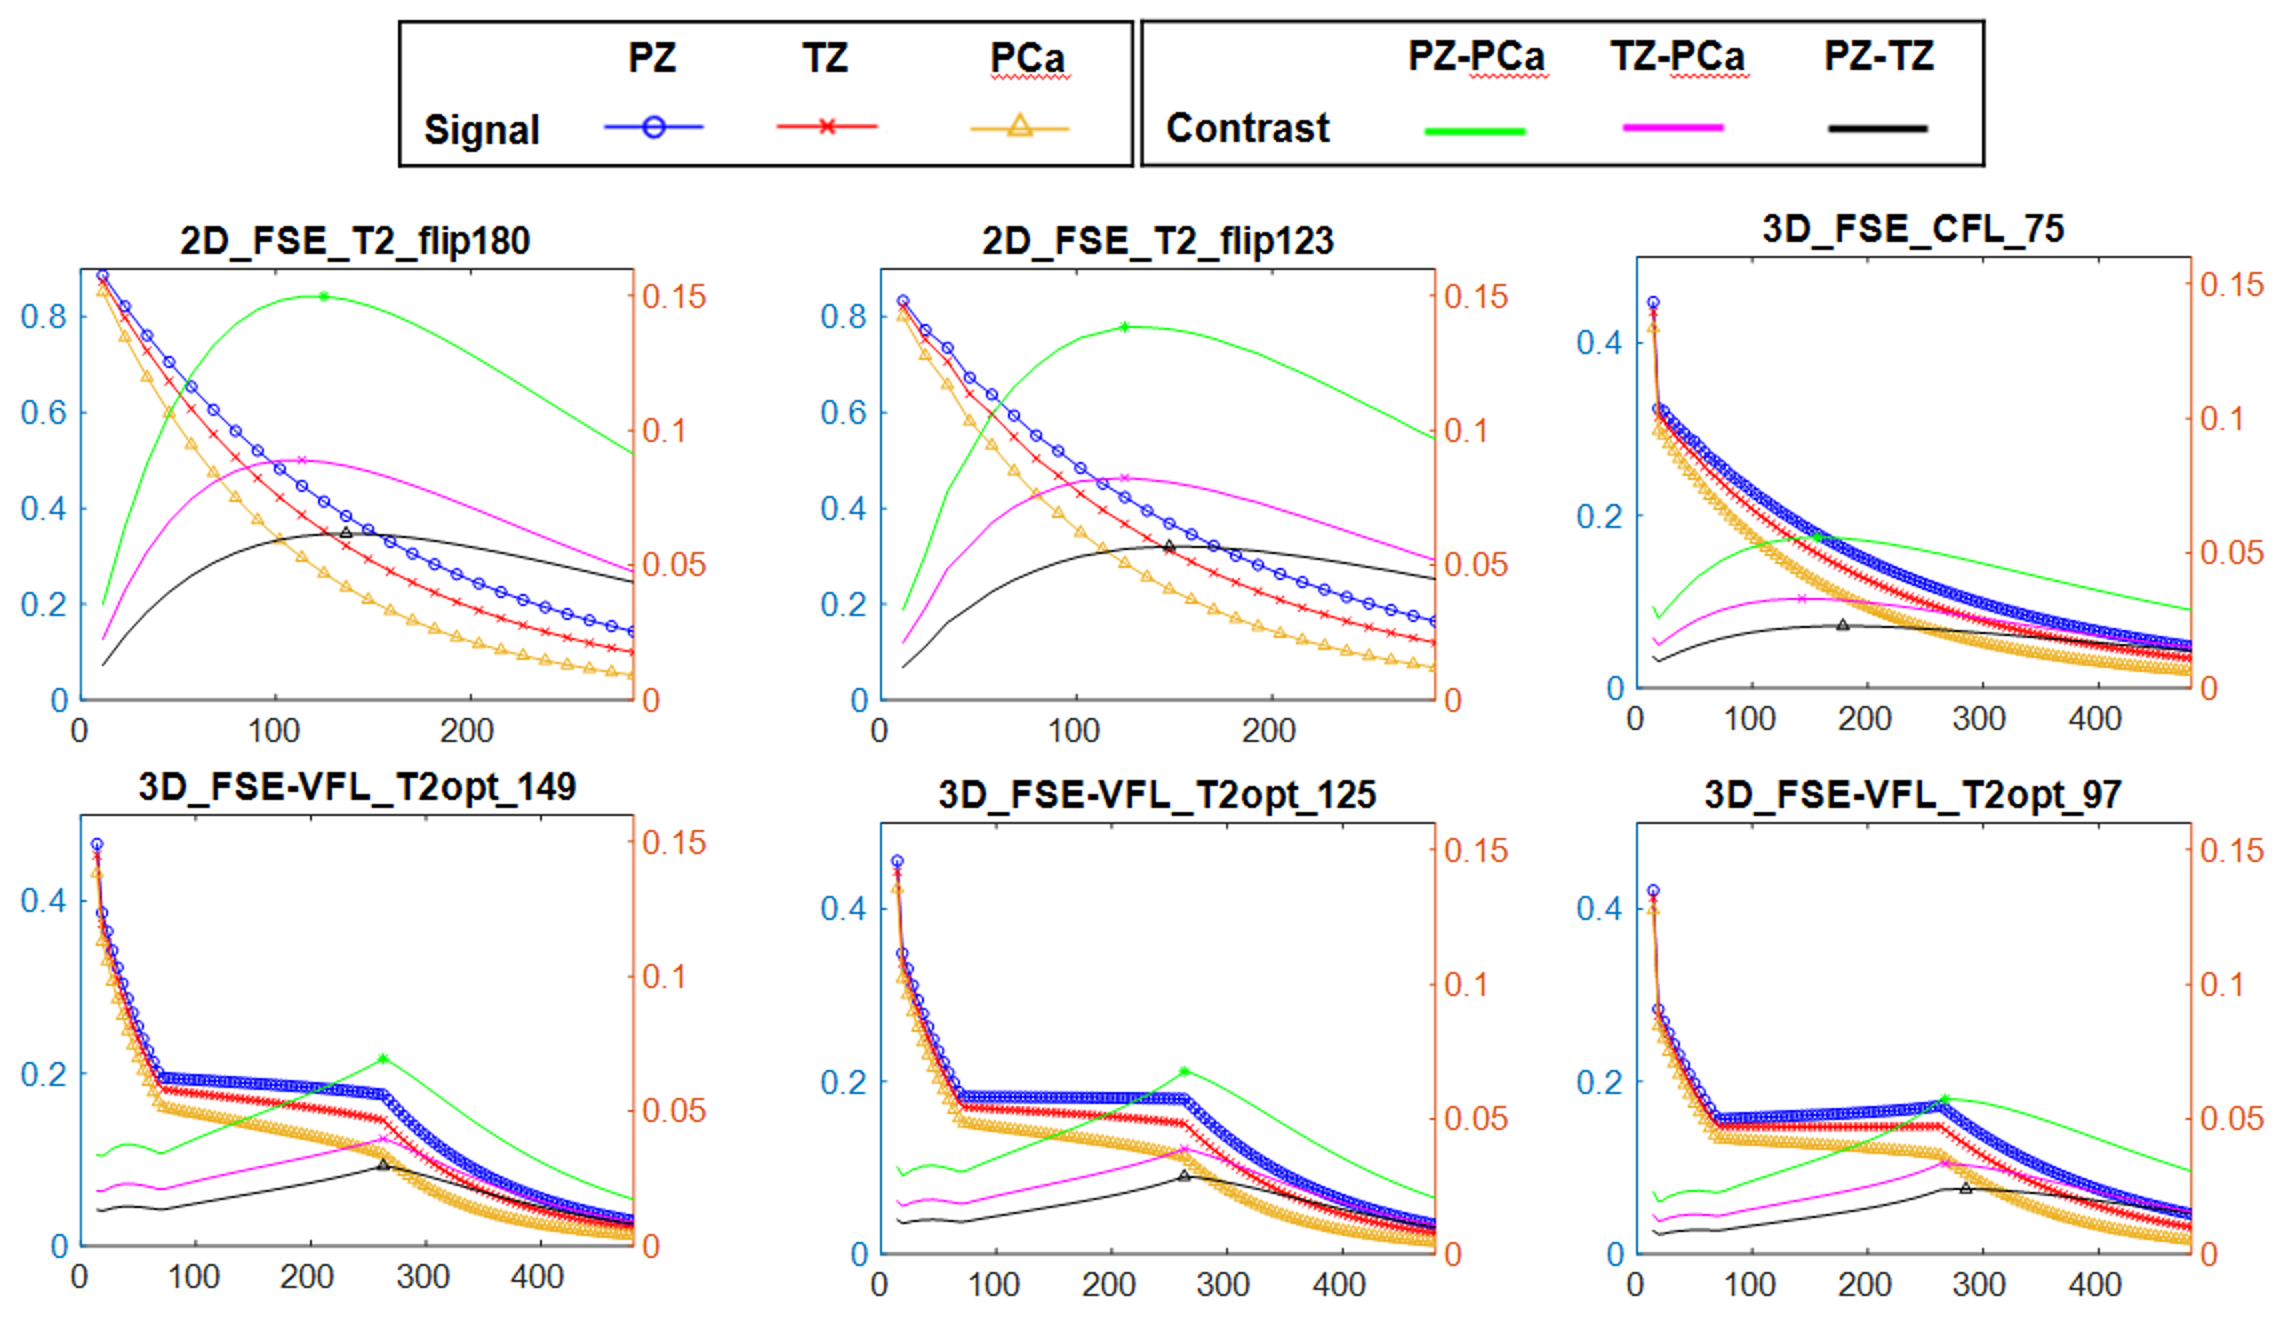
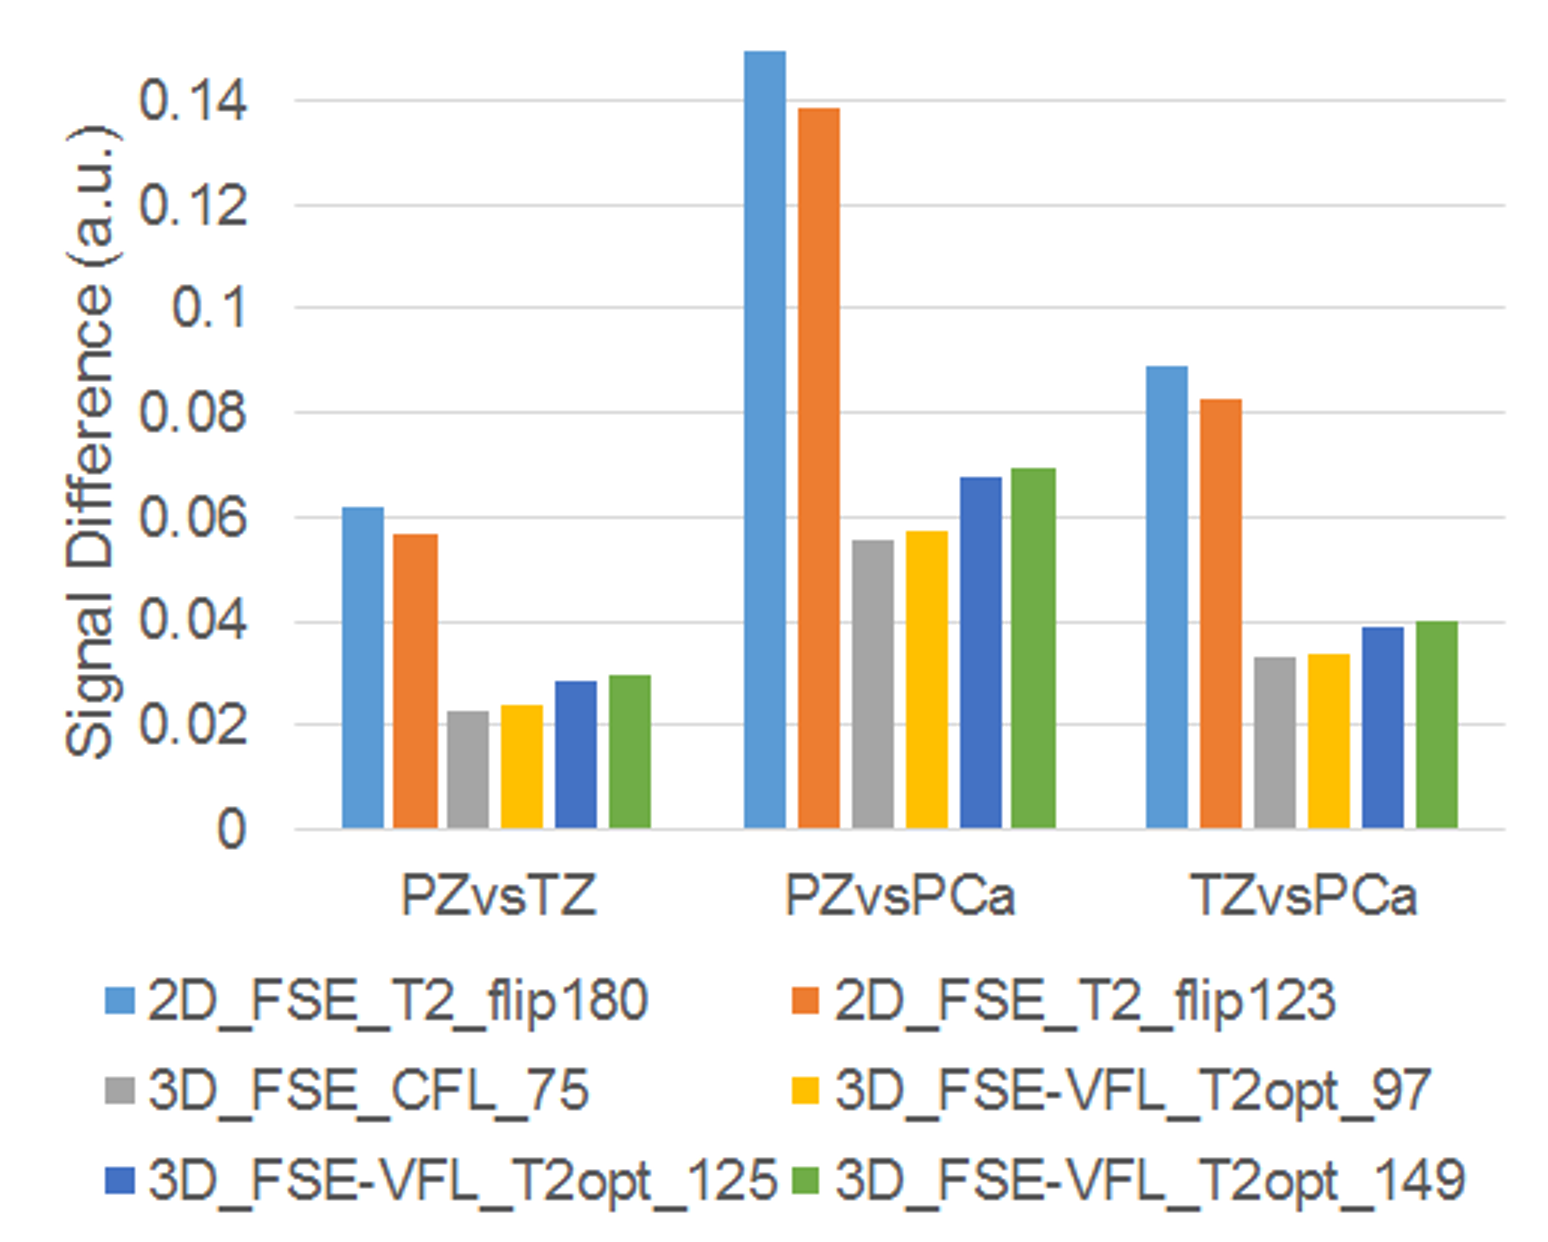
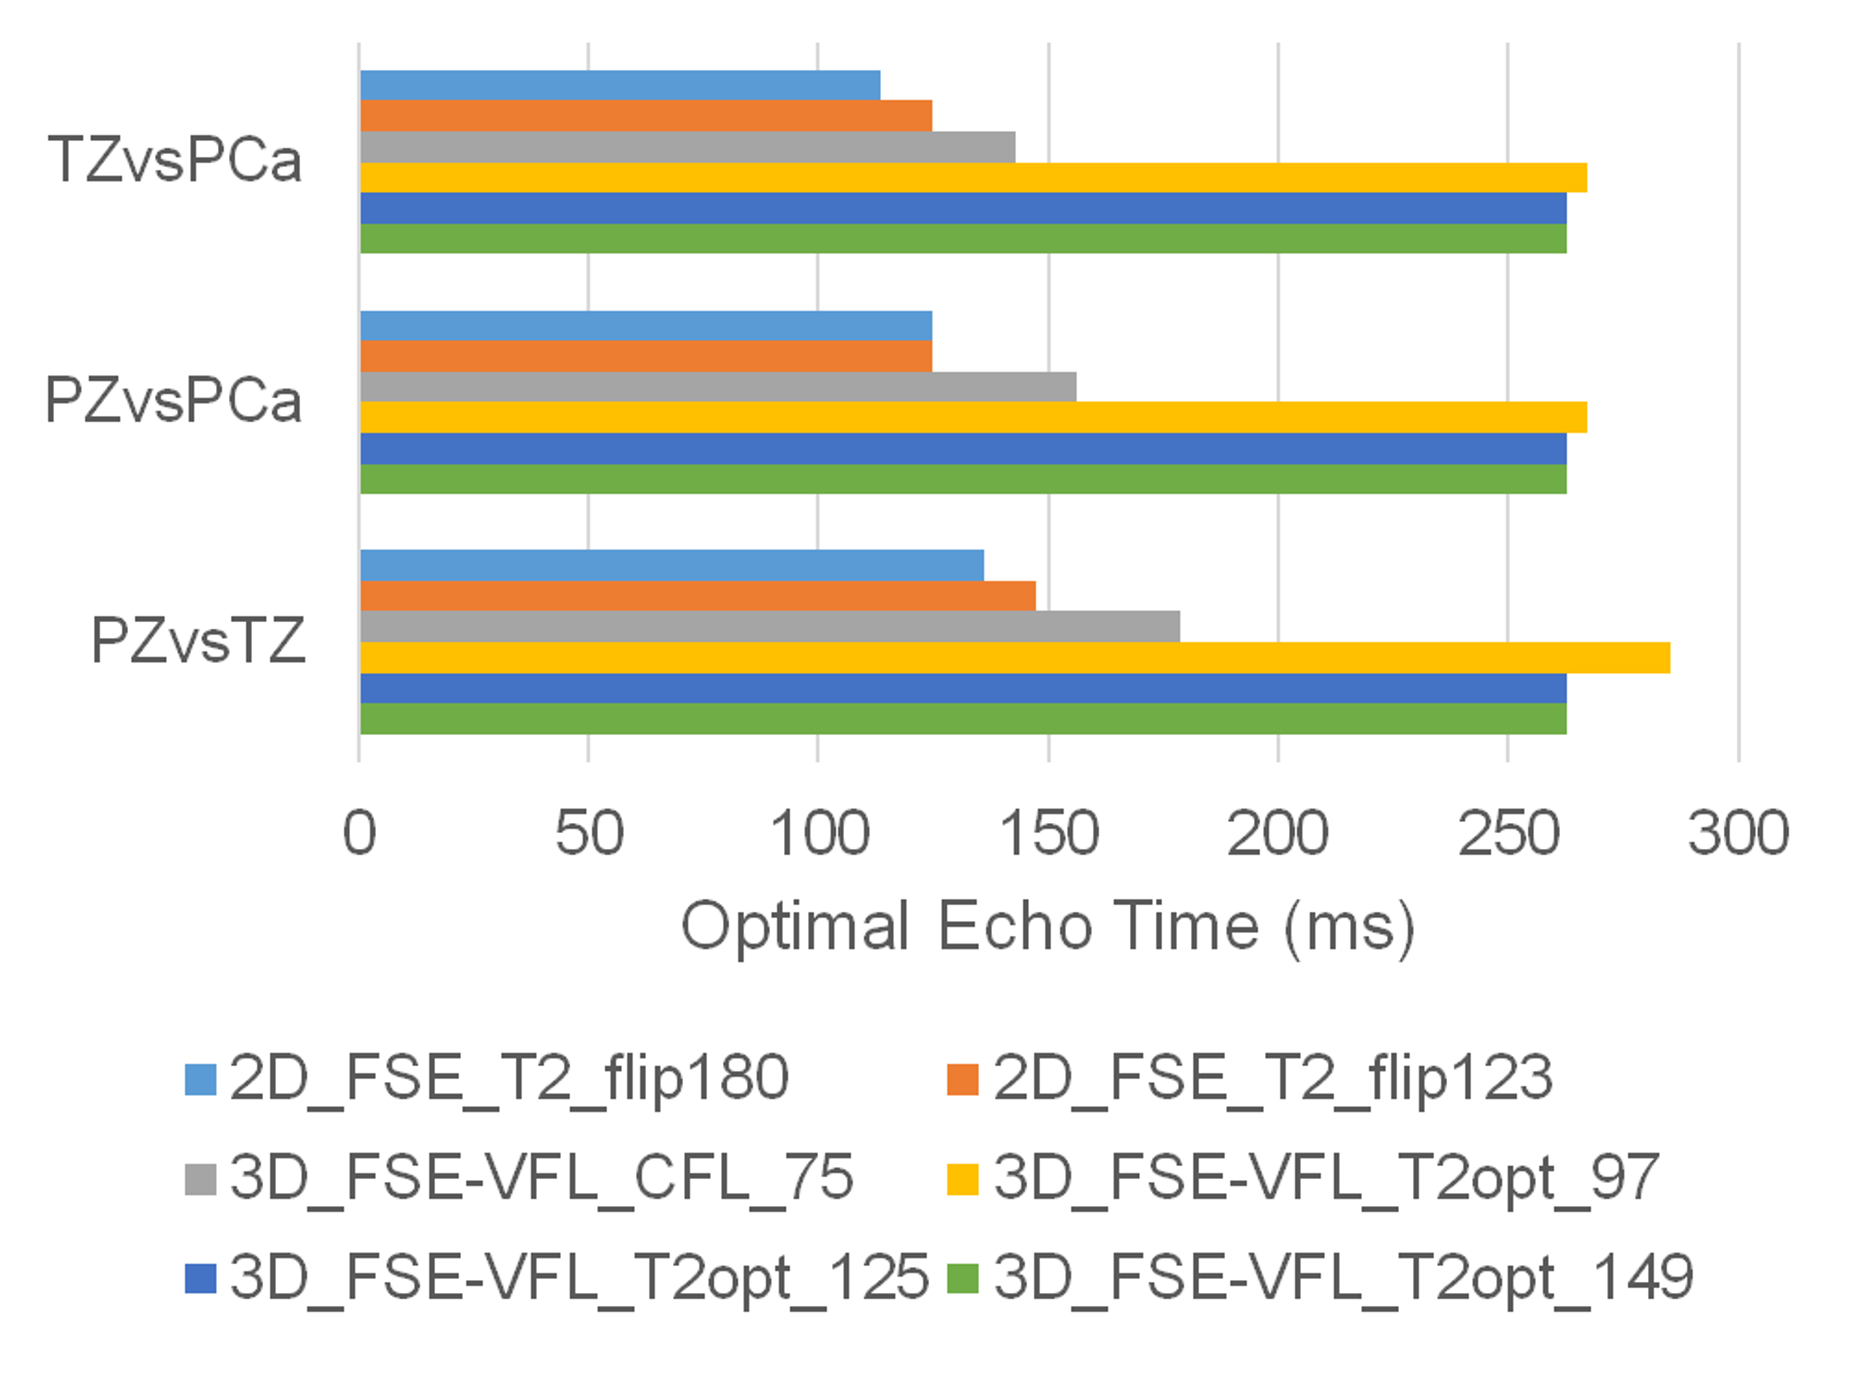
Figure 2 below shows the signal simulation graphs for each pulse sequence parameter set. (Note that this is a single TR after magnetization has reached a pseudo-steady-state.) Figure 3 shows the max signal contrast for each tissue type simulated. While 3D results showed worse contrast compared to 2D, the 3D optimized VFL trajectory for a T2 of 149 and 125 ms (PZ and TZ, respectively) showed improved results over the ramped constant flip angle approach (2,4) and T2 of 97 ms. The effective echo time to generate max signal contrast is shown in Figure 4 for each pulse sequence simulated.
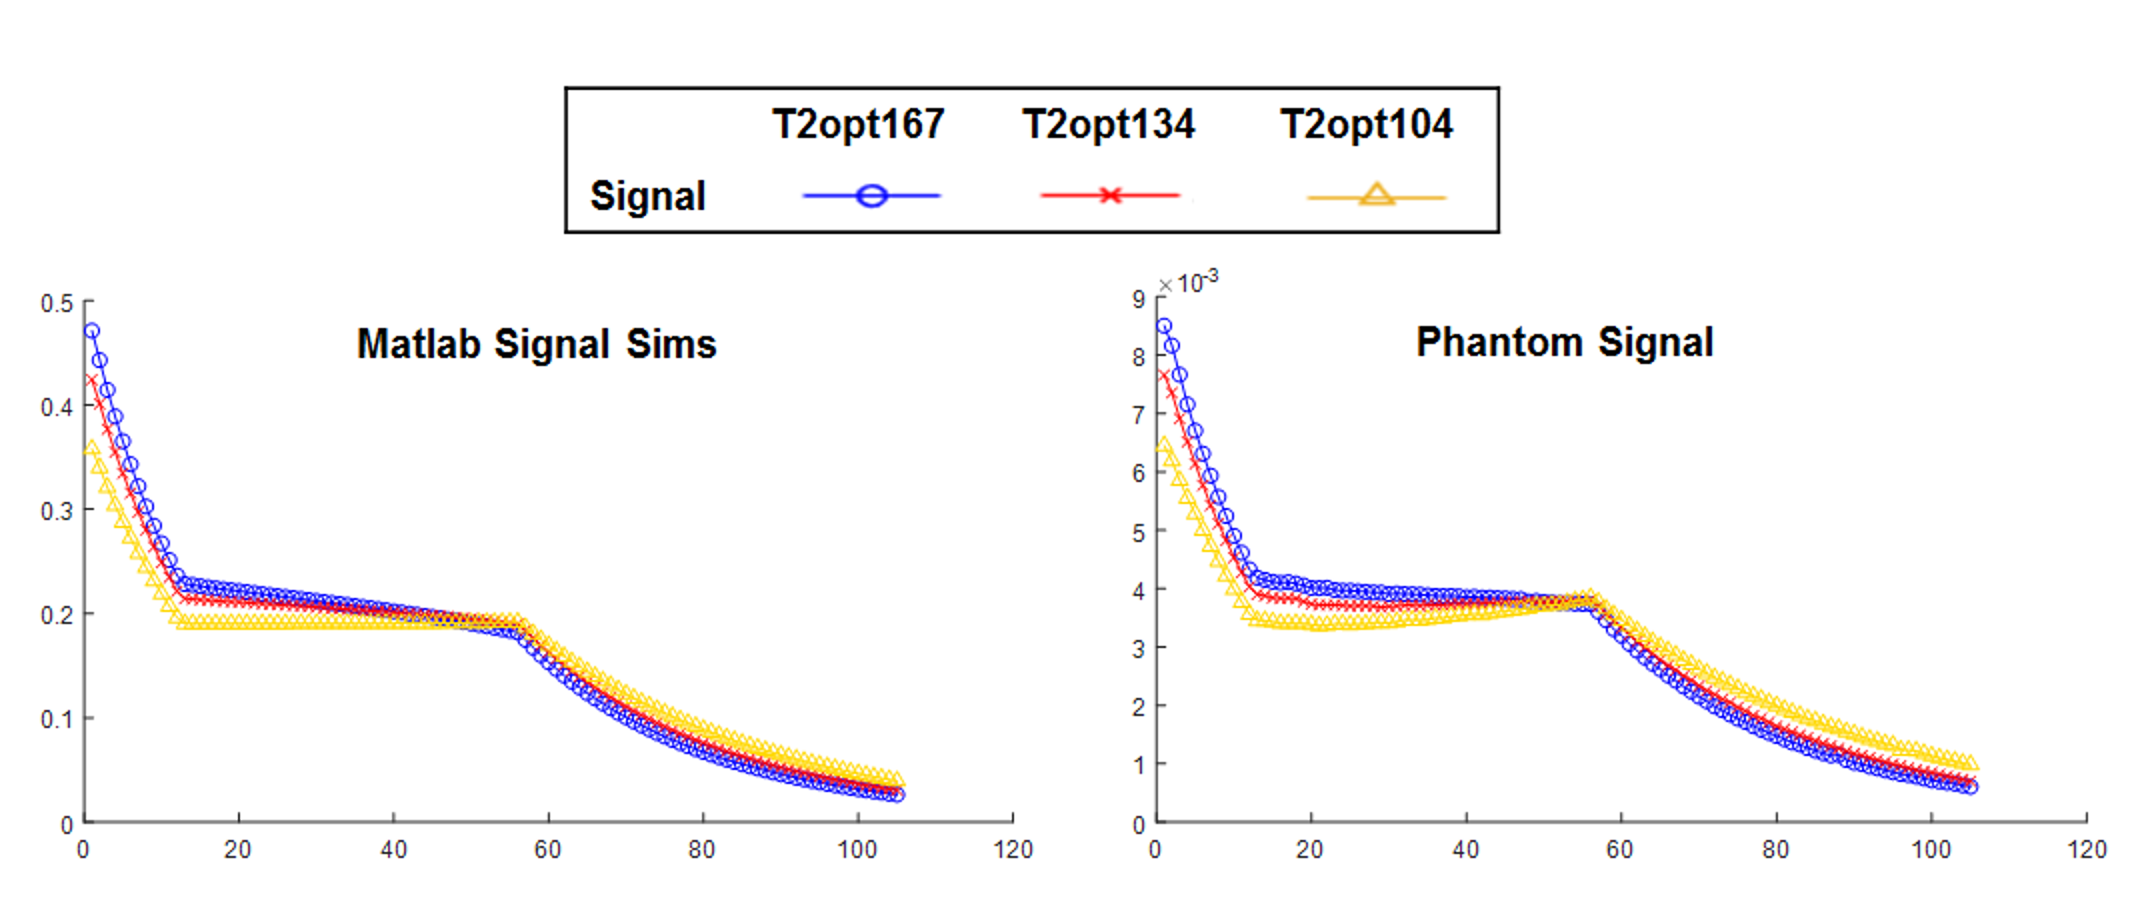
T1 and T2 mapping of gel phantoms showed that different values were created as compared to original targets (PZ: T1/T2=1022/167; TZ: T1/T2=1115/134; Tumor: T1/T2=1119/104). Matlab simulations were repeated with these values and then compared to FSE_VFL acquisitions done on the TZ phantom. Results are shown in Figure 5.
Conclusion
3D optimized VFL trajectory for a T2 of 149 and 125 ms (PZ and TZ, respectively) showed improved results over the ramped constant flip angle approach and a T2 of 97 ms. Effective echo times corresponding to max contrast were significantly longer than values reported in prior literature, indicating that simulations could optimize parameter values. Initial phantom experiments showed that signal simulations well represented real-world conditions. Overall, signal simulations have proven useful for analyzing different parameters and flip angle trajectories for T2-weighted sequences and can help design new flip angle trajectories and guide parameter choices.Acknowledgements
I would like to thank Drs. Mike Nishimura and Gina Scurti who graciously shared laboratory space, supplies, and helpful suggestions in constructing the phantoms. In addition, I would also like to thank Dr. Scott Mirowitz, chairman of Radiology, for providing funding for the chemicals needed for phantom construction.References
1. Weinreb JC, Barentsz JO, Choyke PL, et al. PI-RADS Prostate Imaging - Reporting and Data System: 2015, Version 2. Eur. Urol. 2016;69:16–40. doi: 10.1016/j.eururo.2015.08.052.
2. Rosenkrantz AB, Neil J, Kong X, Melamed J, Babb JS, Taneja SS, Taouli B. Prostate cancer: Comparison of 3D T2-weighted with conventional 2D T2-weighted imaging for image quality and tumor detection. Am. J. Roentgenol. 2010;194:446–452. doi: 10.2214/AJR.09.3217.
3. Cornud F, Rouanne M, Beuvon F, Eiss D, Flam T, Liberatore M, Zerbib M, Delongchamps NB. Endorectal 3D T2-weighted 1mm-slice thickness MRI for prostate cancer staging at 1.5Tesla: Should we reconsider the indirects signs of extracapsular extension according to the D’Amico tumor risk criteria? Eur. J. Radiol. 2012;81:e591–e597. doi: 10.1016/j.ejrad.2011.06.056.
4. Dianat SS, Rancier Ruiz RM, Bonekamp D, Carter HB, Macura KJ. Prostate volumetric assessment by magnetic resonance imaging and transrectal ultrasound: impact of variation in calculated prostate-specific antigen density on patient eligibility for active surveillance program. J. Comput. Assist. Tomogr. 2013;37:589–95. doi: 10.1097/RCT.0b013e318296af5f.
5. Westphalen AC, Noworolski SM, Harisinghani M, Jhaveri KS, Raman SS, Rosenkrantz AB, Wang ZJ, Zagoria RJ, Kurhanewicz J. High-resolution 3-T endorectal prostate MRI: A multireader study of radiologist preference and perceived interpretive quality of 2D and 3D T2-weighted fast spin-echo MR images. Am. J. Roentgenol. 2016;206:86–91. doi: 10.2214/AJR.14.14065.
6. Fennessy FM, Fedorov A, Gupta SN, Schmidt EJ, Tempany CM, Mulkern R V. Practical considerations in T1 mapping of prostate for dynamic contrast enhancement pharmacokinetic analyses. Magn. Reson. Imaging 2012;30:1224–1233. doi: 10.1016/j.mri.2012.06.011.
7. Simpkin CJ, Morgan VA, Giles SL, Riches SF, Parker C, DeSouza NM. Relationship between T2relaxation and apparent diffusion coefficient in malignant and non-malignant prostate regions and the effect of peripheral zone fractional volume. Br. J. Radiol. 2013;86:1–10. doi: 10.1259/bjr.20120469.
8. Srinivasan S, Wu HH, Sung K, Margolis DJA, Ennis DB. Fast 3D T2-weighted imaging using variable flip angle transition into driven equilibrium (3D T2-TIDE) balanced SSFP for prostate imaging at 3T. Magn. Reson. Med. 2015;74:442–451. doi: 10.1002/mrm.25430.
9. Mugler JP, Brookeman JR. Efficient Spatially-Selective Single-Slab 3D Turbo-Spin-Echo Imaging. In: International Society of Magnetic Resonance in Medicine Annual Meeting. ; 2004. p. 695.
10. Hattori K, Ikemoto Y, Takao W, Ohno S, Harimoto T, Kanazawa S, Oita M, Shibuya K, Kuroda M, Kato H. Development of MRI phantom equivalent to human tissues for 3.0-T MRI. Med. Phys. 2013;40:032303. doi: 10.1118/1.4790023.
Figures