1615
Application of hierarchical clustering to multi-parametric MR in prostate: Differentiation of tumor and normal tissue with high accuracy1Philips Japan, Tokyo, Japan, 2Department of Radiology, Kobe University Graduate School of Medicine, Hyogo, Japan, 3Department of Radiology, Kobe University Hospital, Hyogo, Japan, 4Asia Pacific, Philips Japan, Tokyo, Japan
Synopsis
Recently, machine learning (ML) or deep learning (DL) techniques has gain more attention for prostate cancer (PCa) detection. However, DL is often described as “black boxes” and difficult to explain results. In this study, hierarchical clustering (HC),an unsupervised ML technique, was applied to multi-parametric MR to differentiate PCa. DWI (IVIM and DKI) and permeability parameters were used for HC. Comparison of HC methods was conducted. We demonstrated that HC can accurately differentiate PCa and normal tissue (PZ: 97.5%, TZ: 95.7%), with an comparable to state-of-the-art D and K. Contrary to DL, HC produces results that can be interpreted (heatmaps).
INTRODUCTION
Diffusion-weighted image (DWI) and dynamic contrast-enhanced magnetic resonance image (DCE-MRI) have been studied for prostate cancer (PCa) detection.1 Recently, machine learning (ML) or deep learning (DL) techniques have gained more attention for PCa detection.2-3 However, it is difficult for DL to explain reasons for obtained results and therefore DL has often been described as ‘black boxes’.4 Since its algorithm optimizes enormous number of “weights” in multiple layers, it is difficult for human to directly understand the mechanism. Moreover, thousands of training datasets and annotation process are required. On the contrary, hierarchical clustering (HC), an unsupervised ML technique, is an exploratory statistical technique used for identifying groups based on similarity between obtained data.5 Different from DL techniques, HC results can be interpreted since its algorithm is explicit and relationship between input and output can be visualized in a heat map. Moreover, HC can be used with a relatively small dataset. HC has been mainly studied for gene expression analysis and connectivity analysis in fMRI.6-7 However, HC is rarely applied to multi-parametric MR. The aim of this study is to investigate whether HC can differentiate PCa and normal tissue using multi-parametric MR data.METHODS
Subject and equipment: The retrospective study was approved by hospital review board and informed consent was waived. Fifty-three patients with biopsy-proven PCa underwent preoperative MRI using a 3.0-T MR scanner (Achieva, Philips) between September 2012 and December 2013.
DWI and DCE-MRI: T2W, DWI, and DCE-MRI were obtained.8 Sequence parameters are summarized (Table 1A). Intravoxel incoherent motion (IVIM), diffusion kurtosis imaging (DKI), and permeability analyses were conducted. The regions-of-interest (ROIs) were placed on all 40 tumors and normal tissue in peripheral zone (PZ) and on all 23 tumors and normal tissue in transition zone (TZ), based on histopathology specimen. IVIM parameters (D, D*, F, and SNR), DKI (K), and permeability parameters (Ktrans, Kep, and Ve), and respective models are summarized (Table. 1B). Mean within ROI was calculated for each parameter.
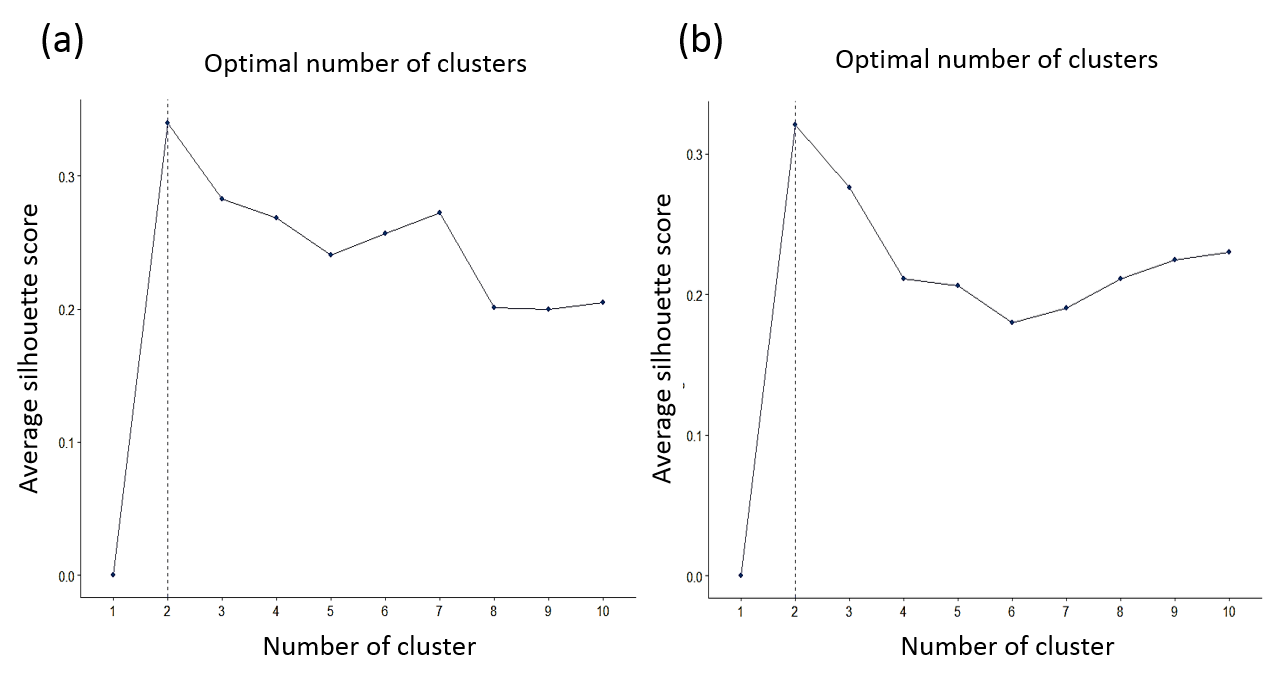
HC for multi-parametric MR: The HC algorithm consists of two parts: dissimilarity calculating the distance between observed pairs and linkage merging similar data into clusters.5 In each part, there are several methods. Therefore, comparison of HC was performed by changing combination of dissimilarity (Euclidean and Manhattan distance) and linkage methods (ward.D2, complete, and average linkage) using R software (v3.5.1). The input data were aforementioned parameters for 40 tumors and normal data in PZ and 23 tumors and normal data in TZ. The cluster height was assessed as marker for separation capability, together with the number of outlier for robustness, the top 2 total within sum-of-squares for compactness,11 and the accuracy. Accuracy was calculated as 100* (TP+TN / TP+TN+FP+FN), where TP/TN/FP/FN stands for True/False Positive/Negative. Clusters at top 2 height were assigned to tumor or normal tissue cluster. Majority in a cluster decides which is tumor or normal cluster. The optimal number of clusters was calculated by silhouette method.12
Statistical analysis: For analysis of each DWI and permeability parameter between tumor and normal cluster, a paired t-test was used. A P- value less than 0.05 was considered significant.
RESULTS
Comparison of HC for multi-parametric MR is shown (Table. 2). Optimal number of clusters was two, indicating HC was appropriate for separating tumor and normal tissue for PZ and TZ (Fig. 1). Accuracy for differentiating tumor and normal tissue in PZ for method #4 was highest (97.5%). Accuracy and cluster height in TZ for method #5 was highest (95.7% and 22).
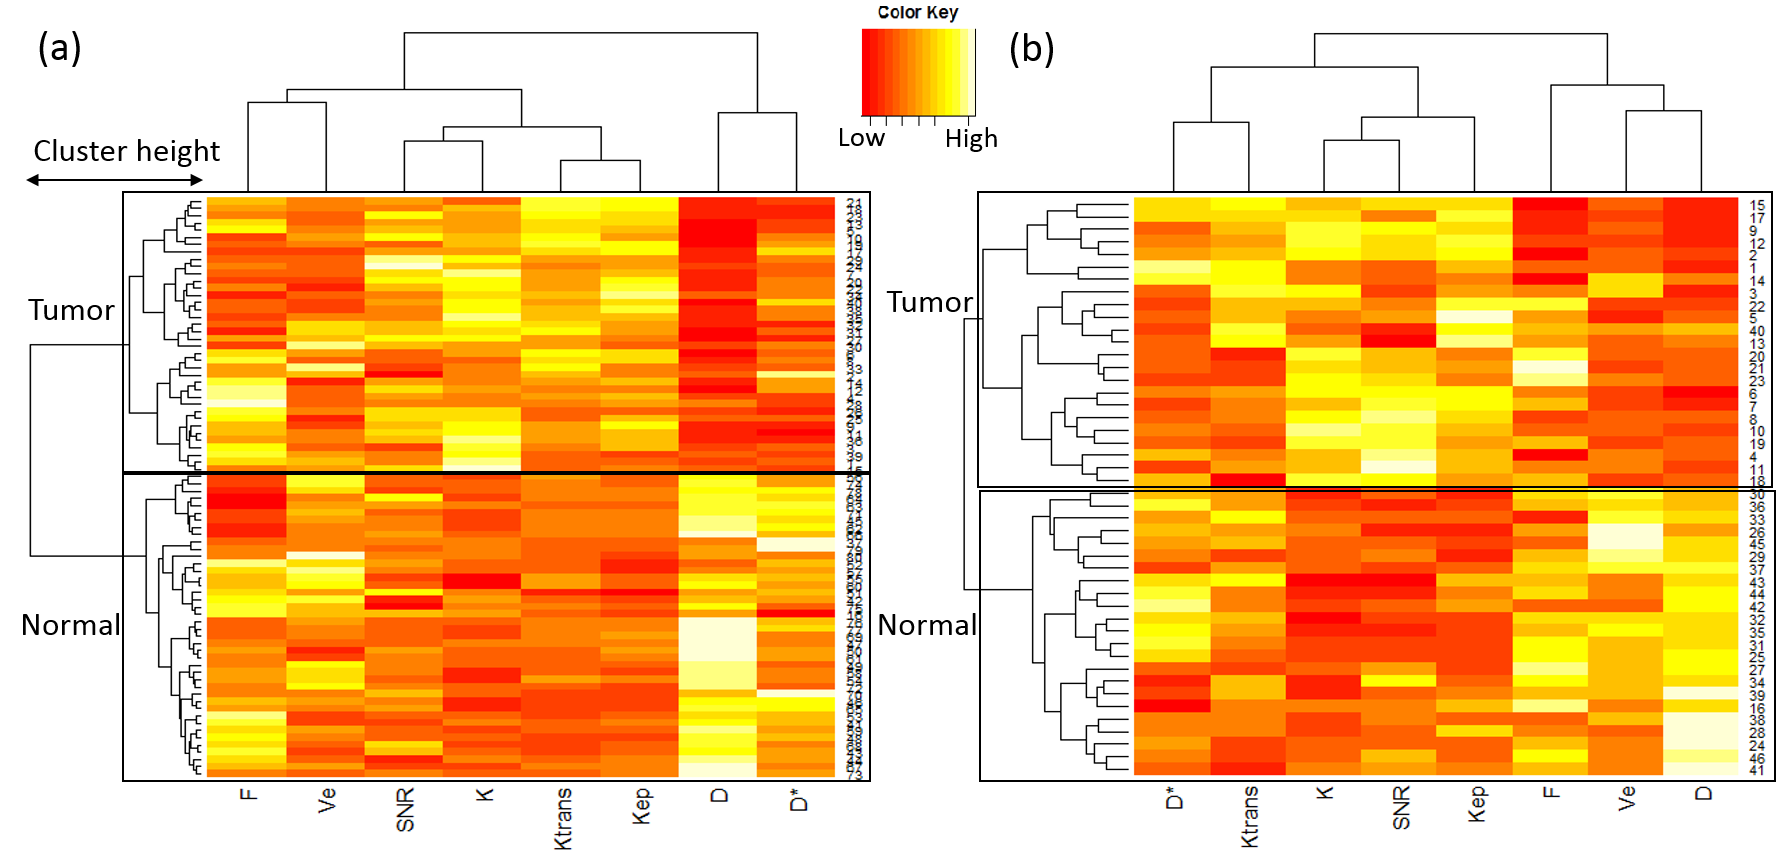
Summary of HC in PZ for method #4 and in TZ for method #5 is shown (Table. 3). Tumor cluster in PZ showed significant lower D and D* value and higher SNR, F, K, Ktrans, and Kep value than normal cluster. Tumor cluster in TZ showed significant lower D and Ve value and higher SNR, K, and Kep value than normal cluster. These results were consistent with previous reports.13-17 Accuracy for HC was comparable to state-of-the-art parameters of D and K (PZ: 97.5% for HC vs 98.8% for D and K, TZ: 95.7% for HC vs 97.8% for D and 95.7% for K). The heat maps showed relationship between input (DWI and permeability parameters) and output (tumor and normal cluster) (Fig. 2).
CONCLUSION
We have demonstrated the feasibility of using unsupervised HC on multi-parametric MR data for PCa. The results indicate that HC can accurately differentiate PCa and normal tissue, with an comparable to state-of-the-art D and K. Contrary to DL techniques, HC is an ML technique producing results that can be interpreted (heat maps) and can be used with relatively small datasets.Acknowledgements
No acknowledgement found.References
1. Rooij M et al. Accuracy of multiparametric MRI for prostate cancer detection : A meta-analysis. Am J Roentgenol. 2014 ;202 :343-351
2. Shah V et al. Decision support system for localizing prostate cancer based on multiparametric magnetic resonance imaging. Med Phys. 2012;39:4093-4103
3. Wang X et al. Searching for prostate cancer by fully automated magnetic resonance imaging classification: Deep learning versus non-deep learning. Sci Rep. 2017;7 :15415
4. Litjens G et al. A survey on deep learning in medical image analysis. Med. Image Anal. 2017;42:60-88
5. Murtagh F and Contreras P. Algorithms for hierarchical clustering: An overviwe. WIREs Data Mining Knowl Discov 2012;2:86-97
6. Sorlie T et al. Gene expression patterns of breast carcinomas distinguish tumor subclasses with clinical implications. PNAS. 2001;98:10869-10874
7. Cordes D et al. Hiererchical clustering to measure connectivity in fMRI resting-state data. MRI. 2002;20:305-314.
8. Ueda Y et al. Triexponential function analysis of diffusion-weighted MRI for diagnosing prostate cancer. JMRI. 2016;43:138-146
9. Le Bihan D et al. Separation of diffusion and perfusion in intravoxel incoherent motion MR imaging. Radiology. 1988;168:497-505
10. Tofts P et al. Estimating kinetic parameters from dynamic contrast-enhanced T1-weighted MRI of a diffusable tracer: Standardized quantities and symbols. JRMI.1999;10:223-232
11. Liu Y et al. Understanding of internal clustering validation measures. Proc. IEEE Int. Conf. Data Mining. 2010;911-916
12. Rousseeuw P. Silhouettes: A graphical aid to the interpretation and validation of cluster analysis. J. Comput. Appl. Math. 1987;20:53-65
13. Jambor I et al. Evaluation of different mathematical models for diffusion-weighted imaging of normal prostate and prostate cancer using high b-values: A Repeatability Study. MRM. 2015;73:1988-1998
14. Liu X et al. Biexponential apparent diffusion coefficients values in the prostate: Comparison among normal tissue, prostate cancer, benign prostatic hyperplasia and prostatitis. Korean J Radiol. 2013;14:222-232
15. Bao J et al. Differentiation of prostate cancer lesions in the transition zone by diffusion-weighted MRI. Eur J Radiol Open. 2017;4:123-128
16. Kozlowski P et al. Combined diffusion-weighted and dynamic contrast-enhanced MRI for prostate cancer diagnosis-correlation with biopsy and histopathology. JMRI.2006;24:108-113
17. Beyhan M et al. The evaluation of prostate lesions with IVIM DWI and MR perfusion parameters at 3T MRI. Radiol. Med. 2018;1:1-7
Figures