1614
Object Recognition for Fully Automated Reference Tissue Normalization of T2-weighted MR Images of the Prostate1Department of Circulation and Medical Imaging, NTNU, Norwegian University of Science and Technology, Trondheim, Norway, 2Department of Radiology and Nuclear Medicine, St. Olavs Hospital, Trondheim University Hospital, Trondheim, Norway
Synopsis
T2-weighted MRI, an integrated part of multi-parametric MRI for prostate cancer diagnostics, is indispensable for qualitative evaluation of prostate anomalies. For quantitative assessment, however, normalization is necessary for comparison within and between patients. In this study, we developed and validated a fully automated object recognition method for multi-reference tissue normalization. The performance of the method was superior to existing fully automated normalization strategies, and the resulting pseudo T2 values were close to true T2 values from literature. The developed multi-reference tissue normalization method may thus improve the reproducibility and diagnostic performance of T2-weighted image features in future quantitative applications.
INTRODUCTION
T2-weighted MR imaging is an important pillar of the multi-parametric MRI protocol for diagnosis of prostate cancer.1 In comparison to diffusion-weighted and dynamic contrast enhanced MR images, T2-weighted images have high resolution and provide superior anatomical details, which makes them indispensable for qualitative evaluation of prostate anomalies. For quantitative assessment of prostate cancer, however, T2-weighted images are less suited because the intensities vary with field strength, coil type, signal amplification and acquisition settings. Intensity normalization is thus required to enable comparison of T2-weighted images within and between patients. The use of multiple reference tissues for scaling of the image intensities seems to be promising, 2 but automated methods for the extraction of the reference tissue signals are currently lacking. The purpose of this work was therefore to develop a fully automated object recognition method for multi-reference tissue normalization of T2-weighted MR images of the prostate.METHODS
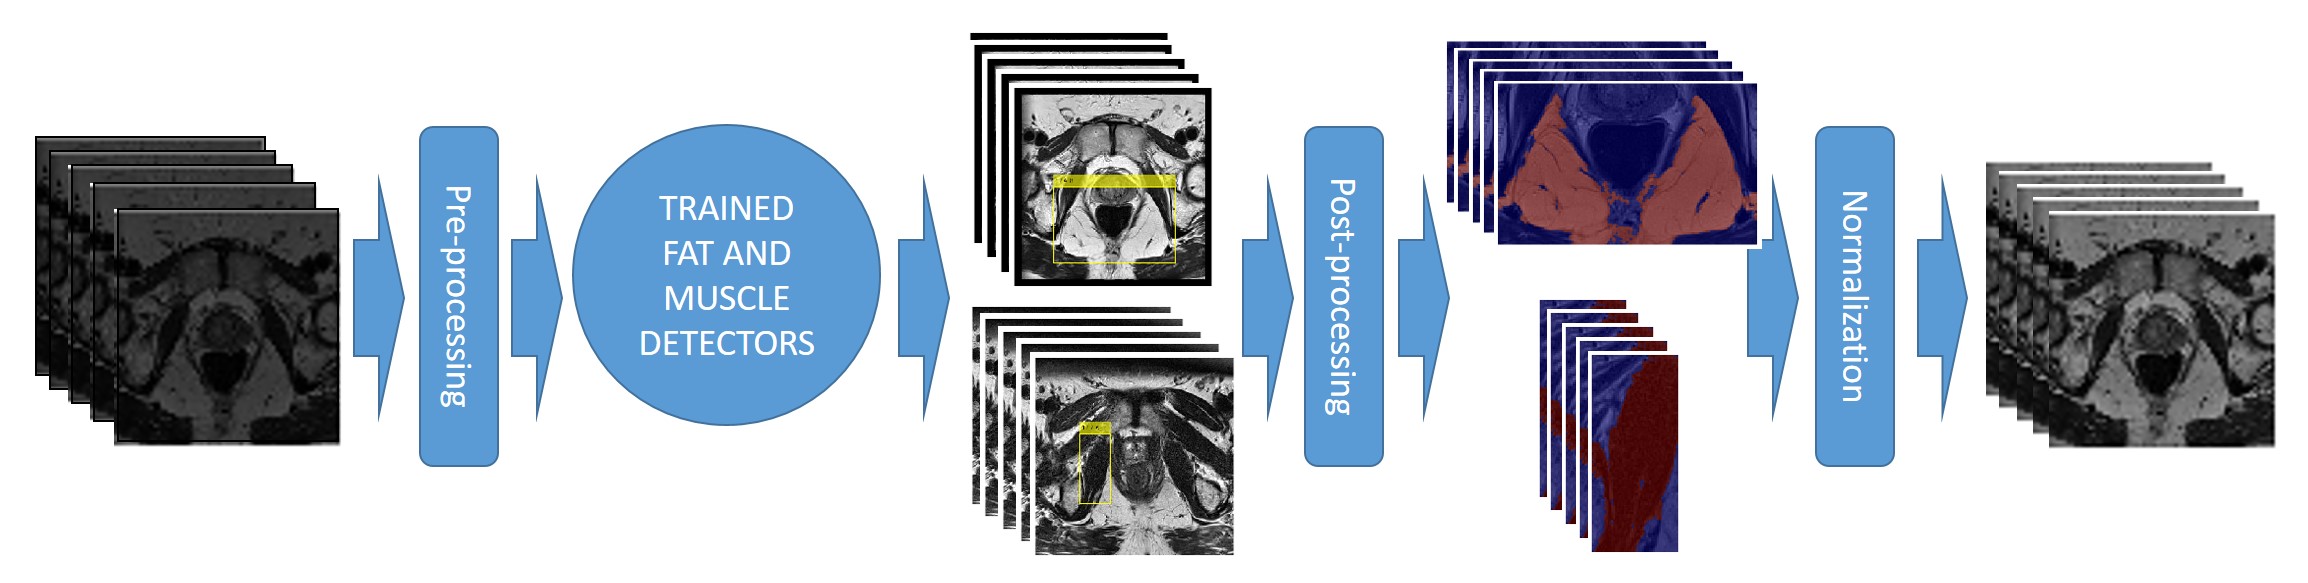
Figure 1 gives an overview of the proposed method, which was trained (N=40), tested (N=20) and validated (N=20) using the images and prostate segmentations from the PROMISE12 grand challenge multi-center / multi-vendor dataset (N=80).3 Briefly, two separate aggregate channel features (ACF) object detectors 4 were trained to detect rectangular regions-of-interest containing fat and muscle, respectively, in the 2D T2-weighted MR slices. Fat and muscle regions-of-interest were then obtained as the largest connected bright and dark structures in the detected rectangle, respectively, using Otsu thresholding, 5 and fat and muscle intensity values (Ifat and Imuscle, respectively) were calculated. Subsequently, the 3D image intensities I(x,y,z) were normalized to pseudo T2 values pT2(x,y,z) by linearly scaling Ifat and Imuscle to their respective T2 values at 3T from literature (T2fat = 121 ms and T2muscle = 40 ms), 6 using $$$pT2(x,y,z) = (T2^{fat} – T2^{muscle}) / (I^{fat} – I^{muscle}) * (I(x,y,z) – I^{muscle}) + T2^{muscle}$$$.
The training and test datasets were used to train the object detectors and to find the pre- and post-processing settings that resulted in the best performance, defined as the lowest between-patient standard deviation of mean prostate intensities in the test set. The trained detectors and optimal parameter settings were subsequently applied to the validation set. The performance of the proposed method (autoref) was measured as the mean histogram intersection of each patient with all other patients in the validation set (prostate only). Paired t-tests were used to assess differences between the proposed method, the original dataset (orig), and three other automated normalization methods: histogram stretching (stretch), z-score normalization (z-score), and histogram equalization (equal).7 The resulting pseudo T2 values of prostate tissue were compared to T2 values found in literature.6 The algorithm was implemented in MATLAB 2017b (The Mathworks, Nattick, MA).
RESULTS
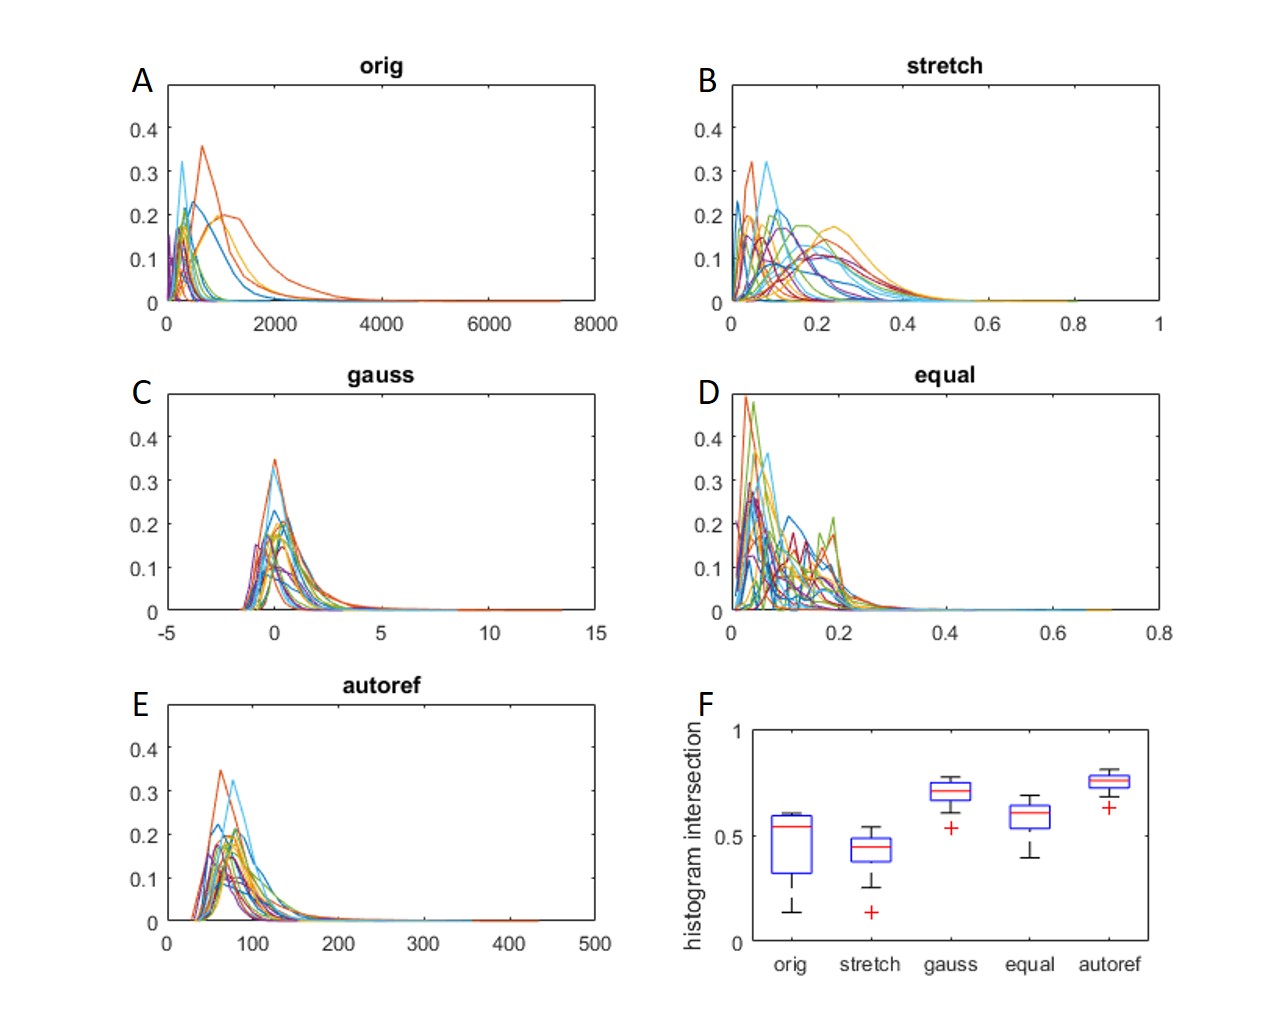
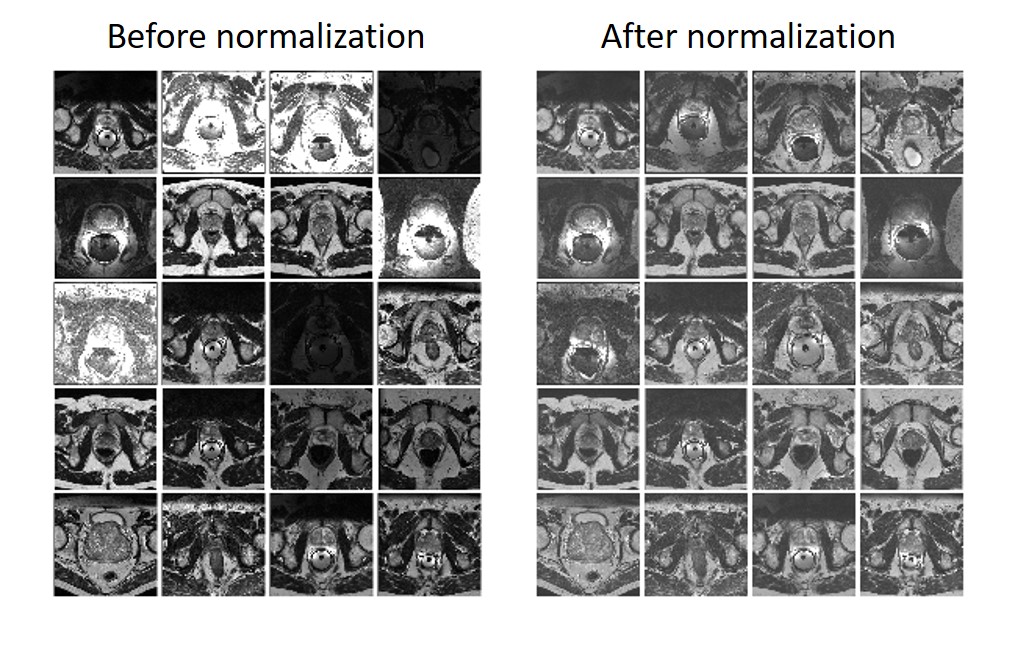
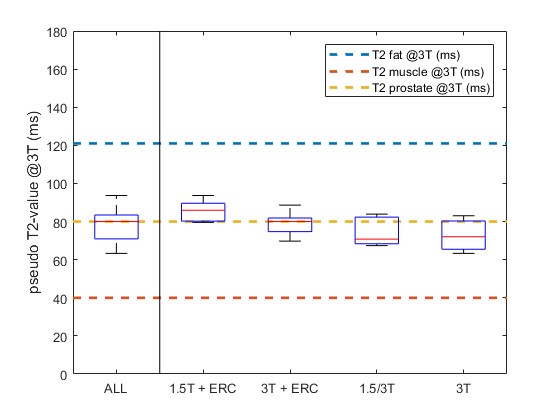
Figure 2 gives an overview of the prostate intensity histograms of the validation dataset (A-E) and the corresponding histogram intersections (F). The histogram intersections of the proposed method were significantly higher (p < 0.001) than those of the original dataset and other normalization methods. Figure 3 shows that the image intensities are comparable between patients after normalization. Moreover, all prostate pseudo T2 values are close to the literature T2 value (80 ms), despite substantial differences in field strength, coil type, and other acquisition parameters between patients (Figure 4).DISCUSSION
The proposed image normalization method successfully reduced the non-biological between-patient variation in T2-weighted intensities, which could facilitate the extraction and application of meaningful intensity-based features for quantitative assessment of prostate cancer, e.g. in a radiomics setting.8 Stoilescu et al. found that multi-reference tissue normalization of T2-weighted prostate images indeed significantly improves the diagnostic accuracy, but their method was based on manually delineated regions-of-interest so far.2 The ACF detector used in this work is a classical machine learning approach that accurately detected fat and muscle regions, despite the small training dataset.
An advantage of our method to e.g. z-score normalization is that the image intensities could be correctly mapped to literature T2 values. These pseudo T2 values could be an interesting alternative to quantitative T2 mapping given the limited scan time in clinical practice.9 Unfortunately, quantitative T2 maps were not available for direct comparison in this work. Whether our normalization method can improve the reproducibility and diagnostic performance of T2-weighted image features extracted from prostate cancer regions-of-interest remains part of future research.
CONCLUSION
We successfully developed a fully automated object recognition method for multi-reference tissue normalization of T2-weighted MR images of the prostate. The method was able to map relative T2-weighted image intensities to pseudo T2 values, irrespective of original field strength, coil type, or acquisition method, which could help the quantitative assessment of prostate cancer.Acknowledgements
N/AReferences
1. Weinreb JC, Barentsz JO, Choyke PL, et al. PI-RADS Prostate Imaging - Reporting and Data System: 2015, Version 2. Eur Urol. 2016;69(1):16-40
2. Stoilescu L, Maas MC, Huisman HJ. Feasibility of multireference tissue normalization of T2-weighted prostate MRI. ESMRMB Annual Scientific Meeting, Barcelona, 2017
3. Litjens G, Toth R, van de Ven W, et al. Evaluation of prostate segmentation algorithms for MRI: the PROMISE12 challenge. Med Image Anal. 2014;18(2):359-73
4. Dollar P, Appel R, Belongie S, et al. Fast Feature Pyramids for Object Detection. IEEE Trans Pattern Anal Mach Intelle. 2014;36(8):1532-45
5. Otsu N. A threshold selection method from gray-level histograms. IEEE Trans Sys Man Cyber. 1979;9(1):62–66.
6. Bojorquez JZ, Bricq S, Brunotte F, et al. A novel alternative to classify tissues from T 1 and T 2 relaxation times for prostate MRI. MAGMA. 2016 Oct;29(5):777-88
7. Loizou CP, Pantziaris M, Seimenis I, et al. Brain MR image normalization in texture analysis of multiple sclerosis. 9th International Conference on Information Technology and Applications in Biomedicine, Larnaca, 2009
8. Stoyanova R, Takhar M, Tschudi Y, et al. Prostate cancer radiomics and the promise of radiogenomics. Transl Cancer Res. 2016;5(4):432-447
9. Wu LM, Chen XX, Xuan HQ, et al. Feasibility and preliminary experience of quantitative T2* mapping at 3.0 T for detection and assessment of aggressiveness of prostate cancer. Acad Radiol. 2014;21(8):1020-6.
Figures