1612
A Fully Automatic Blind Estimation of Tumor Microvascular Permeability using Embedded Unsupervised Regularizations based on Prostate DCE-MRI1Peking University, Beijing, China, 2Peking University First Hospital, Beijing, China
Synopsis
Vascular permeability can reflect tumorigenesis and metastasis. Previous dynamic contrast-enhanced magnetic resonance
Introduction
The dynamic contrast-enhanced magnetic resonance imaging (DCE-MRI) combined with pharmacokinetic models to quantitate the vascular permeability has been studied in prostate and the bone metastasis regions [1,2]. However, the subjective selection of the arterial input function (AIF) or reference regions (RR) reduced the robustness of the estimation. Multichannel blind identification has been studied in obtaining pharmacokinetic parameters from DCE-MRI without AIF in recent years [3], but the construction of the multichannel blind model in previous studies had ignored the different shapes of tissue concentration (TC) curves at different physiological tissues, which would degenerate the multichannel equations into an ill-conditioned single regularization equation and result in unstable estimations. In this study, inspired by the clinical diagnostic experiences for examining bone metastasis from prostate cancer, we proposed a fully automatic strategy, termed as clustering-based four channels blind model (CBM) estimation, which could obtain three adaptive regularizations as constraint output channels by unsupervised machine learning method without previously provided AIF or RR.Methods
The DCE-MRI scans were performed on 21 prostate cancer patients with bone metastases aging 67±18. The pelvis dynamic images were acquired on a 1.5T MR scanner with TR=4.0 msec, TE=1.9 msec, Time Phase=15, Time Period=12 sec, Flip Angle = 14°, Slice Thickness=3.8mm, and the acquisition matrix was 512×512. All the pixels in the acquired DCE-MRI image series were firstly unsupervised clustered to four types (Figure 1). For the clustering strategy, we utilized the absolute value of the largest signal intensity difference during the perfusion of each pixel as the clustering feature. The four types of candidate pixels, in descending order according to the value of the clustering feature, could be considered as the artery, tumor, muscle, bone and background candidates. Then we selected the characteristic curve of three types of candidates, including artery, tumor, muscle, and excluded the bone and background candidate because those TC curves were close to zero. The characteristic curve selection of artery candidates referred to Rempp’s study[4] and considered the smoothness of TC curves. For the characteristic curve selection of tumor candidates and muscle candidates, we considered the area under the curve and the slope of the last 2/3 time phases in TC curves by linear fitting, referred to clinical diagnostic experiences. The obtained three characteristic curves could be regarded as three adaptive regularizations, and the TC curve of the pixel under test was set as the fourth output channel, and then the four channels blind model of CBM was constructed with the assumption that four blind channel curves were perfused by the same AIF. Finally, the IQML [5] method was adopted to estimate the pharmacokinetic parameters. The CBM estimations were examined with diagnostic results provided by an experienced radiologist and compared with the results of the widely used extended Tofts model (ETM) to evaluate the feasibility and robustness.Results
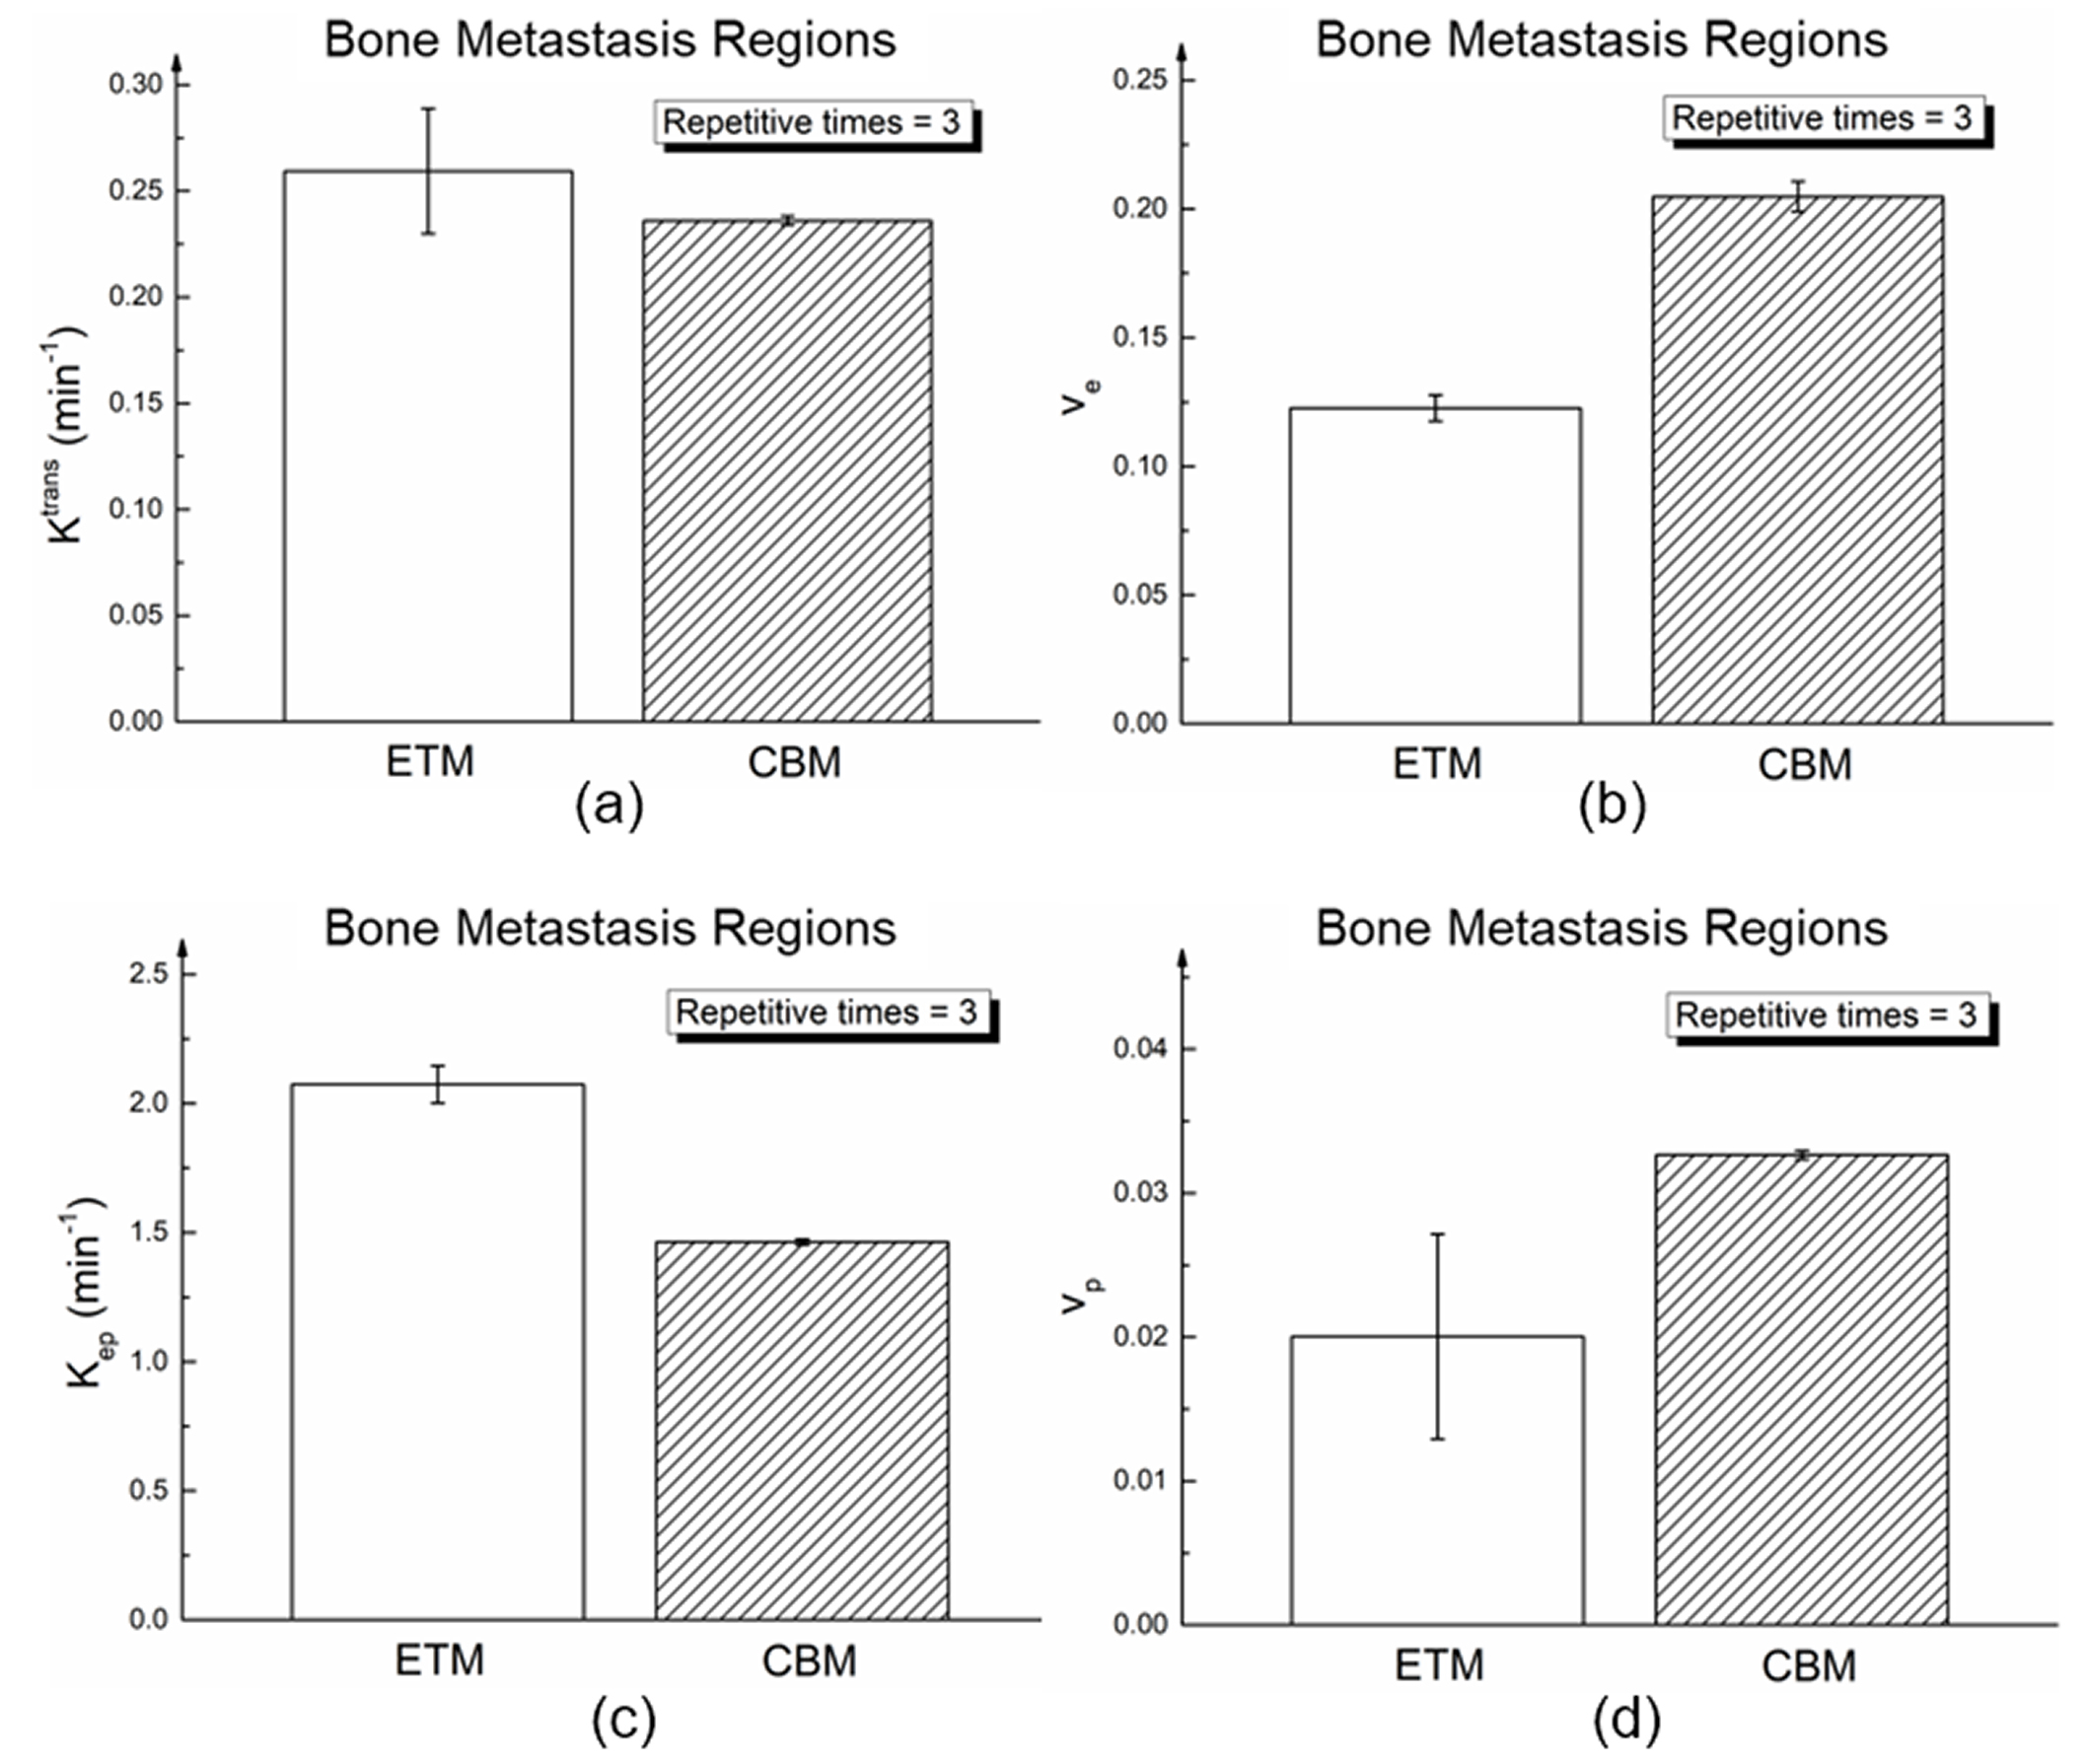
Three characteristic curves are corresponding to the clinical judgment of “fast enhancement and quick wash-out”, “quick enhancement followed by a plateau” and “slow enhancement” (Figure 2), which reflect the individual characteristic of artery, tumor, and muscle during the perfusion. Representative results of DWI scans, T2w scans, and estimation of CBM are shown in Figure 3. Figure 4 shows Ktrans, ve, and Kep in bone metastasis regions are significantly higher than that in normal bone regions (P<0.001, P<0.001, P<0.001). The robustness of the CBM was confirmed by comparing with conventional ETM approach, showing that the standard deviation of Ktrans, Kep and vp obtained after repetitive estimations using CBM (σKtrans=0.002, σKep=0.01, σvp=0.0002, respectively) were much less than that using ETM (σKtrans=0.03, σKep=0.07, σvp=0.007, respectively, Figure 5).Discussion
The constructed three output channels had independent parameter sets in the physiological sense, corresponding to the artery, tumor, and muscle tissue. The multichannel equations in CBM will not degenerate into an ill-conditioned equation owing to these three regularization constraints. In the CBM, any two output channels would be equivalent to the RR model, which meant that the RR model could be regarded as a particular case of the proposed CBM. Radiologists only need to select the tumor layers and ROI, and then the parameters can be directly estimated without manual selection of AIF or RR, which is reasonable to improve the robustness of the parameter estimation.Conclusion
A clustering-based four channels blind model with three adaptive regularizations as constraints was presented to fully automatically estimate pharmacokinetic parameters of prostate cancer patients with bone metastases. It provides a potentially valuable tool for robust estimation of vascular permeability, detection of tumor metastasis and treatment evaluation using DCE-MRI.Acknowledgements
No acknowledgement found.References
[1] Alonziabcd R. Dynamic contrast enhanced MRI in prostate cancer[J]. European Journal of Radiology, 2007, 63(3):335.
[2] Kayhan A, Yang C, Soylu F N, et al. Dynamic contrast-enhanced MR imaging findings of bone metastasis in patients with prostate cancer[J]. World Journal of Radiology, 2011, 3(10):241.
[3] Riabkov D Y, Di B E. Blind identification of the kinetic parameters in three-compartment models[J]. Physics in Medicine & Biology, 2004, 49(5):639.
[4] Rempp K A, Brix G, Wenz F, et al. Quantification of regional cerebral blood flow and volume with dynamic susceptibility contrast-enhanced MR imaging[J]. Radiology, 1994, 193(3): 637-641.
[5] Riabkov D Y, Di B E. Estimation of kinetic parameters without input functions: analysis of three methods for multichannel blind identification.[J]. Biomedical Engineering IEEE Transactions on, 2002, 49(11):1318.
Figures