1609
The Use of Relaxation Maps from Synthetic MRI in Differential Diagnosis of Prostate Cancer1Department of Radiology, Beijing Hospital, National Center of Gerontology, Beijing, China, 2Graduate School of Peking Union Medical College, Beijing, China, 3GE Healthcare, Beijing, China
Synopsis
Synthetic MRI enables absolute quantification of T1, T2 and (proton density) PD value. The aim of the study was to primarily evaluate the feasibility of synthetic MRI in differential diagnosis of (prostate cancer) PCa. We analyzed 18 PCa lesions in 14 PCa patients, 26 SH (stromal hyperplasia), 25 GH (glandular hyperplasia) nodules and 21 prostatitis areas in 22 non-PCa patients who underwent multi-parameter MRI before needle biopsy. T1WI, T2WI, DWI and MAGiC (magnetic resonance image compilation) sequences were acquired respectively. Our results showed the T1 and T2 value of PCa lesion was significantly lower than GH nodule and prostatitis area. The PD value of PCa lesion was significantly lower than GH nodule. We concluded that synthetic MRI was helpful for differential diagnosis of PCa.
Introduction
Prostate cancer (PCa) is a common type of cancer among men, and multiple parameter MRI is commonly used for PCa diagnosis. However, the diagnosis of PCa, especially the differential diagnosis between PCa and benign prostate hyperplasia (BPH), still face practical challenges. Synthetic MRI is a novel imaging technique that offers conventional contrast weighted images and quantitative relaxation images simultaneously. The use of synthetic MRI for routine neuroimaging has been reported recently 1. However its application in prostate has rarely been reported and it is hypothesized that the relaxation maps may have potential for PCa diagnosis. This preliminary study investigates the use of relaxation maps from synthetic MRI for differential diagnosis of prostate cancer (PCa) with pathological confirmation.Methods and materials
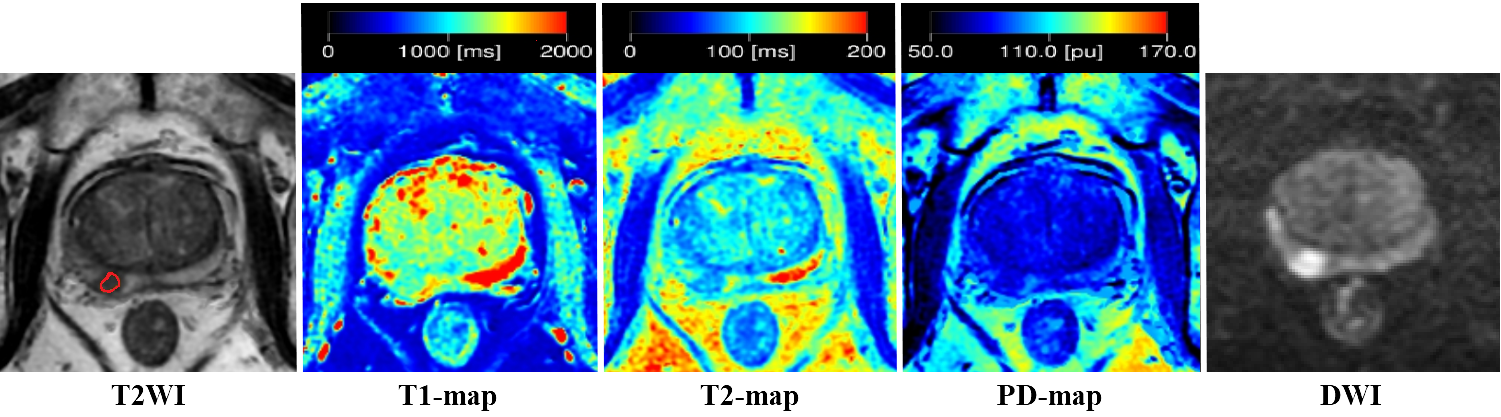
Institutional Review Board (IRB) was approved for this study. From April to October 2018, fifty-five consecutive patients suspected of PCa were enrolled in this study with prior consent forms. The exclusion criteria were: (1) no pathological results by needle biopsy after MR exam, (2) received hormone therapy before MR, (3) the diameter of proven PCa < 0.5cm, and (4) interval between MR examination and biopsy > 1 month. All patients underwent routine clinical examinations and synthetic MR (MAGnetic resonance imaging Compilation, MAGiC) on a 3.0T whole body system (Signa Pioneer, GE Healthcare) equipped with a 32-channel torso coil. MAGiC was performed with the following parameters: FOV 300mm*300mm, matrix 320*256, slice thickness/gap 4/1mm. Region of interest (ROI) based T1, T2 and PD measurements of the lesions were obtained with reference to T2WI (Figure 1). For PCa patients, ROI was placed on the PCa area. For non-PCa patients, ROI was placed on the benign prostate hyperplasia and prostatitis area. The area of stromal hyperplasia (SH) and prostatitis were defined as hypointensity on T2WI. The area of glandular hyperplasia (GH) was defined as hyperintensity on T2WI. Needle biopsy was used for pathological confirmation. Statistical analyses were performed using SPSS 20.0 (IBM Corp, NY, USA). T1, T2 and PD value of PCa, SH, GH and prostatitis were reported as mean ± SD and compared by one-way analysis of variance (ANOVA) test.
Results
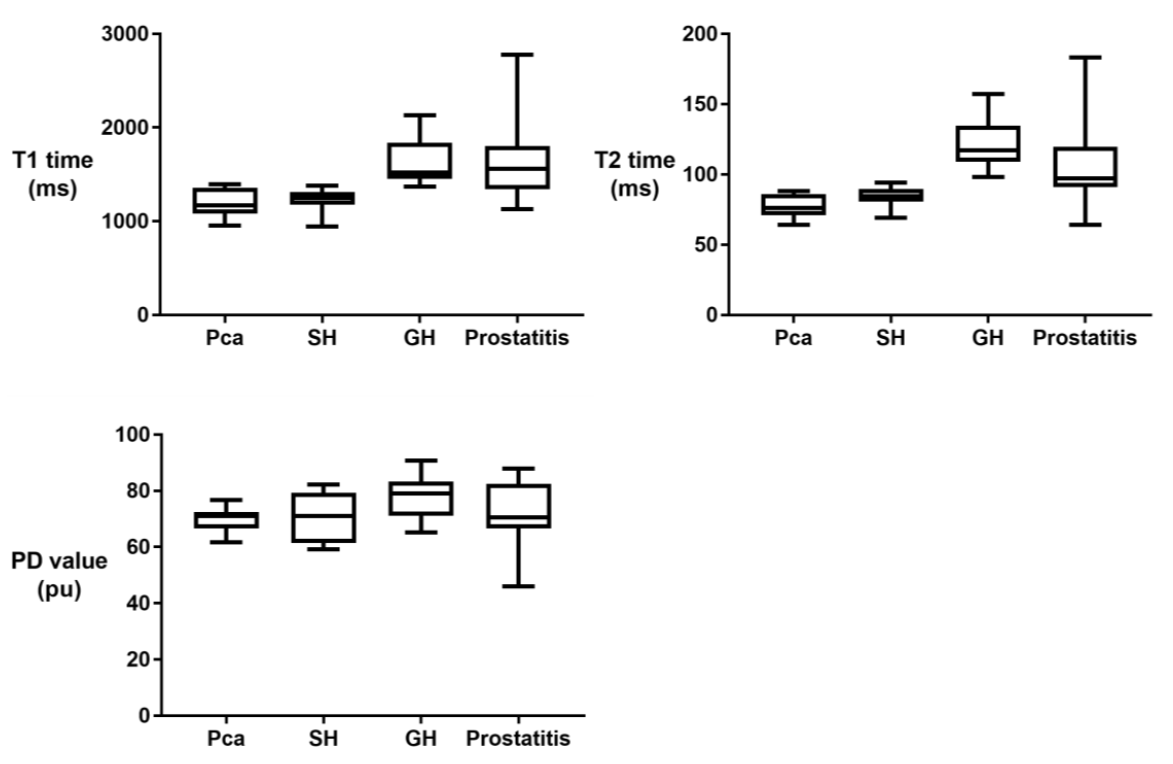
According to the exclusion criteria, 19 patients were excluded from this study. Finally, 14 PCa patients and 22 non-PCa patients were included in the study: 18 PCa lesions (10 in peripheral zone, PZ and 4 in transitional zone, TZ), 26 SH, 25 GH nodules and 21 prostatitis areas were analyzed. Representative images of a patient with PCa from synthetic MRI are shown in Figure 1. Both the T1 and T2 value of PCa lesions (1181.86 ± 141.08 ms for T1; 77.43 ± 8.28 ms for T2) were significantly lower than those of GH nodule (1620.65 ± 241.7 ms, p < 0.001 for T1; 121.94 ± 16.88 ms, p < 0.001 for T2) and those in prostatitis area (1631.14 ± 436.6 ms, p < 0.005 for T1; 121.94 ± 16.88 ms, p < 0.001 for T2). No significant differences of T1 and T2 value between SH and PCa groups were observed. The PD value of PCa lesion was significantly lower than that of GH nodule (70.24 ± 4.23 pu vs. 77.95 ± 7.2, p < 0.01). But no significant differences of PD values among PCa, SH and prostatitis groups were observed (Figure 2).Discussion
The diagnostic accuracy of PCa has been dramatically improved during the last decades because of the use of multi-parameter MRI. PI-RADS has been widely used for assessing the possibility of PCa with excellent diagnostic performance 2. Since PI-RADS is a subjective visual scoring system, reader’s familiarity with the imaging protocol and level of experience may play an important role in interobserver agreement 3. Therefore, an objective quantitative technique is needed. Synthetic MRI is a novel technique in which T1, T2, and PD quantification can be obtained efficiently and accurately. In this study it was found that T1 and T2 values of PCa lesion were significantly different from GH nodule and prostatitis area. It was seen that synthetic MRI has the potential of differential diagnosis of PCa, but the investigation of its ability to distinguish SH from PCa is limited by the relatively small sample size in this study.Conclusion
Quantitative relaxation maps from synthetic MRI has potential for differential diagnosis of PCa with pathological confirmation.Acknowledgements
No acknowledgement found.References
- Tanenbaum LN, Tsiouris AJ, Johnson AN, et al. Synthetic MRI for Clinical Neuroimaging: Results of the Magnetic Resonance Image Compilation (MAGiC) Prospective, Multicenter, Multireader Trial. Am J Neuroradiol 2017;38(6):1103-1110.
- Kasel-Seibert M, Lehmann T, Aschenbach R, et al. Assessment of PI-RADS v2 for the Detection of Prostate Cancer. Eur J Radiol 2016;85(4):726-731.
- Purysko AS, Bittencourt LK, Bullen JA, et al. Accuracy and Interobserver Agreement for Prostate Imaging Reporting and Data System, Version 2, for the Characterization of Lesions Identified on Multiparametric MRI of the Prostate. Am J Roentgenol 2017;209(2):339-349.
Figures