1605
Optimization of Phase Presets of Multi-Channel Transceiver Arrays for 7T Cardiac MRI1Chair of Cellular and Molecular Imaging, Comprehensive Heart Failure Center, University Hospital Wuerzburg, Wuerzburg, Germany
Synopsis
Multiple-element transmit (mTx) phased array technology provides significant improvement of the B1+-field homogeneity in ultra-high field (B0≥7T) cardiac MRI (cMRI). We propose time efficient semi-combinatorial approach of finding optimal Tx-elements phases presets. The proposed technique allows for searching the transmitter phases providing absolute optimum for а targeted B1+-field cost functions using high redundancy of optimal phase vector space. The technique was tested for pre-phasing of the in-house-built mTX-arrays in pigs at 7T cMRI. Improvement of the B1+-field homogeneity of >100% and SNR gain >50% was achieved using 10% of the computation time needed when compared with brute-force optimization.
Introduction
During last decades the multiple transmit (mTx) phased played a central role in improvement of the B1+-field homogeneity in ultra-high field MRI[1,2]. Manipulating of phases of individual array elements provides the desired spatial distribution of the B1+-field within a field-of-excitation, and to achieve the targeted magnetization flip-angle (FA) profile with the best possible smoothness. However, with the number of Tx-elements N=16..32 a high dimensionality of the phase space requires highly inefficient brute-force optimization approaches. In this paper we demonstrate a time efficient semi-combinatorial approach for finding optimal phase presets for Tx-elements of mTx arrays designed for 7T cardiac MRI of large animals.Method
For the equal driving amplitudes in each element the B1+-field of an mTX-array is described as:
B1s+ (r) = |Σ Φk sk(r) | k=1..N (1)
where sk(r) are complex spatial maps of the B1+ for each of N Tx-elements. "Permanent" B1+-shimming or “pre-phasing” of array is performed by setting phase vector {Φ}={Φ1..ΦN} to achieve the targeted spatial homogeneity and mean value of B1s+(r). The problem can be solved by maximizing a cost function introduced as:
F({Φ})=[mean(B1s+)] 2 / [std(B1s+) ·(max(B1s+) - mean(B1s+)) ] (2)
The difficulty of solution of the problem (2) are numerous local extrema of the function F({Φ}). The known work-around is a forced exhaustive search varying all possible combination of phase vector components over a discrete grid defined with precision δφ to localize the absolute maximum of F. In our new approach we use an randomly “undersampled” grid U to find the “sparse” approximation of the cost function F({Φu}) over phase space within acceptable CPU/GPU computation times on middle class workstation, and with phase precision δφ=100. By further using solver-based optimization, with the reasonable convergence criteria the final optimal phase vector can be refined to a precision of δφ≈10 using only 10% of time needed for full exhaustive search. The methodology was tested using four different mTX arrays which had been designed and developed for large animal (pig) experiments. They consist of 2 physically independent parts. Both parts allocate 8 elements driven by 4 TX-channels of RFPA to form the 8TX/16RX configuration.
The B1+-profiles were computed by full-wave electromagnetic simulation with CST software (CST, Darmstadt, Germany) and validated by channel-by-channel B1+-mapping on the MR-scanner. A plexiglass sphere phantom ID=160mm filled with tissue imitation sugar-salt solution (ε=55) was used for a validation of the B1+-field simulation by MR-measurements. All MRI measurements were done using a 7T Magnetom(TM) Terra scanner (Siemens, Erlangen, Germany ) equipped with an 8TX channels RFPA. For the GRE-based double-angle measurements (DAM)[3] of magnetization flip-angle the parameters were: TE/TR=1.8/4000ms, pixel size=2x2mm, slice thickness=3.5mm. The nominal FA=300/600 were used. The actual FA reconstruction was performed using in-house Matlab script. Testing the efficiency of the computed phases for B1+ optimization was done using the same GRE-sequence as for DAM measurements using a smaller FA=100.
Results
Figure 1a,b demonstrates the scheme of 2 tested arrays examples (A and B). Figure 1b shows the computed B1+-fields for each TX-channel presented as maximal intensity projection (MIP) over the marked slabs.
Figure 2a,b demonstrates validation of the CST-computed B1+ profiles of the individual Tx-channels. Two channels for each of two arrays are shown. The computed cross-correlation coefficients between each profile pair are in the range of R2= [0.97 ... 0.99].
Figure 3 and 4 shows the example of B1+ fields optimized for the A and B array designs. The optimizations were done in two “slab” regions with “transversal” and “coronal” orientation. The computation time (proportional to the optimization volume) was ~20hours for a 1000 voxel (64cm3) slab. The results demonstrate the obvious and significant improvement of both homogeneity and the mean value of the obtained B1+ configuration in comparison to the “default phases” profile.
Figure 5(a,b) shows the low flip-angle GRE image acquired using default and optimized phases for the design B. The improvement of the B1+ profile in the selected region of the spherical phantom was confirmed in practice.
Discussion
The proposed method of an optimal phasing of mTx-arrays has demonstrated efficiency for significantly different geometries of the Tx-elements allocation. Being still somewhat exhaustive the search algorithms is, nevertheless, by one or two orders of magnitude more time efficient with respect to a pure brute-force search. The average mean value of MR-signal in the optimized region is improved by 40% with decrease of the average local intensity gradient by more than 50%.Conclusion
The developed method demonstrated high efficiency for uncovering the full potential of the novel multi-elements transmits arrays designed for a high-resolution cardiac MRI of pigs at 7T.Acknowledgements
Acknowledgements Financial support: German Ministry of Education and Research (BMBF, grants: 01EO1004, 01E1O1504).References
[1] Niendorf T, Graessl A, Thalhammer C, Dieringer MA, Kraus O, Santoro D, Fuchs K, Hezel F, Waiczies S, Ittermann B, Winter L. Progress and promises of human cardiac magnetic resonance at ultrahigh fields: a physics perspective. J Magn Reson 2013;229:208-222.
[2] Oezerdem C, Winter L, Graessl A, Paul K, Els A, Weinberger O, Rieger J, Kuehne A, Dieringer M, Hezel F, Voit D, Frahm J, Niendorf T. 16-channel bow tie antenna transceiver array for cardiac MR at 7.0 tesla. Magnetic resonance in medicine 2016;75(6):2553-2565.
[3] Cunningham CH, Pauly JM, Nayak KS. Saturated double-angle method for rapid B1+ mapping. Magnetic resonance in medicine 2006;55(6):1326-1333.
Figures
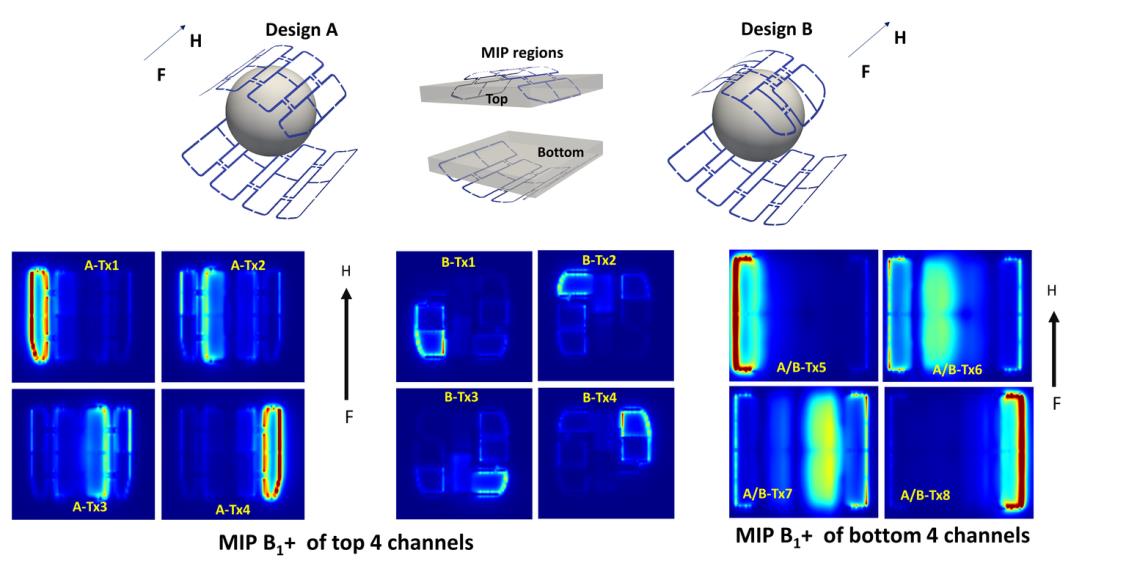
Figure 1
Arrangement of the Tx-elements in the array designs used for the proposed method validation and maximal intensity projection images of the CST-computed B1+ within shown slabs. Symmetrical allocation is used in reference design A; The asymmetrical arrangement including Г-type elements are chosen to be tested for design B. The same bottom part is used for both arrays. The position of spherical phantom used in both computation and MRI-measurements validation is shown.
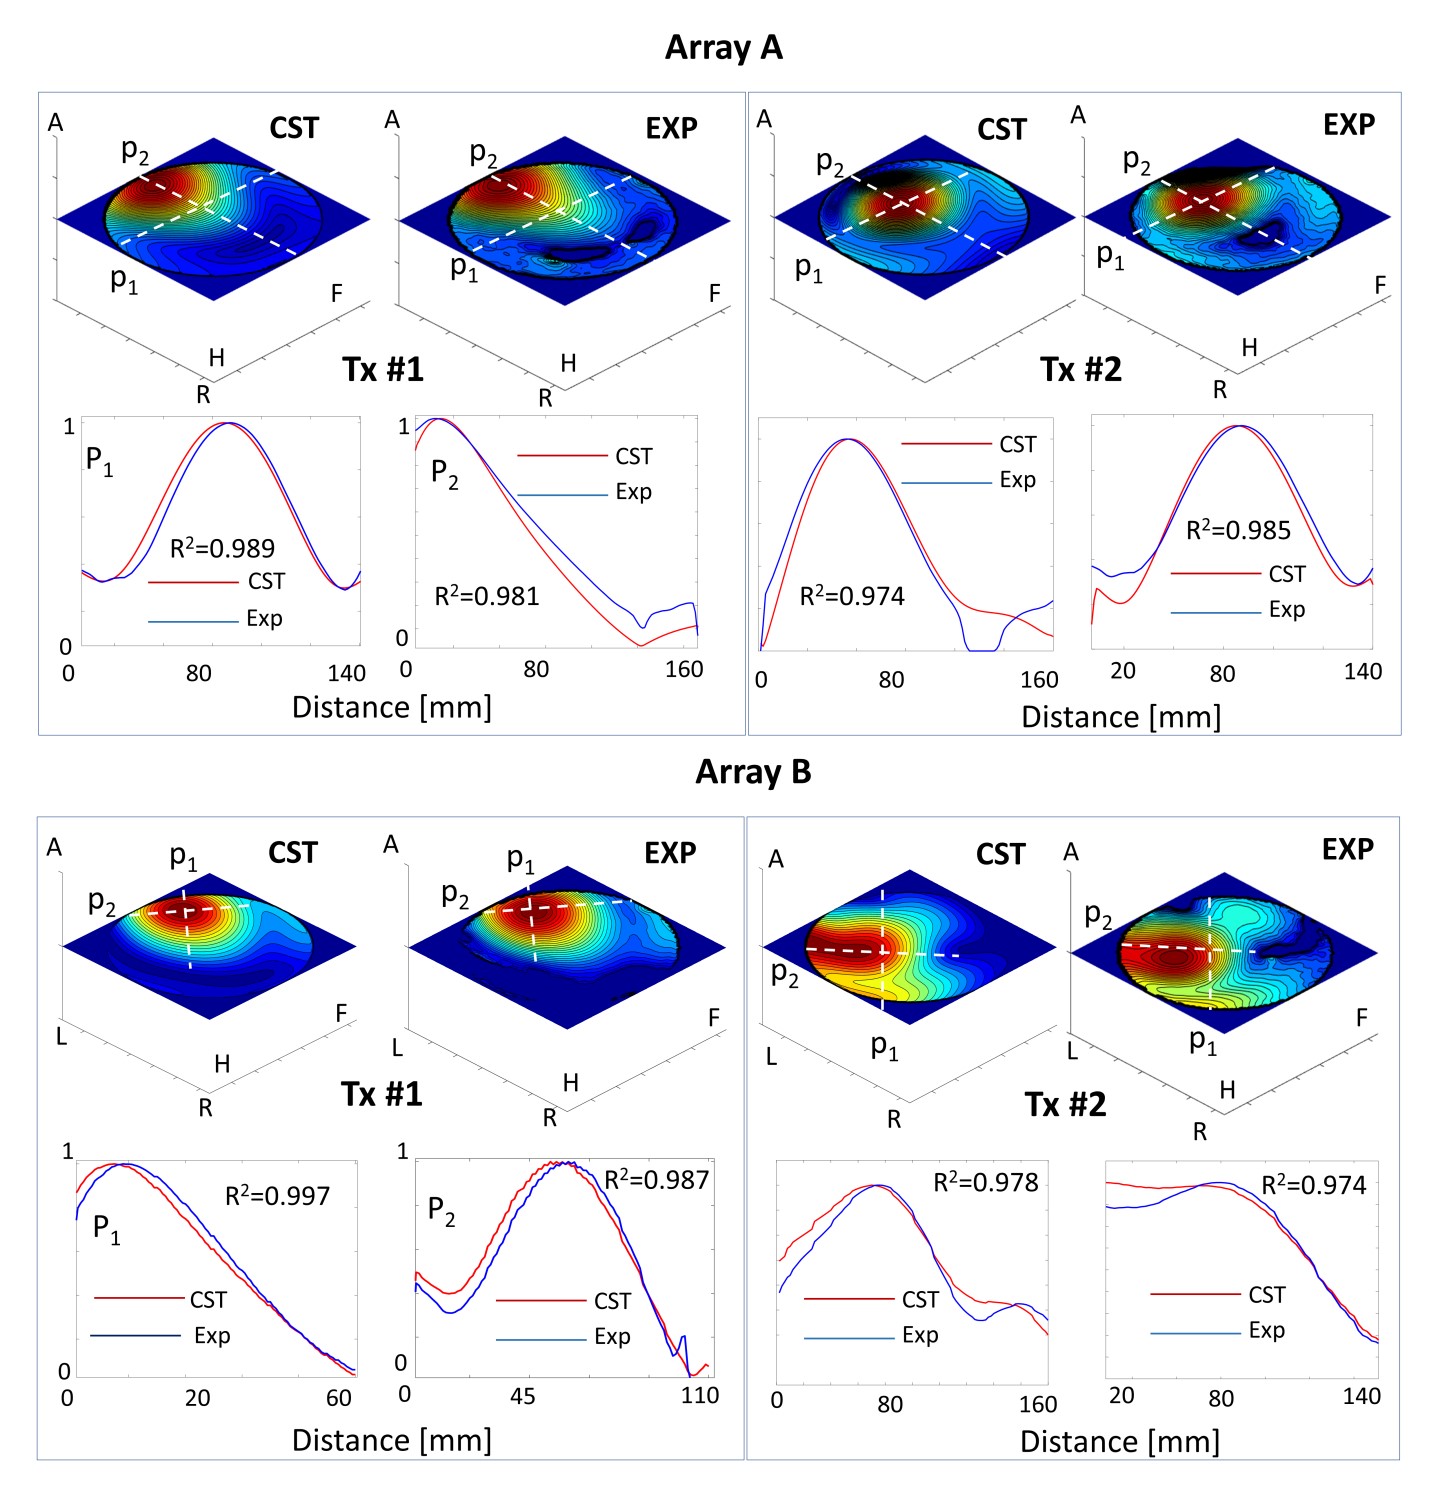
Figure 2
Validation of computed B1+-profiles of individual Tx-channels with the MRI measurements on spherical phantom. Two channels for each design are shown. The 2D spatial allocation of B1+-field maxima and minima are in good agreement for both arrays. The cross-correlation coefficients for selected 1D profiles are in the range of R2 =[0.97-0.99].
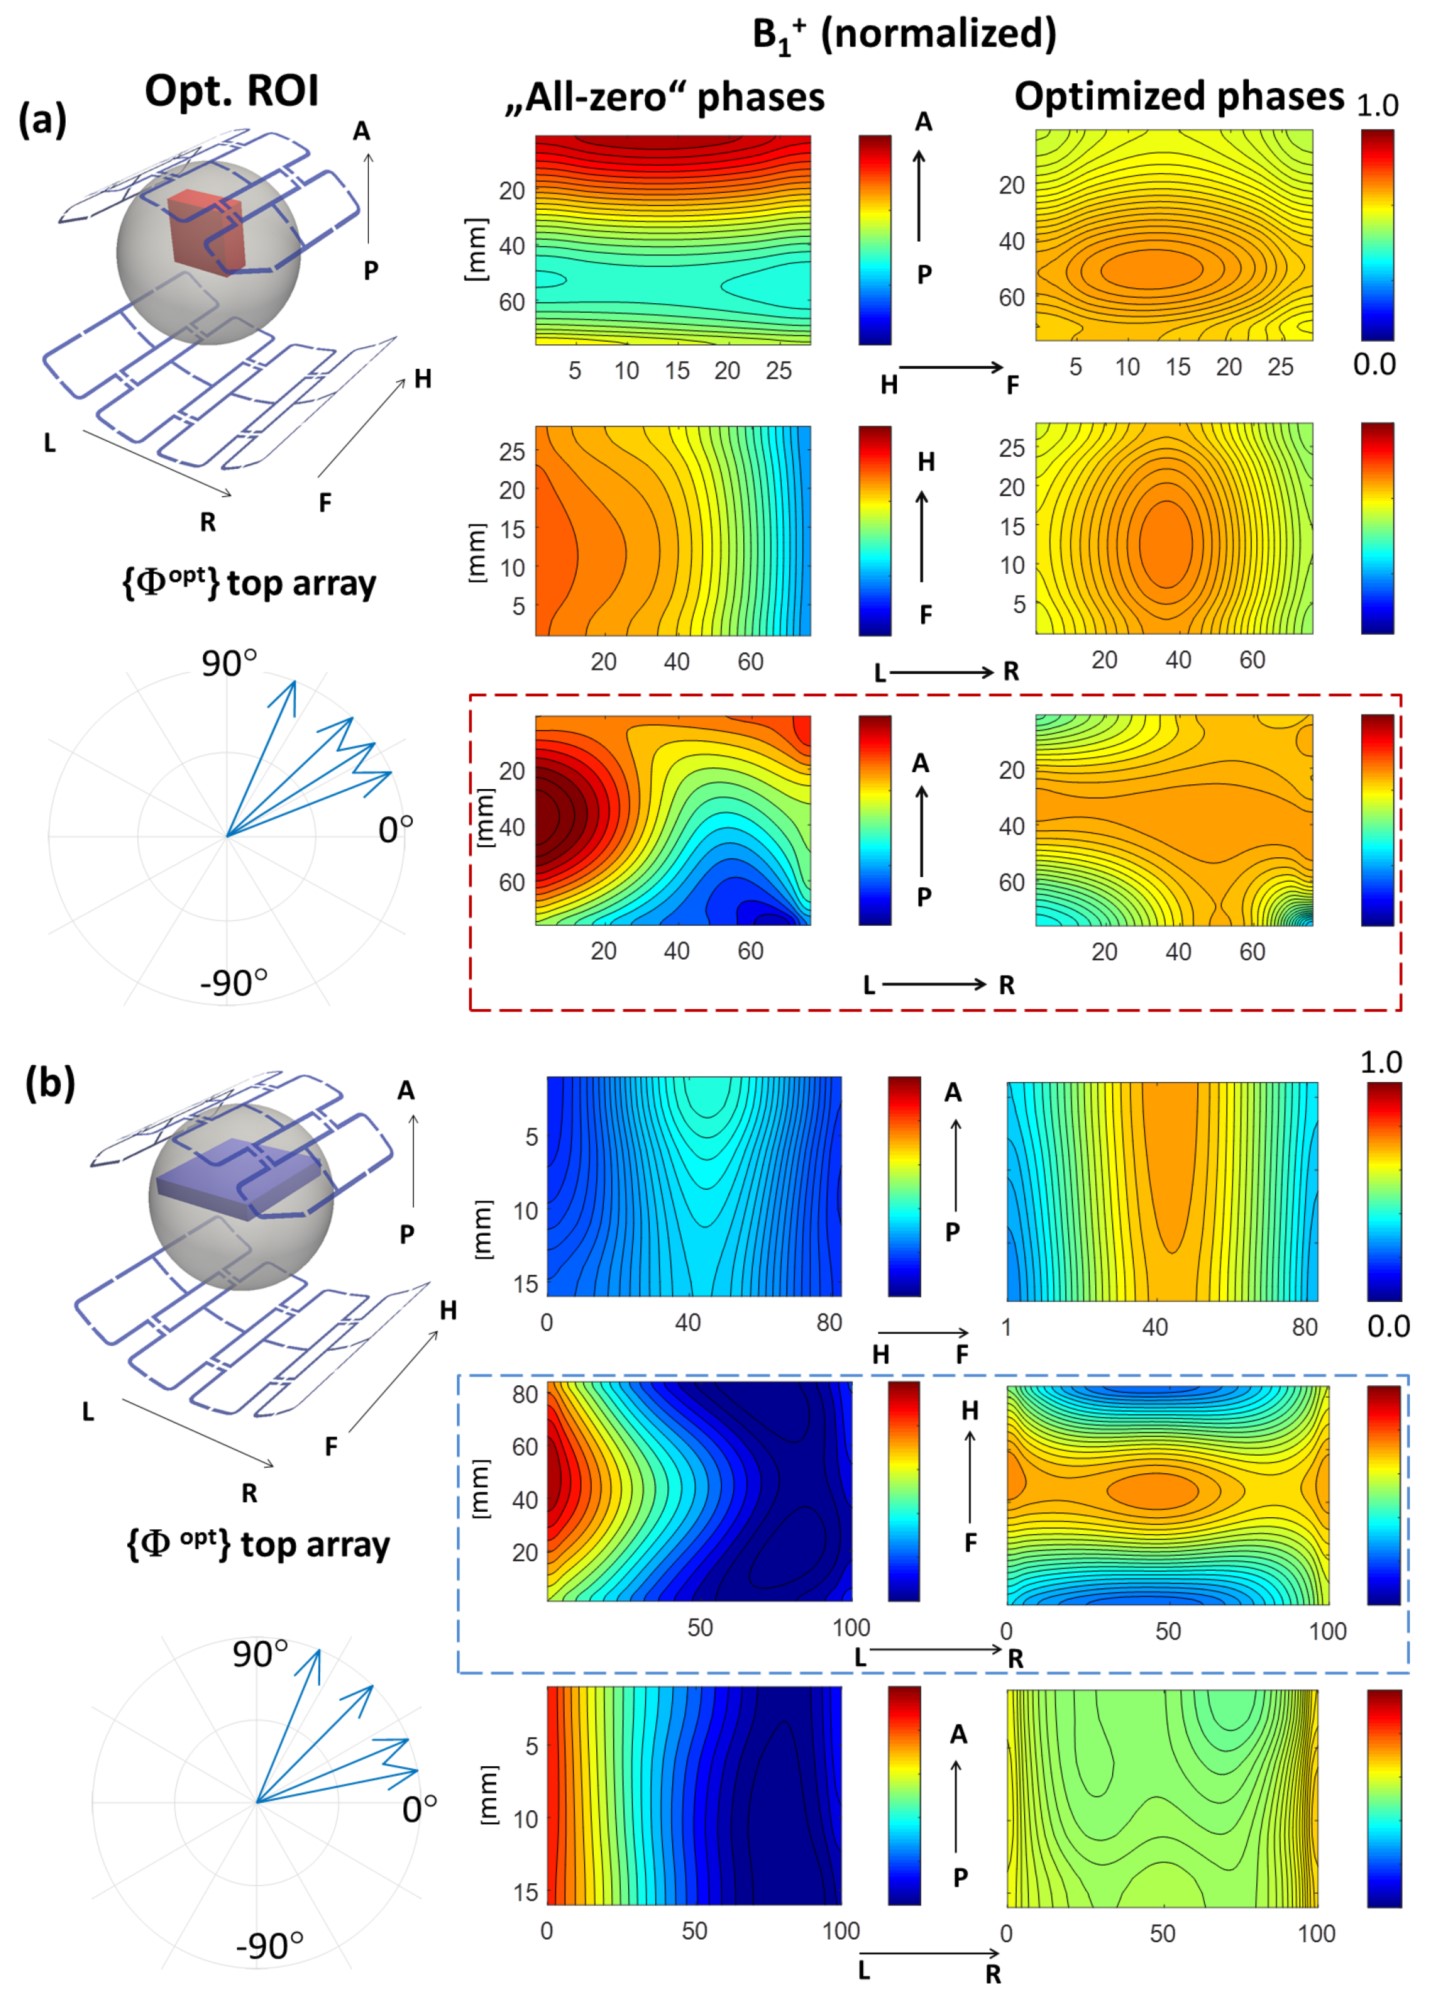
Figure 3
Optimized combined B1+ field of array design A. The optimization results performed in two “slab” regions of interest ∆r with “transversal” and “coronal” orientation are shown on panels (a) and (b) respectively. On the right-hand side panels, the orthogonal views of the optimization slab are projected (mean intensity). The main projection (transversal and coronal respectively) are marked by dashed lines. The results demonstrate significant improvement of both homogeneity and mean value of the obtained B1+ configuration in comparison to the default profile. Left-bottom corner panel shows optimized phases of 4 top channels.
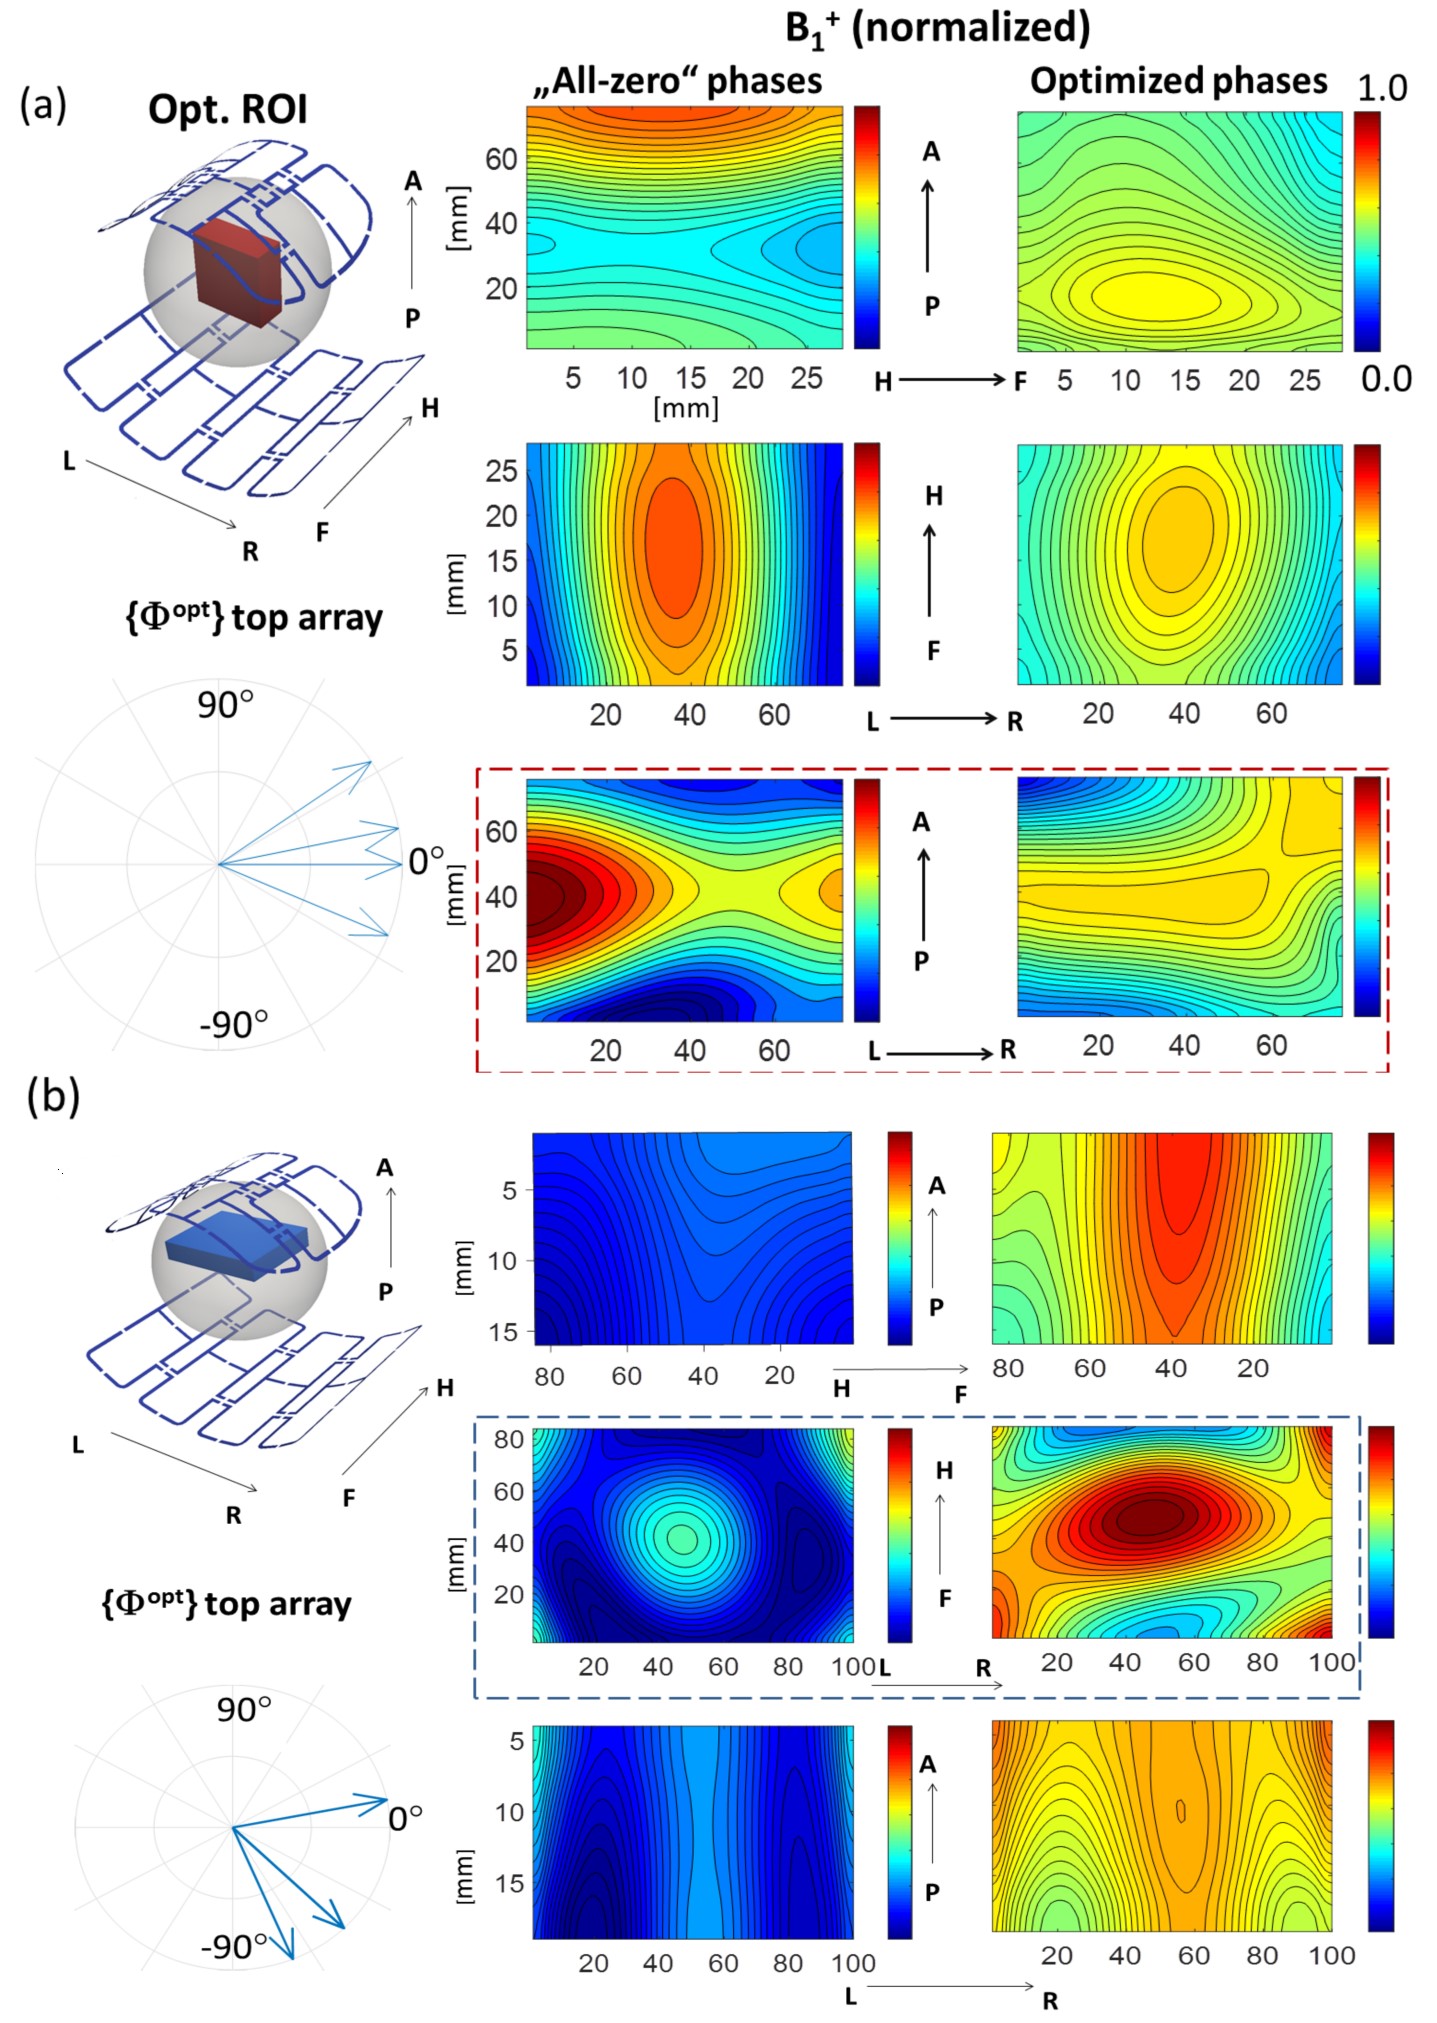
Figure 4
Combined optimized B1+ field array design B. On the right-hand side panels, the 3 orthogonal views of the optimization slab are projected (mean intensity). The main projection (transversal and coronal respectively) are marked by dashed lines. Left-bottom corner panel show optimized phases of 4 top channels. The results for coronal slab demonstrate the achieved focusing of B1+ in the targeted penetration depth and increase of men value by 40% in comparison to the default phase profile.
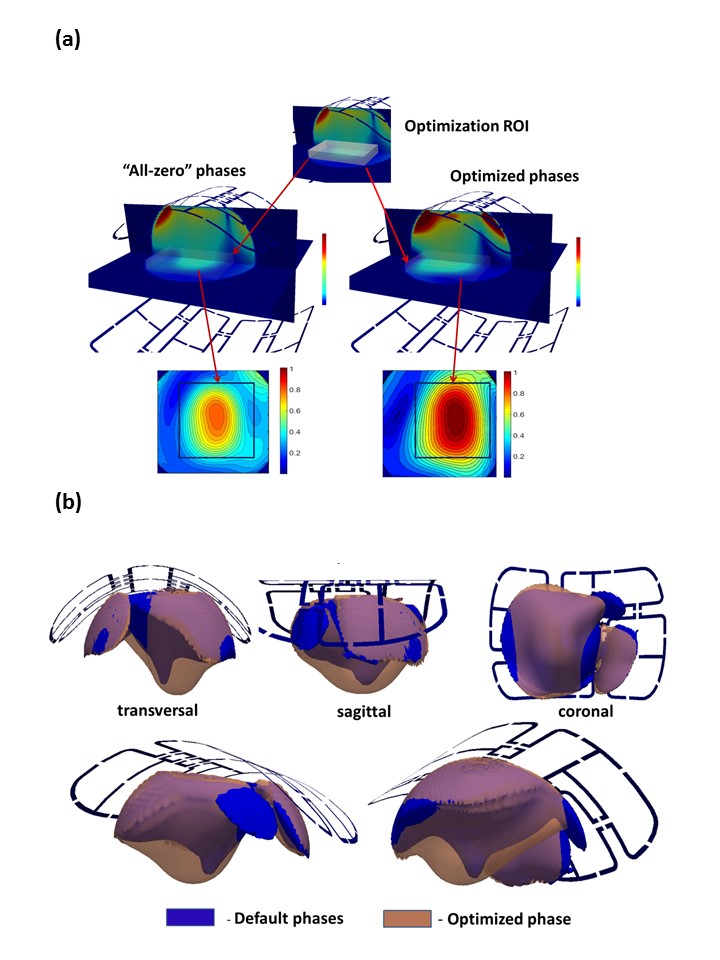
Figure 5
(a) Low flip-angle GRE image acquired using default and optimized phases for array design B. An essential improvement of the B1+ profile in the targeted optimization region (shown as semi-transparent box and solid rectangles) of the spherical phantom is confirmed. The average mean value of signal in the selected region is improved by 50%. (b) Experimentally measured signal-to-noise ratio iso-surfaces (SNR=30) for optimized and default phase settings for design B array