1587
Robust detection and potential application in orientation tracking of a small-amplitude field oscillation independent of location in the scanner bore and parallel to the static magnetic field.1Human Biology, University of Cape Town, Cape Town, South Africa, 2Athinoula A. Martinos Center, Massachusetts General Hospital, Charlestown, MA, United States, 3Radiology, Harvard Medical School, Boston, MA, United States, 4Cape Universities Body Imaging Centre (CUBIC), University of Cape Town, Cape Town, South Africa
Synopsis
We explore the possible uses of a 40-kHz switching signal that is proportional to the gradient slew rate. The signal was identified by probing the rate of change of the magnetic flux density in the MRI scanner using a three-dimensional pickup coil. The signal is independent of both the orientation of the pickup coil and location in the scanner bore, and is directed parallel to the static magnetic field. This indicates that it is not caused by current in the gradient coils. These properties make this signal a useful vector reference that could be used for orientation tracking or time frame synchronisation.
Introduction
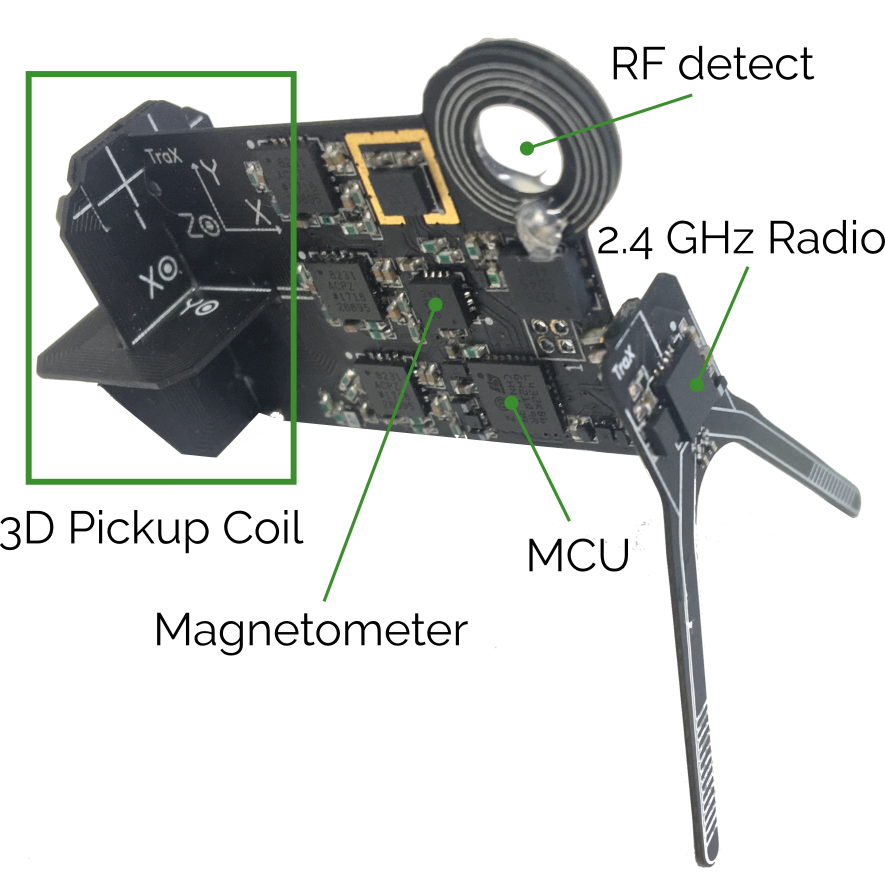
Previously we developed a Wireless Radio frequency triggered Acquisition Device (WRAD) that is capable of sub-microsecond synchronisation to the pulse sequence time1. The WRAD has a 3-axis magnetometer and 3-axis pickup coil (Figure 1). The pickup coils detect the rate of change of the magnetic flux density and are therefore sensitive to rapidly varying signals - allowing the detection of a 40-kHz oscillation that is synchronous to the gradient timing. Surprisingly, this signal is insensitive to location in the scanner bore and is strongly directional. These properties mean that it could be used as a vector reference for orientation detection or an additional clock source for (wireless) time frame synchronisation. We therefore aim to test whether we can extract the 40-kHz oscillation from a series of sinusoidal pulses (that we currently use for motion detection).Method
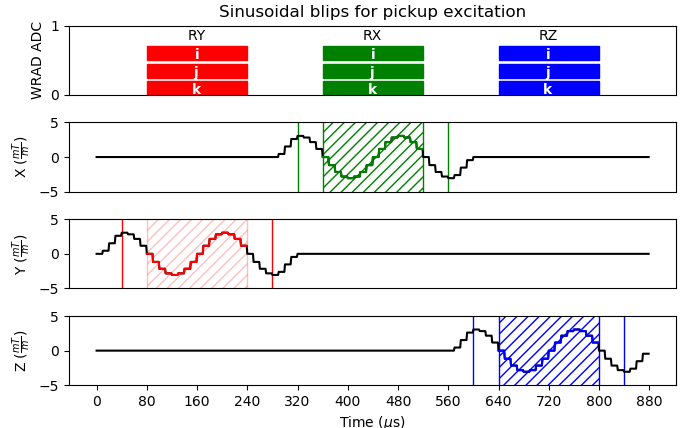
The data used comes from a modified gradient echo (GRE) pulse sequence played out on a 3 T Skyra (Siemens, Erlangen, Germany). Before each readout of the GRE sequence, three sinusoidal pulses are played out, one on each gradient axis (lasting a total of 880 μs - Figure 2). Each sinusoid has a frequency of $$$f_n$$$ = 6.25 kHz and a maximum slew rate of $$$s$$$ = 60 T/m/s:
$$\dot{g}=s\cos(2\pi f_n+\theta_n)$$
The WRAD detects the non-selective RF pulse in the GRE pulse sequence, waits until the start of the sinusoidal playouts, and then samples each axis of the 3-axis pickup coil using a 12-bit ADC at a frequency of 200 kHz. The pickup signals are amplified by a factor of 32 and low-pass filtered using a 3-pole analog Butterworth filter with a cut-off frequency of 32 kHz. This filter was designed before we had knowledge of the 40-kHz signal; it will therefore be attenuated. In the ideal case - assuming linear gradients, an axial symmetric z-gradient coil and negligible rates of change of divergence and curl - the position encoding voltage vector induced in the 3-axis pickup coil sensor can be written as follows2:
$$\vec{v}_p=-a\mathbf{R}\left(\left[\begin{matrix}-\frac{\dot{g_z}}{2}&0&\dot{g_x}\\0&-\frac{\dot{g_z}}{2}&\dot{g_y}\\\dot{g_x}&\dot{g_y}&\dot{g_z}\end{matrix}\right]\vec{p} + B_0\vec{z}\times\vec{\omega}\right)$$
where $$$\mathbf{R}$$$ is a rotation matrix that transforms a vector from the gradient frame into the WRAD frame, $$$\dot{g_x}$$$, $$$\dot{g_y}$$$ and $$$\dot{g_z}$$$ are the rates of change of the x, y and z gradients, $$$a$$$ = 32 $$$\times$$$ 0.0052 m2 is a geometric scaling factor relating to the pickup coils, $$$\vec{p}$$$ is the position of the WRAD in the gradient frame and $$$\vec{\omega}$$$ is the angular rate of change of the WRAD. We propose that the high frequency ‘switching signal’ superimposed on the sinusoidal pulses in Figure 3, can be modelled by the following equation:
$$\vec{v}_r=-a\left(\dot{g_x}+\dot{g_y}+\dot{g_z}\right)r\cos(2\pi f_r+\theta_r)\mathbf{R}\vec{z}$$
where $$$f_r$$$ = 40 kHz. Adding the switching signal to the position encoding signal and then combining the result with the pulse sequence waveform shapes results in the following:
$$\vec{v}=\vec{v}_p+\vec{v}_r=-a\mathbf{R}\left(\mathbf{S}\vec{p}+r\cos(2\pi f_r+\theta_r)\vec{z}\right)s\cos(2\pi f_n+\theta_n)$$
$$~=-a\mathbf{R}\left(s\cos(2\pi{f_n}+\theta_n)\mathbf{S}\vec{p}+\frac{1}{2}rs\left(\cos(2\pi[f_n\pm{f_r}]+\theta_n\pm \theta_r)\right)\vec{z}\right)$$
where the angular rate term is dropped because it is perpendicular to the switching signal and $$$\mathbf{S}=\left[\begin{smallmatrix}0&0&1\\0&0&0\\1&0&0\end{smallmatrix}\right],~\left[\begin{smallmatrix}0&0&0\\0&0&1\\0&1&0\end{smallmatrix}\right]$$$and$$$~\left[\begin{smallmatrix}-\frac{1}{2}&0&0\\0&-\frac{1}{2}&0\\0&0&1\end{smallmatrix}\right]$$$ for the RX, RY and RZ readouts (Figure 2). It follows that the switching signal can be isolated by applying a Goertzel filter [single bin Discrete Fourier Transform (DFT)] to $$$\vec{v}$$$ at a frequency of $$$f_n\pm{f_r}$$$.
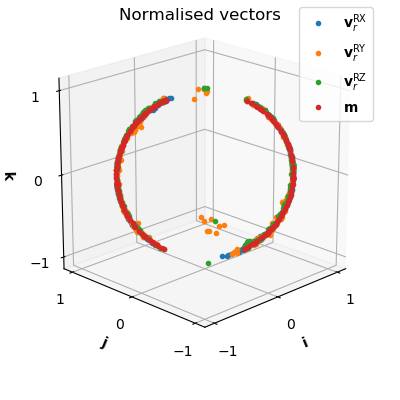
Experiment 1) A normalised observation from the 3-axis Hall effect magnetometer (MV2, Metrolab) can be interpreted as $$$\mathbf{R}\vec{z}$$$, which is the gradient z-axis observed in the WRAD coordinate frame. Similarly, if we isolate the switching signal and normalise it, we expect the same result. To evaluate this observation, the WRAD was placed at a positive z-displacement and then rotated a full revolution about the centre of the pickup coil assembly. The switching signal and magnetometer observations could then be compared.
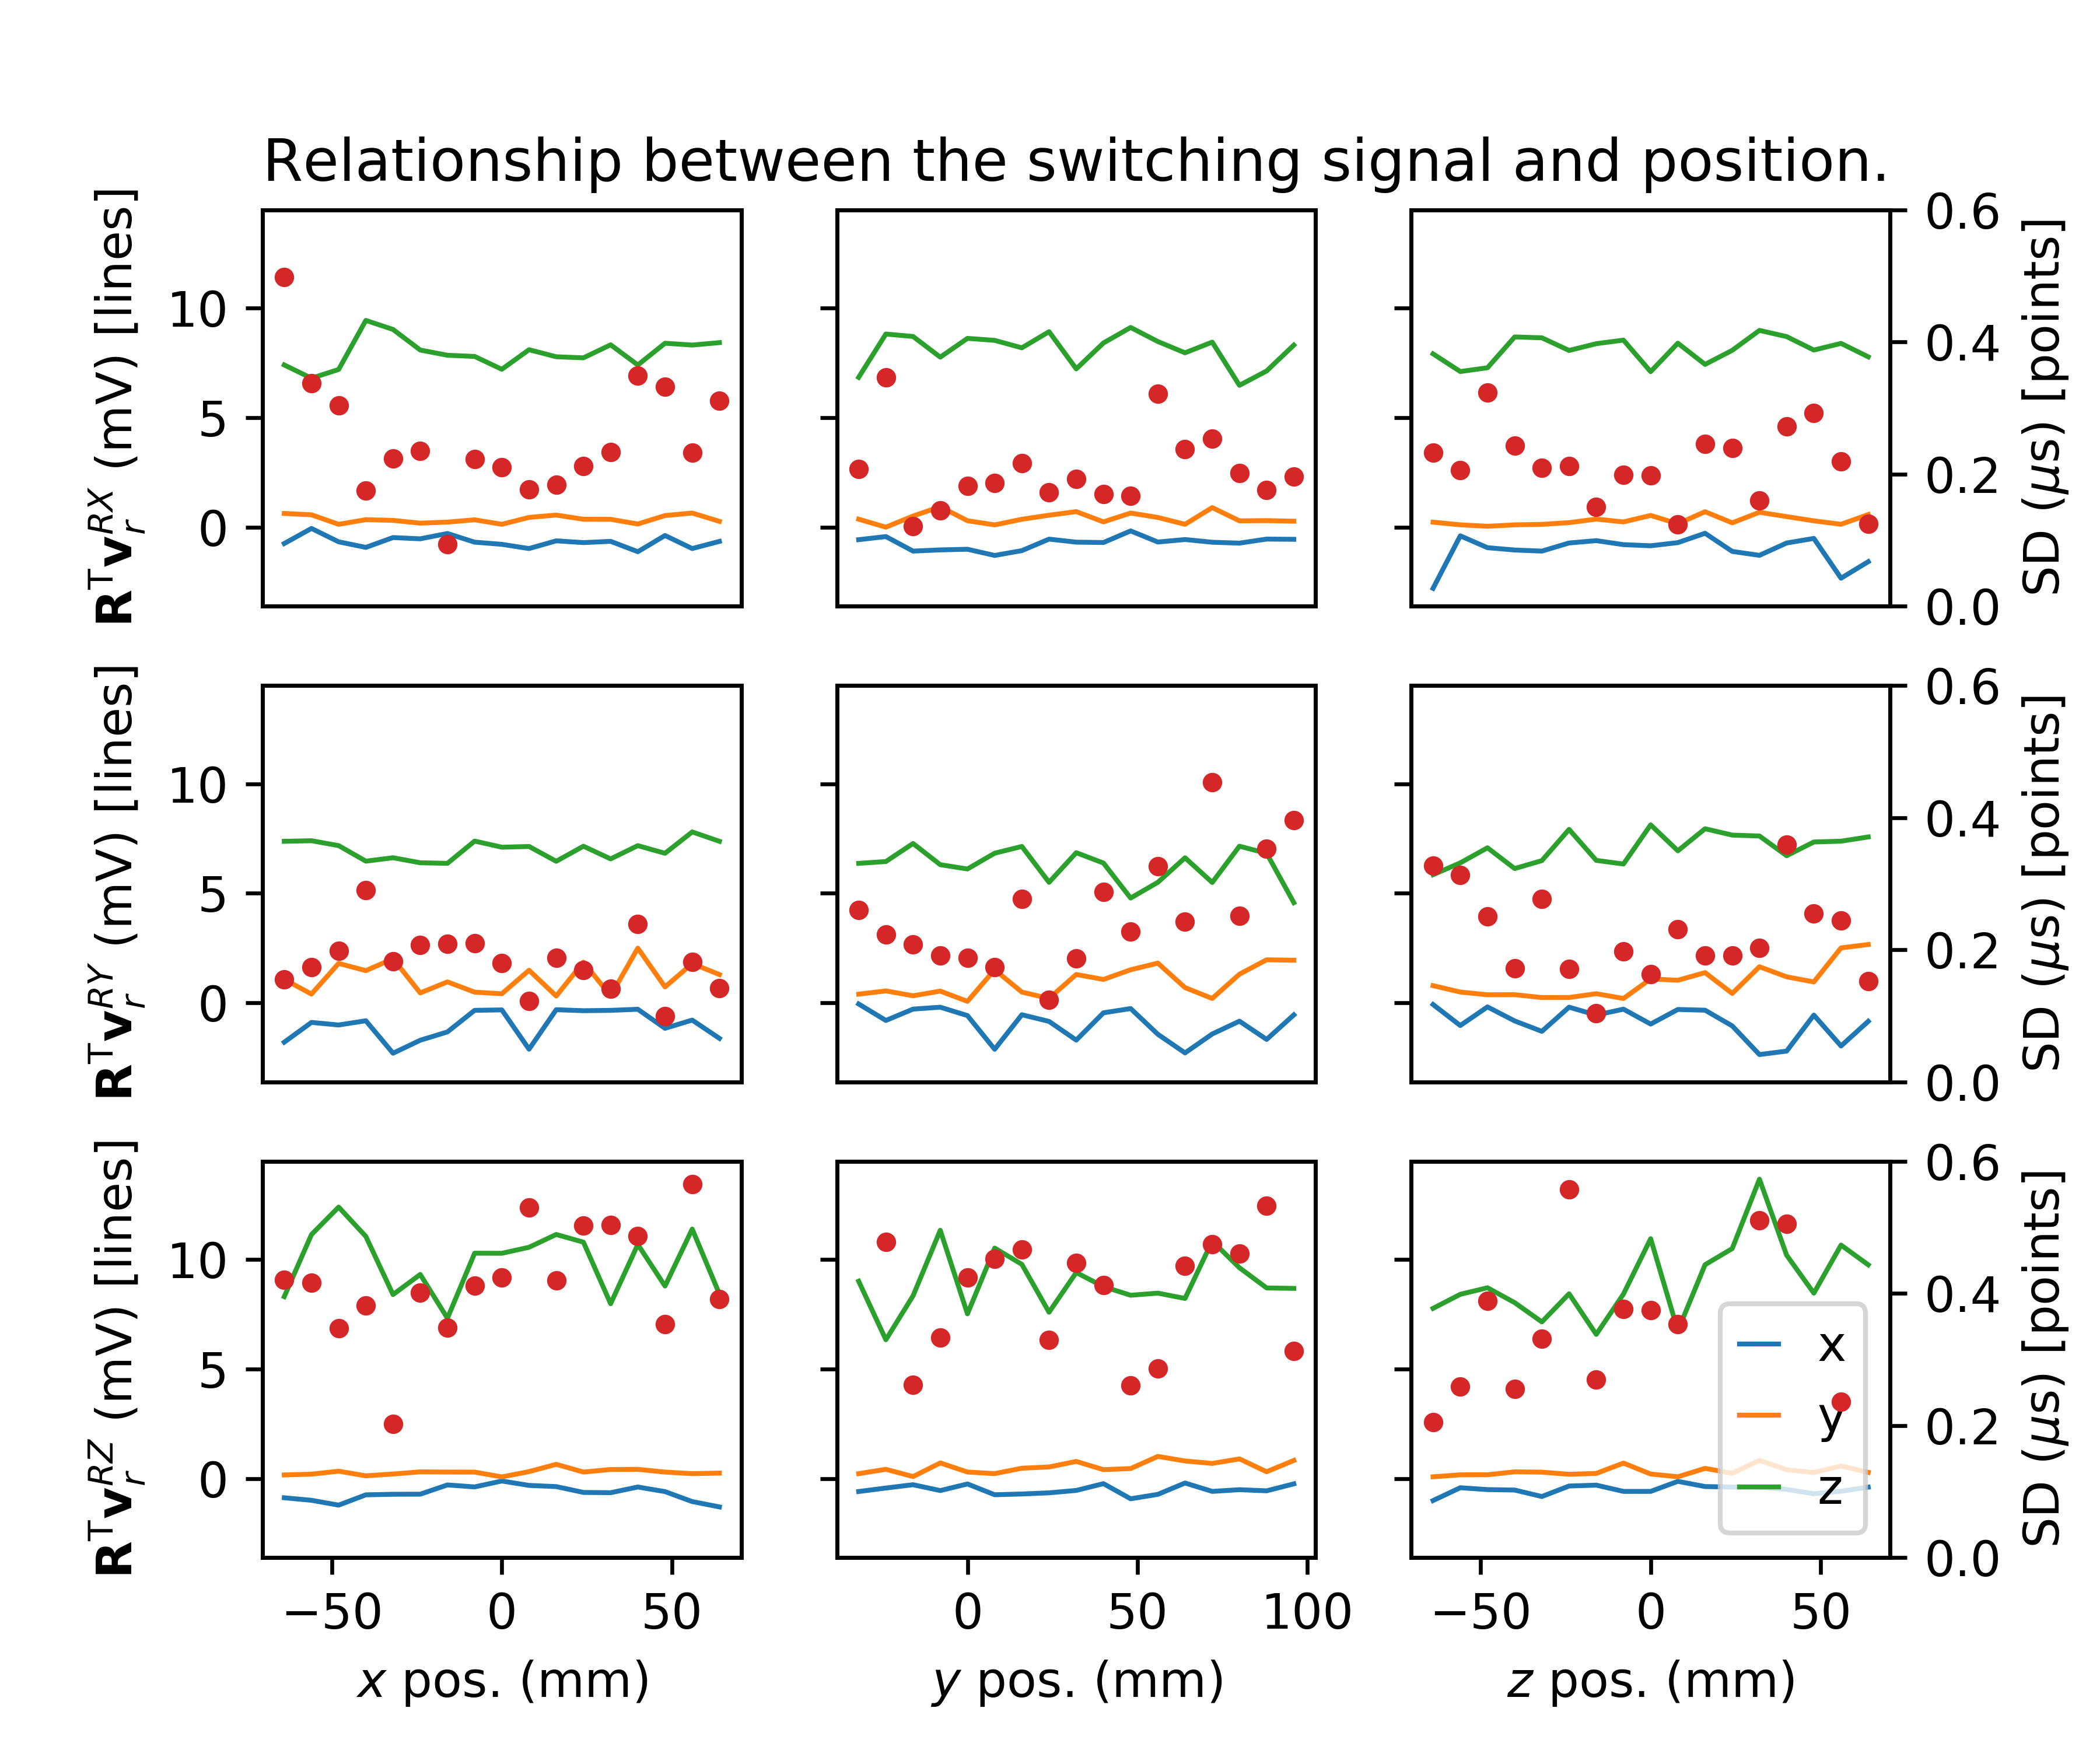
Experiment 2) The WRAD was displaced, first along the x, then the y, and finally the z direction in 8 mm increments. This allowed us to observe how the switching signal changes based on location in the scanner bore.
Results
Experiment 1) The Goertzel filter effectively separates the switching signal from the position encoding. The normalised switching signal and magnetometer observations closely match and are independent of the WRAD orientation, validating the proposed model (Figure 4).
Experiment 2) The switching signal is independent of location in the scanner bore and is observable during all three gradient coil playouts (Figure 5). The phase is stable to within 0.6 μs.
Discussion
The switching signal's high frequency makes it virtually undetectable using NMR based methods because the oscillation will cause a field perturbation of 0.0006 rad. It will therefore have almost no impact on image formation. It is unclear whether this signal would be observable in all MRI scanners.Conclusion
The switching signal could potentially be used as an alternative to a magnetometer for orientation measurement and would allow sub-microsecond, wireless, time-frame synchronisation.Acknowledgements
This work was supported in part by the National Institutes of Health under grants R01HD085813, R01HD093578, R21AG046657, R01HD071664 and R21MH096559, the Bertarelli Foundation, the NRF/DST through the South African Research Chairs Initiative and the University of Cape Town through the RCIPS Explorer fund EX15-009.References
1) A. van Niekerk, E. Meintjes, and A. J. W. van der Kouwe, “Hybrid motion sensing with a wireless device, self-synchronized to the imaging pulse sequence.” in Proceedings of the 26th Annual Meeting of the International Society of Magnetic Resonance in Medicine. Paris, France: Wiley, 2018
2) M. A. Bernstein, X. J. Zhou, J. A. Polzin, K. F. King, A. Ganin, N. J. Pelc, and G. H. Glover, “Concomitant gradient terms in phase contrast MR: Analysis and correction,” Magnetic Resonance in Medicine, vol. 39, no. 2, pp. 300–308, feb 1998.
Figures