1585
First MRI of the human spinal cord at 9.4T1Hochfeld-Magnetresonanz, Max-Planck-Institut für biologische Kybernetik, Tübingen, Germany
Synopsis
This study presents the first anatomical images of the human cervical spinal cord recorded at the ultrahigh field strengths of 9.4 T. The images were acquired with a Gradient-Echo-Sequence. Different sequence parameters and resolutions were compared. The highest in-plane resolution was 0.2 mm x 0.2 mm. These high-resolution images show the details of the spinal cord and the surrounding tissue clearly. All measurements were acquired with an 8-channel transmit-, 16-channel receive-tight-fit array coil, originally dedicated for brain applications.
Introduction
Since the 1980s, magnetic resonance imaging (MRI) of the human spinal cord (SC) is a common routine in clinical procedures for the assessment of pathologies, such as SC-injury1,2, multiple sclerosis3,4, amyotrophic lateral sclerosis5 or spondy-losis6. Due to the signal-to-noise-ratio (SNR) improvement and thus possible increase in spatial resolution to better match the small dimensions of SC structures, higher field strengths are advantageous for SC MRI.
Recently, results of high-resolution 7T axial SC imaging were published7,8,9. In these studies, gradient echo (GRE) images of the SC are presented. While Zhao et al.7 compare images with different in-plane resolutions up to a maximum of 0.3 mm x 0.3 mm, Sigmund et al.8 and Massire et al.9 publish GRE images of the SC with a resolution of 0.18 mm x 0.18 mm. These three studies acquired images with SC-dedicated coils.
The purpose of this study is to present the first images of the human SC that were acquired at a B0 field-strength of 9.4T. To our knowledge, no human SC has been imaged at this field strength before. We compare GRE results with different in-plane resolutions. The highest resolution acquired was 0.2 mm x 0.2 mm. All measurements were performed with an 8-channel transmit-, 16-channel receive-tight-fit array coil, originally dedicated for brain applications10.
Methods
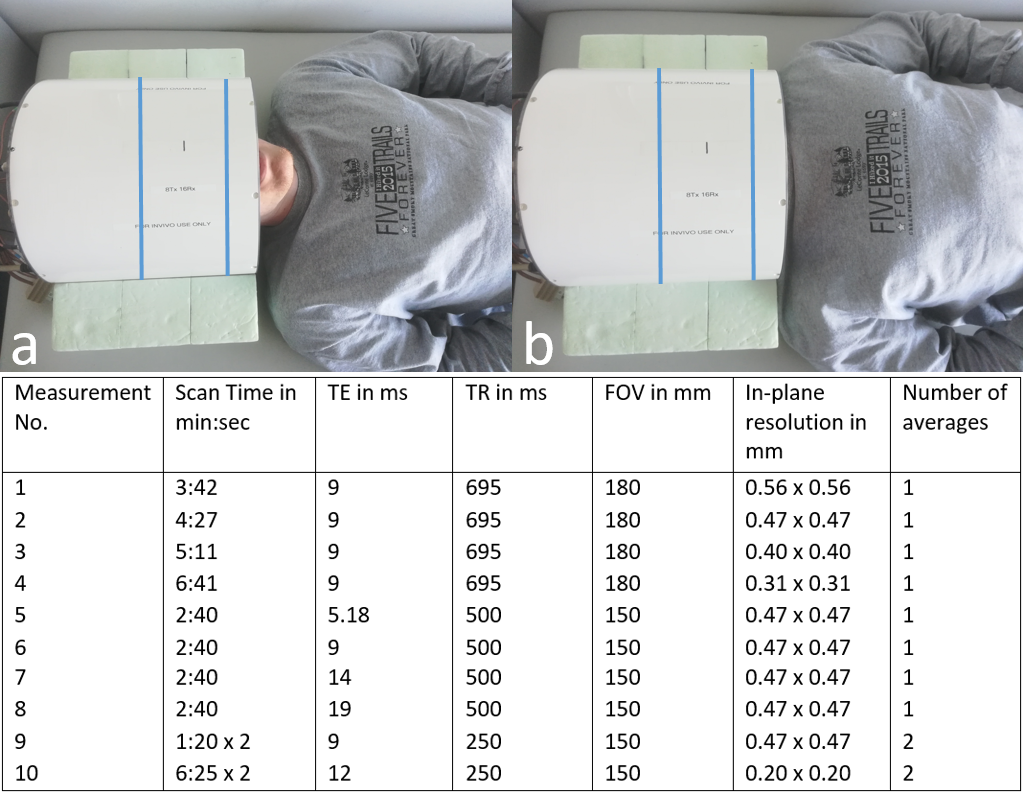
All experiments were performed on a Siemens (Erlangen, Germany) Magnetom 9.4T whole-body MRI scanner. For RF transmission and reception, a prototype 16‐channel tight‐fit array, which consists of eight TxRx surface loops, and eight Rx‐only vertical loops positioned along the central axis (parallel to the magnetic field B0) of each TxRx loop, perpendicular to its surface, was used10. The coil was originally constructed to maximize central SNR for human brain scans. For brain studies, the subject would be placed in the coil as depicted in figure 1a. For the SC measurements in this study, the subject was placed as far inside the coil as possible (figure 1b), so that the cervical SC is centered between the channel array.
9.4T anatomical imaging was performed with an axial two-dimensional T2*-weighted FLASh gradient echo sequence (GRE). As visible in the table in figure 1, the sequence was applied 10 times to test and optimize different parameter settings.
A localized flip-angle optimization method was used11 and B0-field shimming was performed locally using FASTESTmap12.
One healthy male volunteer (age 25) was included in the study. The protocol was approved by the local Ethics Committee and written consents was obtained from the subject prior to MR examinations.
Results and Discussion
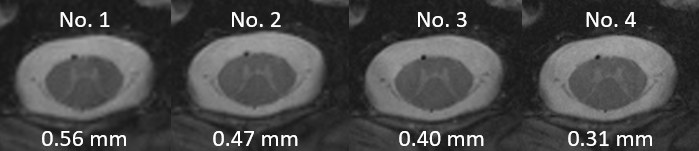
In figure 2, images with different spatial resolutions are compared. As expected, the higher the resolution is, the more anatomical details are visible in the SC and the surrounding tissue. Scan duration increases as the image resolution increases (see table in figure 1).
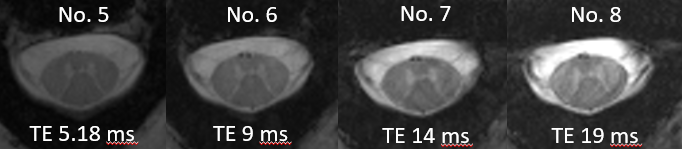
In figure 3, the measurement numbers 5-8 from table in figure 1 are depicted. Here, images, measured with different echo times (TEs), are illustrated. It shows that higher TEs result in a higher gray-white-matter-contrast, but also in a lower SNR. For that reason, a TE between 9 and 14 ms compromises between reasonable gray-white-matter-contrast and acceptable SNR
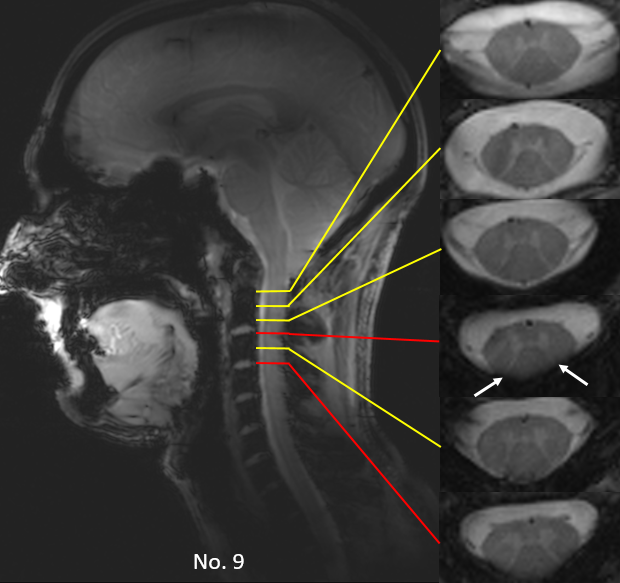
Figure 4 displays different transversal slices and their positions in the human cervical SC (measurement number 9). Axial slices acquired mid-vertebra (yellow lines) and at the disk location (red lines) are illustrated. Strong magnetic susceptibility-related signal dropouts are detectable in the disk located slices. Similar results were presented from Massire et al.9.
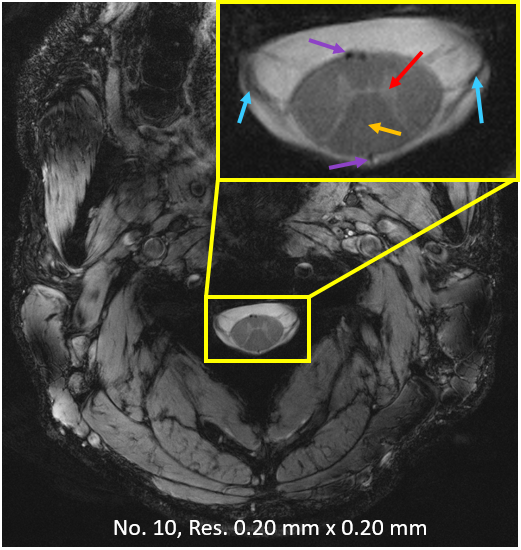
Lastly, in figure 5 the whole FOV of measurement 10, with a zoomed-in region-of-interest for the SC, is shown. It is the measurement with the highest resolution (0.20 mm x 0.20 mm) in this study. We chose a TE of 12 ms and a repetition time (TR) of 250 ms. Through this study, these settings revealed the best gray-white-matter-contrast. The result, visible in figure 5, is a clear SC image. Gray and white matter, as well as nerve roots and blood vessels are recognizable. Segmentation of gray and white matter seems very well possible.
Conclusion
This study presents the first images of the human SC measured at a field strength of 9.4T. With a coil, originally dedicated for brain applications and optimized for the central SNR, we were able to image the human cervical SC in high quality and resolution at 9.4T. However, in future experiments we will further optimize sequence parameters, investigate B0 shim-setups, and extend the scope of imaging sequences to yield complementary contrasts. Imaging the SC on such a high field strength might open up new possibilities in the field of SC-research and clinical patient care.Acknowledgements
Funding by the European Union (ERC Starting Grant, SYNAPLAST MR, Grant Number: 679927) is gratefully acknowledged.References
1. Ellingson BM, Ulmer JL, Schmit BD. Morphology and morphometry of human chronic spinal cord injury using diffusion tensor imaging and fuzzy logic. Ann. Biomed. Eng. 2008; 36(2): 224–236.
2. Mahmood NS, Kadavigere R, Ramesh AK, Rao VR. Magnetic resonance imaging in acute cervical spinal cord injury: a correlative study on spinal cord changes and 1 month motor recovery. Spinal Cord, 2008; 46(12): 791–797.
3. Ohgiya Y, Oka M, Hiwatashi A, Liu X, Kakimoto N, Westesson PLA, Ekholm SE. Diffusion tensor MR imaging of the cervical spinal cord in patients with multiple sclerosis. Eur. Radiol. 2007; 17(10): 2499–2504.
4. Ciccarelli O, Wheeler-Kingshott CA, McLean MA, Wimpey K, Cercignani M, Miller DH, Thompson AI. Spinal cord spectroscopy and diffusion-based tractography to assess acute disability inmultiple sclerosis. Brain 2007; 130: 2220–2231.
5. Valsasina P, Benedetti B, Caputo D, Filippi M, Perini M. Diffusion tensor MRI of the spinal cord in amyotrophic lateral sclerosis. Proceedings of the 13th Scienti fic Meeting ISMRM, Seattle, WA, USA,2006; 986.
6. Demir A, Ries M, Moonen CTW, Vital LM, Dehais J, Arne P, Caille JM, Dousset V. Diffusion-weighted MR imaging with apparent diffusion coefficient and apparent diffusion tensor maps in cervical spondylotic myelopathy. Radiology, 2003; 229(1): 37–43.
7. Zhao W, Cohen-Adad J, Polimeni JR, Keil B, Guerin B, Setsompop K, Serano P, Mareyam A, Hoecht P, Wald LL. Nineteen-Channel Receive Array and Four-Channel Transmit Array Coil for Cervical Spinal Cord Imaging at 7T. Magnetic Resonance in Medicine. 2014; 72:291–300.
8. Sigmund EE, Suero GA, Hu C, McGorty K, Sodickson DK, Wiggings GC, Helpern JA. High-resolution human cervical spinal cord imaging at 7T. NMR Biomed. 2012; 25: 891–899.
9. Massire A, Taso, M, Besson P, Guye M, Ranjeva JP, Callot V. High-resolution multi-parametric quantitative magnetic resonance imaging of the human cervical cord at 7T. 2016; 143: 58-69.
10. Avdievich NI, Giapitzakis IA, Pfrommer A, Borbath T, Henning A. Combination of surface and ‘vertical’ loop elements improves receive performance of a human head transceiver array at 9.4 T. 2018; NMR in Biomedicine. 31(2): 1-13.
11.Versluis MJ, Kan HE, van Buchem MA, Webb AG. Improved signal to noise in proton spectroscopy of the human calf muscle at 7 T using localized B1 calibration. Magnetic resonance in medicine. 2010; 63(1): 207-211.
12 . Gruetter R, Tkáč I. Field mapping without reference scan using asymmetric echo‐planar techniques. Magnetic resonance in medicine, 2000. 43(2): p. 319-323.
Figures