1569
Quality assurance of 8-channel transmit/receive switches for a 32-channel transmit/receive system at 7T UHF MRI1Erwin L. Hahn Institute for MR Imaging, Essen, Germany, 2High-Field and Hybrid MR Imaging, University of Duisburg-Essen, Essen, Germany, 3Medical Physics in Radiology, German Cancer Research Center (DKFZ), Heidelberg, Germany, 4Faculty of Physics and Astronomy and Faculty of Medicine, University of Heidelberg, Heidelberg, Germany
Synopsis
With increasing number of transmit and receive channels it becomes more and more important to monitor the behavior of the RF chain over time since weaknesses of custom-built hardware need to be known to the investigator. In this work, a quality assurance procedure for four identical 8-channel transmit/receive switchboxes for a 32-channel transmit/receive MR system at 7T is presented. In repeated measurements of a homogeneous phantom with an 8-channel transmit/receive coil, metrics like flip angle distribution, SNR and noise correlation are used to automatically assess quantitatively if significant changes of the hardware did occur.
Introduction
Ultrahigh-field (UHF) MRI at 7T and above provides an increase of signal-to-noise ratio (SNR) (1). However, the increase of the Larmor frequency to 300 MHz at 7T requires multi-channel radiofrequency (RF) technology to optimize signal excitation using parallel transmit techniques (pTx) (2,3). First results with 32 independent RF transmit channels (4) were already demonstrated for 7T MRI. In order to use several different dedicated RF coils, the application of multipurpose transmit/receive (TxRx) switchboxes is reasonable. For safety reasons and in order to monitor potential changes of the hardware, quality assurance (QA) can be performed to demonstrate the stability of a system or parts of it. In this work, a QA procedure for 7T is presented to validate the stability and robustness of four TxRx switchboxes with 8 RF channels each, by using an 8-channel symmetrical head coil.Methods
All MR examinations where acquired on a 7T whole-body MRI system (Magnetom 7T, Siemens Healthcare GmbH, Erlangen, Germany) using a custom-built 8-channel TxRx RF head coil (Figure 1A) with microstrip line elements with meanders (5) driven in CP+ mode. This coil was loaded with a cylindrical phantom (Figure 1A) filled with a gelled Polyvinylpyrrolidone solution (6). In addition, a rectangular phantom was used to simulate the shoulders of a subject (6) for appropriate coil loading (Figure 1B). The 8-channel TxRx head coil was connected to the 8 BNC inputs of a custom-built 8-channel TxRx switchbox (Figure 1B). This measurement setup (Figure 1B) was used for 7T QA measurements (Figure 1C) with each of the four TxRx switchboxes (Figure 1D).
Each TxRx switchbox consists of 8 identical TxRx switches (Figure 2A) on a printed circuit board with a low-noise preamplifier (Wantcom, Chanhassen, MN, USA). The connection of the receive side (Figure 2A) for each board is realized using TIM cables (Total Imaging Matrix, Siemens Healthcare GmbH, Erlangen, Germany) while the connection to a custom-built transmit chain add-on (7) and to the coil is accomplished by BNC connectors. Each board (Figure 2B) is based on the same electrical schematic (Figure 2C). The presented TxRx switches can be used with any other TxRx coil at 7T. Quality assurance was accomplished by repeated measurement (4 weekly acquisitions) for each of the four TxRx switchboxes. One switch box was used to check system stability over a longer time course of 3 months. Flip angle distributions were measured using the B1+ mapping technique DREAM (8) with 5.0x5.0x5.0mm³ resolution, TR/TE1/TE2/TA = 6.5s/0.9ms/1.56ms/6.5s, bandwidth = 1610Hz/pixel and B1TIAMO (9) with 3.0x3.0x20.0mm³ resolution, TR1/TR2/TE/TA = 1000ms/5000ms/2.04ms/28s, bandwidth = 1560Hz/pixel.
Furthermore, signal-to-noise ratio (SNR) (10) was measured using 2 different methods: a low flip angle (10° nominal) GRE sequence with 2.0x2.0x2.0mm³ resolution, TR/TE/TA = 20ms/6ms/3min35s, bandwidth = 200Hz/pixel was used to calculate optimum SNR maps (including a noise correlation coefficient measurement). The SNR calculation with the difference method (11) was used with a repeated low flip angle (10° nominal) GRE sequence with 2.0x2.0x3.0mm³ resolution, TR/TE/TA = 120ms/5.1ms/36s, bandwidth = 260Hz/pixel.
Results and Discussion
An automatic MATLAB algorithm evaluates all data acquired during QA measurements. Figure 3 shows transversal (Figure 3A,B) and coronal (Figure 3C,D) phantom measurement results as well as the noise correlation coefficient matrix (Figure 3E) and the mean SNR for each of the 8 receive channels for one measurement (Figure 3F). The SNR maps (Figure 3A,C) allow for a quantitative assessment of the SNR over time. Flip angle maps (Figure 3C,D) demonstrate homogeneity of the excitation of the CP+ mode. All of these metrics allow the assessment of changes within the system over time.
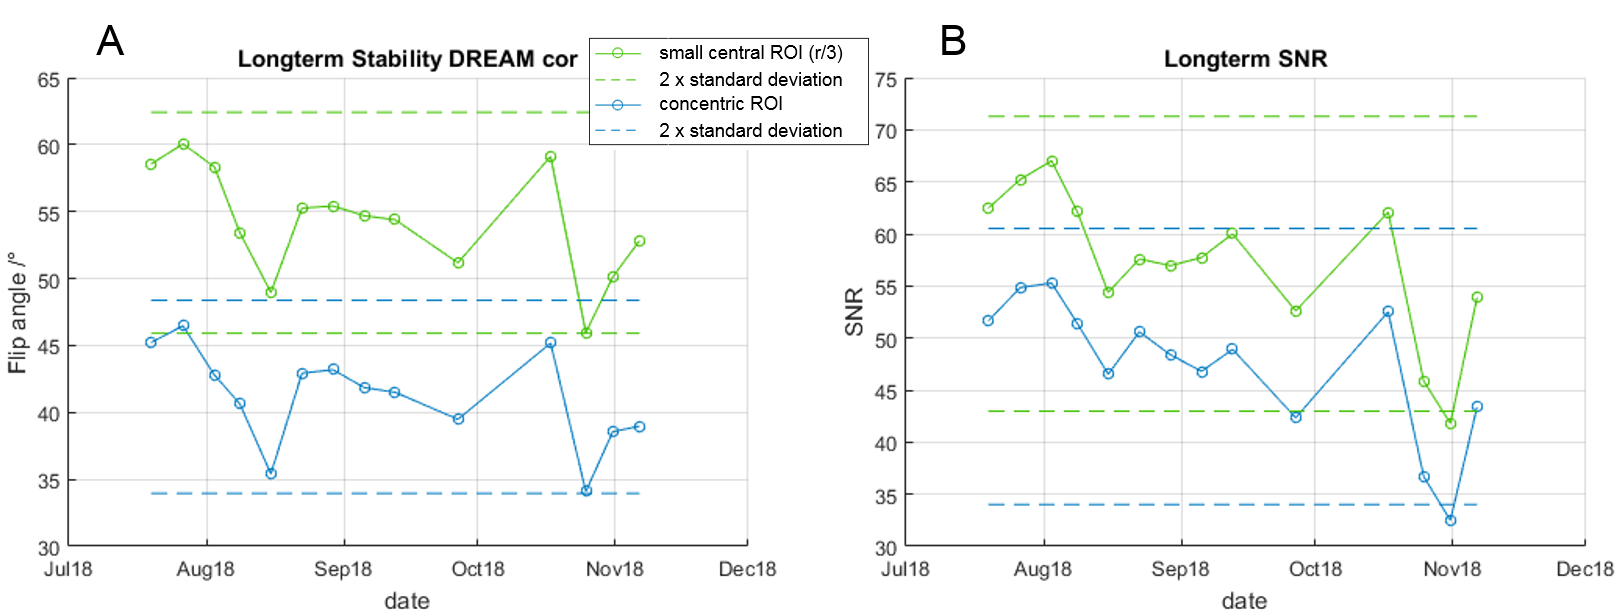
Figure 4A demonstrates minor variation of the positioning of the phantom and the coil in x-, y-, and z-direction for long-term QA measurements using switchbox #4. The long-term stability of the channel-dependent noise correlation coefficient indicates unexpected behavior end of October 2018 (Figure 4B) where the noise correlation coefficient is increased for most of the channels. This can be compared to the long-term supervision of the flip angle (Figure 5A) and SNR (Figure 5B). While during that failure the flip angle was not unexpectedly low, the SNR lied out of the confidence interval (2x standard deviation). This can be detected automatically, which allows quick switchbox- and channel-specific malfunction testing.
Conclusion
The investigated metrics like SNR, flip angle maps, noise correlation and the implemented MATLAB QA algorithm allow for quantitative assessment and monitoring of the transmit- and receive chain. Ongoing quality assurance of the switchboxes is important to supervise stability and functionality of the hardware. Users of custom-built hardware need to know the reliability and failure tolerances to assess the impact on their measurement results.Acknowledgements
The research leading to these results has received funding from the European Research Council under the European Union's Seventh Framework Programme (FP/2007-2013) / ERC Grant Agreement n. 291903 MRexcite and the German Research Foundation (DFG) / project German Ultrahigh Field Imaging / Grant n. LA 1325/7-1, QU 154/5-1.References
1. Pohmann R, Speck O, Scheffler K. Signal-to-Noise Ratio and MR Tissue Parameters in Human Brain Imaging at 3, 7, and 9.4 Tesla Using Current Receive Coil Arrays. Magn Reson Med 2016;75(2):1–9.
2. Mao W, Smith MB, Collins CM. Exploring the limits of RF shimming for high-field MRI of the human head. Magn Reson Med 2006;56(4):918–22.
3. Katscher U, Börnert P, Leussler C, van den Brink JS. Transmit SENSE. Magn Reson Med 2003;49(1):144–50.
4. Orzada S, Bitz AK, Gratz M, Johst S, Shooshtray S, Völker MN, Rietsch SH, Flöser M, Abuelhaija A, Oehmigen M, et al. A 32-channel transmit system add-on for 7 Tesla body imaging. Proc Intl Soc MRM 25 2017. p. 1219.
5. Orzada S, Kraff O, Schäfer LC, Brote I, Bahr A, Bolz T, Maderwald S, Ladd ME, Bitz AK. 8-channel transmit/receive head coil for 7 T human imaging using intrinsically decoupled strip line elements with meanders. Proc Intl Soc MRM 17 2009;3010.
6. Voelker MN, Kraff O, Pracht E, Wollrab A, Bitz AK, Stöcker T, Quick HH, Speck O, Ladd ME. Quality Assurance Phantoms and Procedures for UHF MRI - The German Ultrahigh Field Imaging (GUFI) Approach. Proc Intl Soc MRM 25 2017. p. 3912.
7. Bitz AK, Brote I, Orzada S, Kraff O, Maderwald S, Quick HH, Yazdanbakhsh P, Solbach K, Bahr A, Bolz T, et al. An 8-channel add-on RF shimming system for whole-body 7 Tesla MRI including real-time SAR monitoring. Proc Intl Soc MRM 17 2009. p. 4767.
8. Nehrke K, Börnert P. DREAM-a novel approach for robust, ultrafast, multislice B1 mapping. Magn Reson Med 2012;68(5):1517–26.
9. Brunheim S, Gratz M, Johst S, Bitz AK, Fiedler TM, Ladd ME, Quick HH, Orzada S. Fast and accurate multi-channel B1+ mapping based on the TIAMO technique for 7T UHF body MRI. Magn Reson Med 2018;79(5):2652–64.
10. Kellman P, Mcveigh ER. Image Reconstruction in SNR Units : A General Method for SNR Measurement. Magn Reson Med 2005;54:1439–47.
11. Firbank M, Coulthard A, Harrison R, Williams E. A comparison of two methods for measuring the signal to noise ratio on MR images. Phys Med Biol 1999;44(12):N261-4.
Figures