1521
Common Mode Analysis and SNR Performance of a Traditional Loop Coil versus an Integrated Balun Coil1Imaging Research Center, Cincinnati Children's Hospital Medical Center, Cincinnati, OH, United States
Synopsis
Common mode field distributions along a coaxial cable attached to a traditional loop coil and an integrated balun coil were analyzed using electromagnetic simulations. For comparison, an equivalent loop and an integrated balun coil were constructed and common mode voltages were measured along the coaxial cable attached to each coil. SNR performance of both coils was measured and analyzed in a phantom at 3T.
Introduction
Loop coils are widely used for the excitation and detection of signals in MRI. Loop coils are balanced transmission lines that are usually connected to a coaxial cable which is an unbalanced transmission line. This mismatch creates the potential for surface currents on the shield of the coaxial cable1. To block these surface currents, baluns are typically placed between the coil and the coaxial cable2 and at selected points along the cable. However, baluns are resonant structures that can interact with the loop coil. To reduce the number of components and avoid coil/balun interactions as well as to reduce component count, Integrated Balun Coils (IBC)3 have been introduced. In this abstract we analyze the common mode behavior along a coaxial cable of an IBC and compare it to that of a conventional loop coil using both electromagnetic simulations and well-controlled physical experiments. SNR measurements of physical coils were conducted using a phantom in a 3 Tesla MRI scanner.Materials and Methods
Coil simulation:
A traditional loop and IBC were modeled in HFSS (ANSYS). The loop coil was modeled with a 2.196mm diameter copper tube having a 0.26mm wall thickness. The coaxial IBC was modeled with the same diameter coaxial cable and copper tube. Both coils were modeled with an outer diameter of 30mm. Loading was simulated by placing the coil 5mm over a 15cm x 7.5cm x 15cm phantom with a conductivity of 1.55 S/m. Matching components were mounted on a circuit feedboard attached to the coil at a 90° angle from the coil plane. A coaxial cable with an overall shield length of 1174mm was attached to the feedboard input (Figure 1). At the end of the coaxial cable a 1mW 50Ω signal source was used for excitation. Field profiles were solved at 127.74MHz for both the loop coil and the IBC.
Physical coil implementation:
Two coils replicating the simulation were constructed with a final outer diameter of 30.07mm for the loop coil (Figure 2a) and 31.53mm of the IBC coil (Figure 2b). These coils were matched and tuned to a water bottle phantom containing a 2g/l NaCl solution doped with 1g/l SO4 with a matching better then -25dB at 127.74MHz.
Common Mode Measurement:
A common mode measurement probe4 was used to measure common modes along the coaxial cable for both coils. Twenty-seven peak-to-peak common mode voltage measurements at increments of 3.2cm along the coaxial cable of each coil were made with a Tektronix 2465B oscilloscope with 1MΩ coupling.
SNR Measurement:
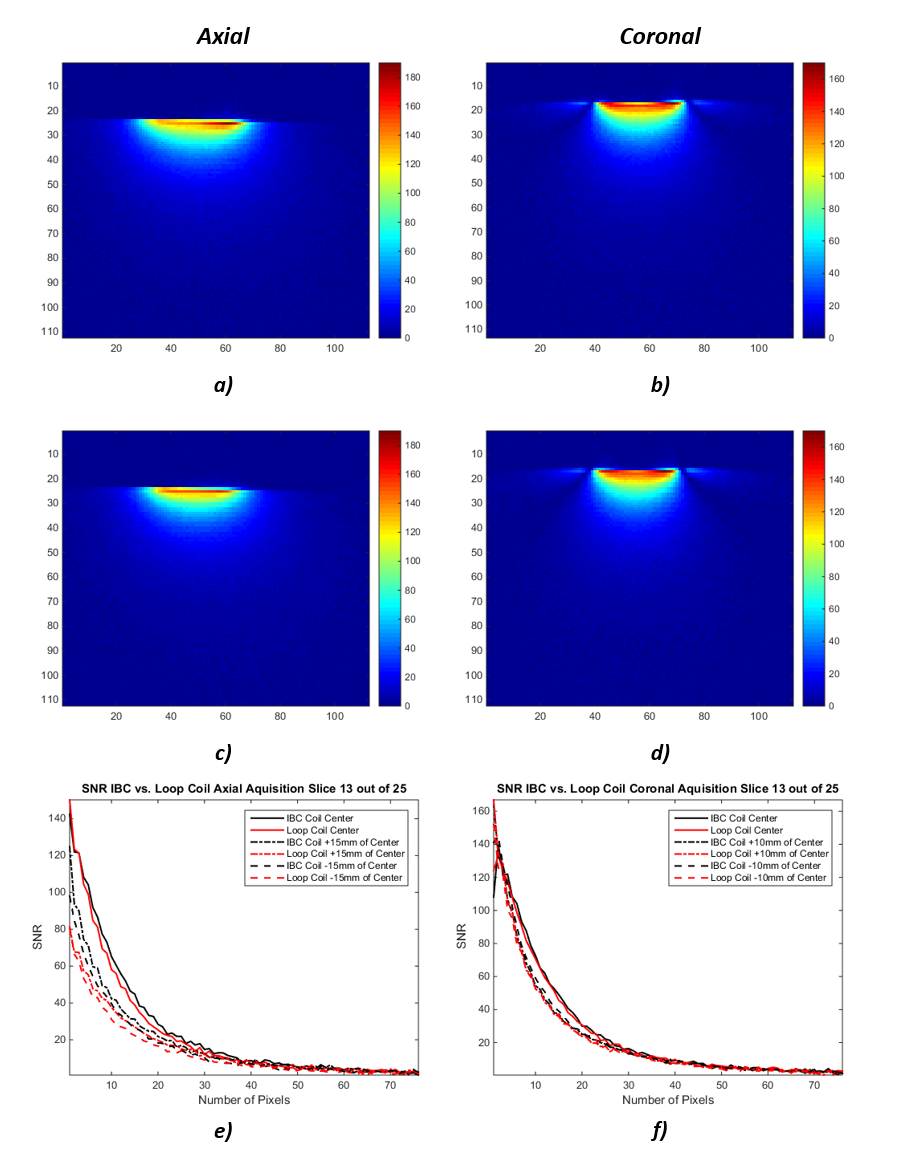
Imaging experiments were performed with both coils on the phantom at 3T. Data was acquired in the axial and coronal planes for each coil with a T2-weighted fast field echo pulse sequence with the following parameters: FOV=100x100mm, Matrix=121x112, NSA=1, flip angle=30°, TR=25msec, TE=shortest, voxel size=0.89mm3. SNR calculations were performed for each center slice. Three locations within that slice were analyzed: the center, -10mm, and +10mm from center for coronal slice, and the center, -15mm, and +15mm from center for axial slice.
Results
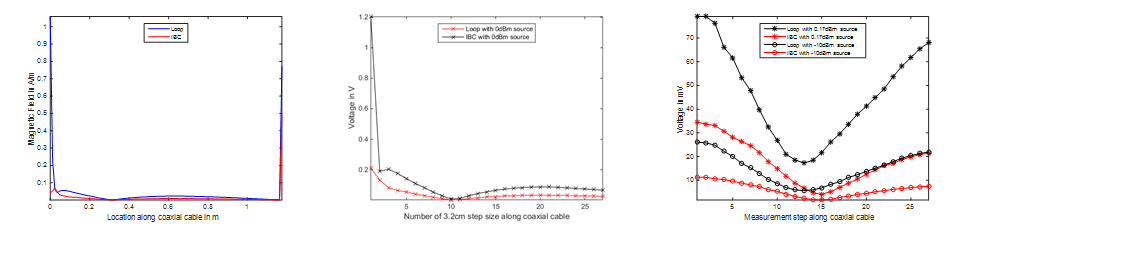
Simulations showed that the magnetic field amplitude along a straight coaxial cable is smaller for the IBC than for a traditional loop coil (Figure 3a). Calculated voltage values for a 3.2cm step size were higher in the simulation. Additionally, voltage minima were found at a different location in the simulation (Figure 3b). VNA source peak-to-peak voltage for 0.17dBm was 645mV. Taking the common mode measurement probe transformation ratio of 1.839:14 into account, actual maximum peak-to-peak voltages on the coax shield were 79mV for the loop coil and 34.6mV for the IBC at 0.17dBm. Minimum peak-to-peak voltages were 17.3mV for the loop and 4.1mV for the IBC respectively (Figure 3c). The IBC was found to have on average 8.5dB better common mode attenuation than the traditional coil. Both coils showed similar SNR profiles (Figure 4 a-d) and very similar SNR throughout the compared matrix columns in the same slice (Figure 4e-f). The higher SNR in some locations of the IBC can be attributed to the slightly bigger diameter of the IBC.Conclusion and Discussion
Field distributions along the coaxial cable determined by simulation and measurement confirmed that the IBC design offers 8.5dB attenuation of common mode signals compared to traditional loop coils. IBCs have the additional advantages of reduced component count and the ability to support smaller coil geometries. The difference in the location of common mode minima between simulation and measurements is presumed to be due to geometrical differences towards earth ground and the associated different common mode field patterns. Both coils had very comparable SNR profiles and performance.Acknowledgements
No acknowledgement found.References
1. Balanis C A. Antenna Theory. Wiley-Interscience: 3rd Edition 2005.
2. Zinke O, Brunswig H. Hochfrequenztechnik 1. Springer-Verlag: 6.Auflage 2000.
3. Loew W., Giaquinto R.O., Williams B., Lanier J.M., Ireland C., Pratt R., and Dumoulin C. An 8-Channel Integrated Balun Phased Array (IBPA) for Small Anatomical Features. ISMRM 2014, #1323.
4. Loew W, Giaquinto R O, Dumoulin C. A Dedicated Measurement Probe for Quantitative Common mode Measurements and Balun Efficiency. ISMRM 2017, #2653.
Figures