1441
Uncertainty Analysis of Torque Measurement Methods Described in ASTM F2213-171The xMR Labs, Department of Physics and Astronomy, University of Western Ontario, London, ON, Canada, 2Department of Medical Biophysics, University of Western Ontario, London, ON, Canada
Synopsis
With the prevalence of medical implants and MRI both on the rise around the world; patients, device manufacturers, and medical professionals alike should know how implants interact with the MR environment. One such interaction is the possibility of torque on an implant due to interaction with the main field. The current methods for measuring induced torque are published by ASTM International. However, although methods are available, their accuracy and precision have yet to be properly studied. This abstract investigates the measurement uncertainties of the two methods for measuring magnetically induced torque published in the test standard, ASTM F2213-17.
Introduction
The number of people with permanent or semi-permanent medical implants has been increasing [1], a growth that is in parallel with the growth of MRI as a diagnostic tool not only in Canada [2] and abroad [3]. There is a need to know whether patients with medical implants that cannot be readily removed, can receive a scan without complications, one of which is the possibility of torque on the implant. The current test standard for measuring magnetically induced torque in medical implants is the ASTM F2213-17 [4] which lists five methods. Three of the methods are simply to determine if there is a significant amount of torque. The remaining two methods, the ones under consideration in this abstract, are the ‘torsional spring’ and the ‘pulley’ methods, which aim to measure a quantitative torque value. The purpose of this work is to identify and compare the measurement uncertainties in torque measurement methods published by ASTM International, and thereby aid in the selection of the appropriate method for any particular device or system.Methods
In the torsional spring method, a device is placed on a platform suspended on top and bottom by torsion springs. When there is a torque, the device rotates, and a deflection angle is measured. The sources of error are the instrument reading error for finding angular deflection and the error in the torsion spring constant. The dominant source of error for this method would likely be in measuring the deflection angle since the requirement to perform this method is a protractor with 1° increments.
In the pulley method a device is placed on rotatable surface, as shown in Figure 1, connected to a force sensor by a thread. The force sensor is slowly pulled away and the surface rotates a full 360°. The sources of error are the measurement errors from a force sensor and measurement of the radius of the apparatus. There is also an error in the ‘stickiness’ of the surface, the torque required to overcome static friction.
To find the error in static friction, measurements are made using the apparatus in Figure 1. As was in the pulley method, a lightweight thread was extended from the cylindrical support. Differing however, the thread was placed over a pulley and attached to a mass. The surface was divided into twelve 30° sections. For each, the mass suspended was incrementally increased until the weight was enough to set the surface in motion. The method of changing the mass was to place staples into a small basket. Staples were chosen since individually, the mass is insignificant, but multiple staples have a noticeable change in a tangible quantity.
For a function, $$$x$$$, such that $$$x=f(u_1,u_2,...,u_n)$$$, the uncertainty, $$$\delta_x$$$, based on known sources of error is propagated by [5],
$$\delta_x^2=\delta_{u_1}^2\left(\frac{\partial x}{\partial u_1}\right)^2+\delta_{u_2}^2\left(\frac{\partial x}{\partial u_2}\right)^2+...+\delta_{u_n}^2\left(\frac{\partial x}{\partial u_n}\right)^2$$
The equation above is true when all independent variables are uncorrelated. An expression for measurement uncertainty of each methods can be calculated and propagated to see how uncertainty changes with torque.
Results
Observations on what masses at which angular intervals caused the rotating surface to move is shown in Figure 2. The static friction profile of the surface is represented by four observations labelled from 0 to 3. A histogram of the number of instances of movement for each mass is shown in Figure 3. The standard deviation of Figure 3 comes to 1.394 g which gives rise to 0.693 mNm. Within the first standard deviation, where the majority of observed rotations occurred, is the region of interest. $$$\delta_{F_s}=0.693\ \mathrm{mNm}$$$ becomes an estimate for a source of systematic error that will be used in the error propagation.Discussion and Conclusion
The propagation of torque and measurement uncertainty starting from the smallest observed torque, 1.574 mNm is shown in Figure 4.The calibration report a real force sensor [6], listed a capacity of 1.11 N, a resolution of 4.46E-4 N, and $$$\delta_F=1.668\times10^{-3}\ \mathrm{N}$$$. Measurements using a digital caliper of the Figure 1 apparatus yields $$$R=50.72\ \mathrm{mm}$$$ and $$$\delta_R=0.01\ \mathrm{mm}$$$. The torsion spring method requires a spring constant, $$$k$$$, capable of measuring at least 1° intervals which yields $$$\delta_\theta=0.5^\circ$$$. For $$$\tau=1.574\ \mathrm{mNm}$$$, $$$k$$$ comes to be $$$\tau=1.574\times10^{-3}\ \mathrm{Nm}$$$ with an arbitrarily chosen $$$\delta_k$$$.
From Figure 4, as was anticipated, the dominant source of error in the torsion spring method was the instrument uncertainty of the protractor. When $$$\delta_k$$$ becomes negligible,$$$\delta_\tau$$$ is constant at $$$\delta_\tau=k\delta_\theta\sqrt{2}$$$. The dominant source of error in the pulley method is the systematic error of coming from static friction. For comparable measurements of torque, the pulley method, while considering all sources of error, fares better than the torsion spring method.
Acknowledgements
The authors acknowledge financial support from NSERC and the Ontario Research Fund.References
[1] R. Kalin and M. S. Staton, “Current clinical issues for MRI scanning of pacemaker and defibrillator patients.,” J. Am. Med. Assoc., 2011.
[2] Canadian Agency for Drugs and Technologies in Health (CADTH), “The Canadian medical Imaging Inventory, 2017” 2017
[3] Organisation for Economic Co-operation and Development (OECD), “Health at a Glance 2017” 2017
[4] ASTM International, “F2213-17 Standard Test Method for Measurement of Magnetically Induced Torque on Medical Devices in the Magnetic Resonance Environment”
[5] P. R. Bevington and D. K. Robinson, Data Reduction and Error Analysis for the Physical Sciences, Third Edition. McGraw-Hill Higher Education. 2002.
[6] Mark-10 Corporation, "MR03-025 Force Sensor"
Figures
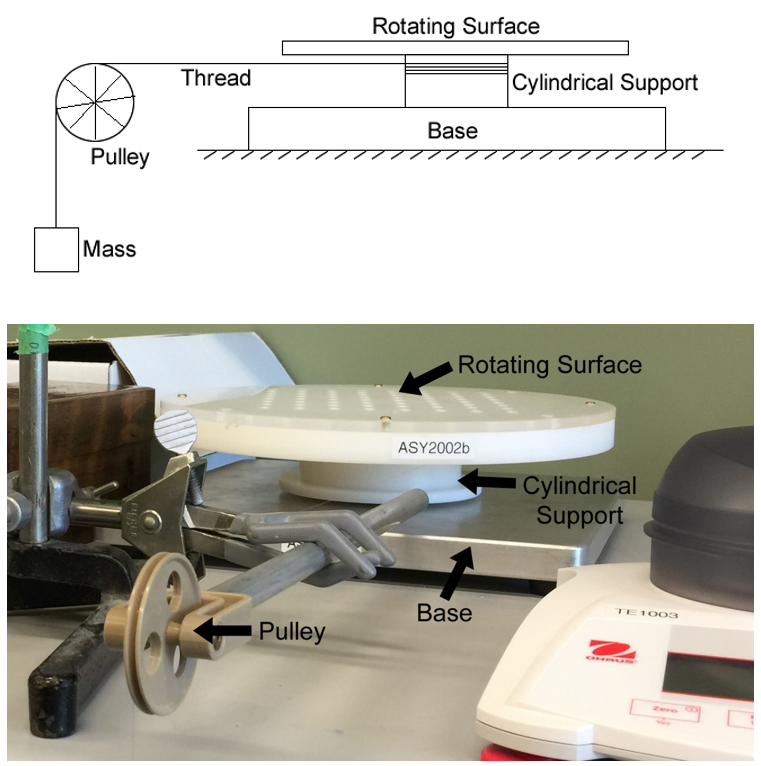
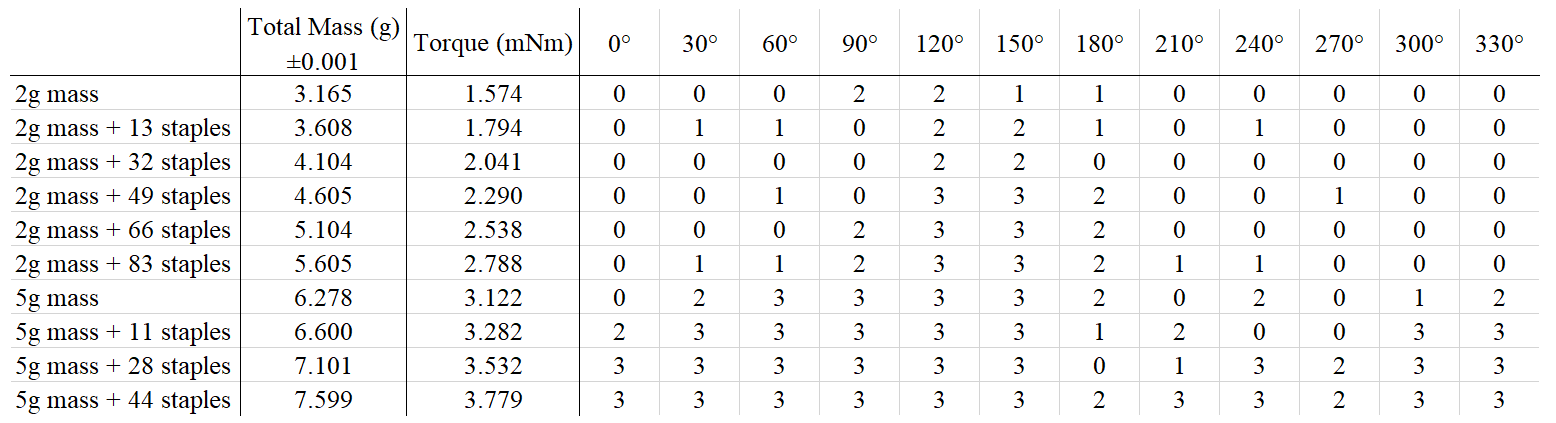
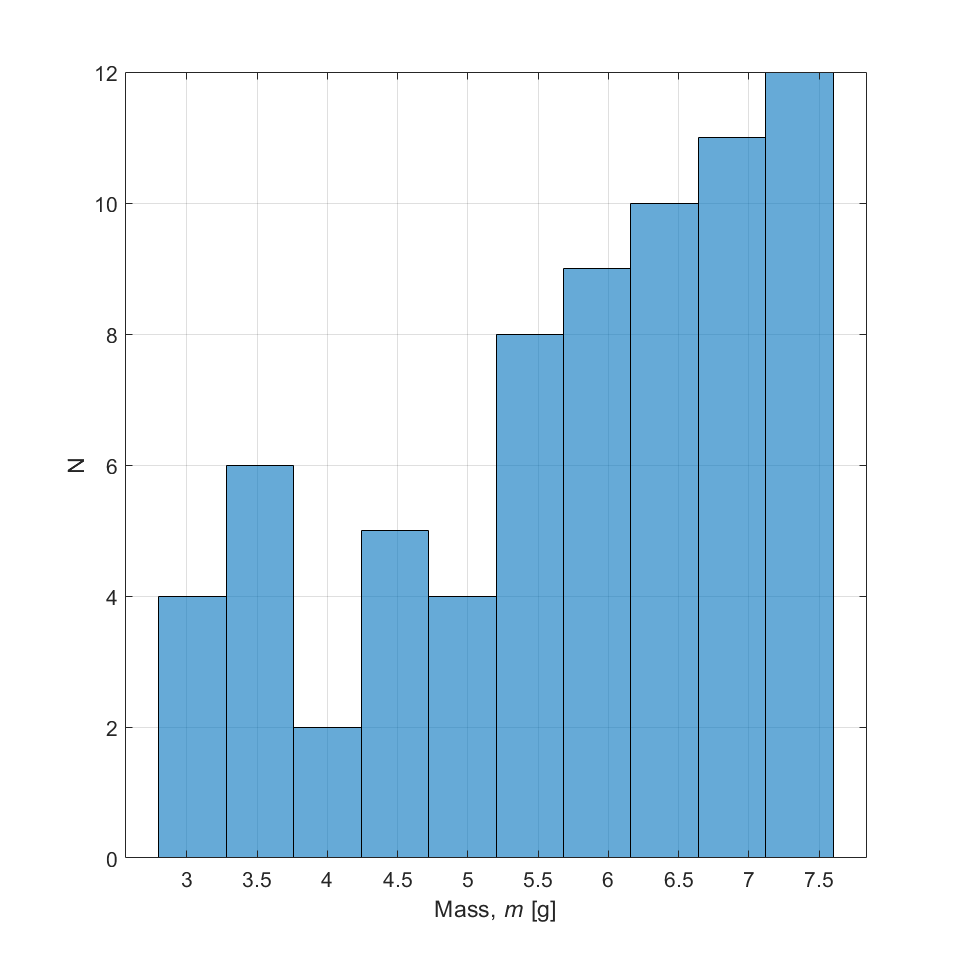
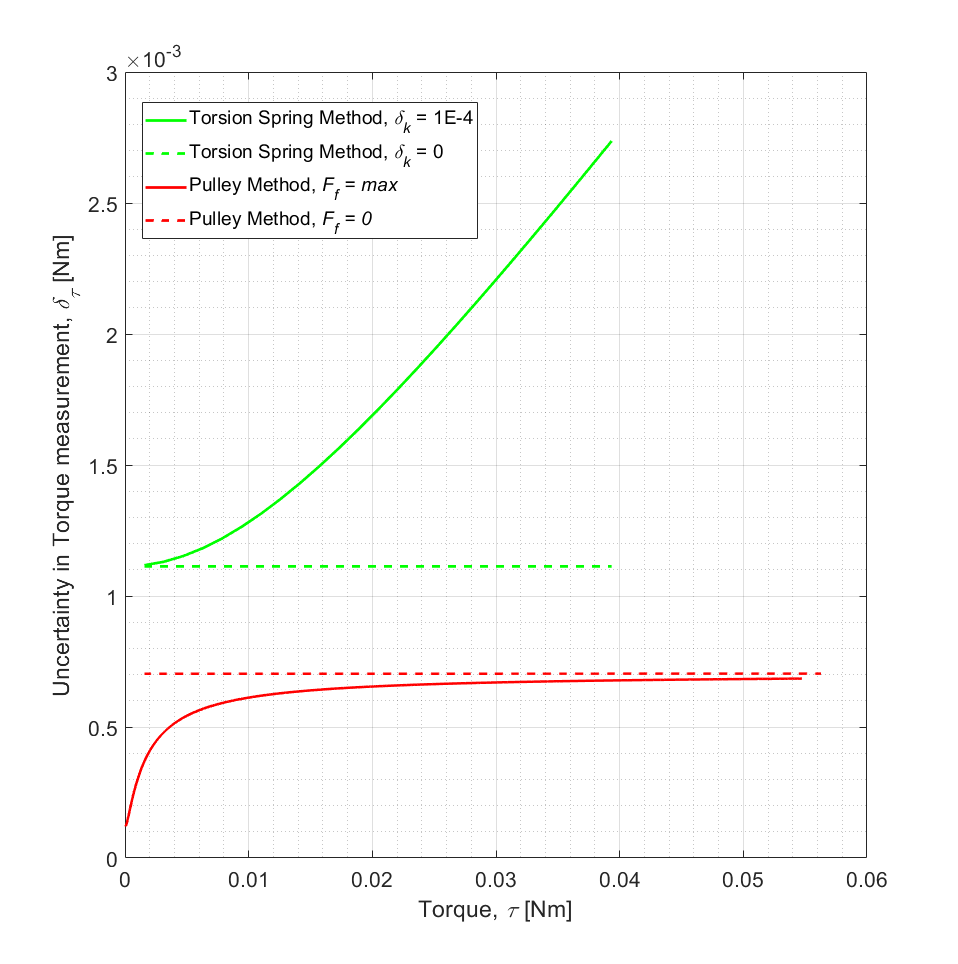
Figure 4: Propagation of errors as a function of calculated torque based on the error propagation equation. For the torsion spring method, uncertainty was propagated from 1.574 mNm until the torque calculated at 25°. With an uncertainty expression of $$$\delta_\tau=k\Delta\theta\sqrt{(\frac{\delta_k}{k})^2+2(\frac{\delta_\theta}{\Delta\theta})^2}$$$. $$$\delta_k$$$, which at first is negligible, becomes a more dominant source of error with greater angular deflection. For the pulley method, uncertainty was propagated until the torque calculated at 1.11 N with an expression of $$$\delta_\tau=R(F-F_f)\sqrt{(\frac{\delta_R}{R})^2+2(\frac{\delta_F}{F-F_f})^2+(\frac{\delta_{F_s}}{R(F-F_f)})^2}$$$. With greater force readout, the effect of $$$\delta_{F_f}$$$ diminishes.