1438
A subtle reaction of neonatal cochlear function after exposure to 3.0T MRI noise with hearing protection1Department of Radiology, The First Affiliated Hospital, Xi’an Jiaotong University, Xi'an, China, 2MR Research China, GE Healthcare, Bei Jing, People's Republic of China, Xi'an, China
Synopsis
Although 3.0T MRI has been increasingly used for neonates, the strong noise remains a great concern. This study aimed to estimate the effect of MRI noise on neonatal cochlear function. Thirty ears of 17 patients with no hearing impairment were enrolled. Distortion product OAE (DPOAE) tests were performed to estimate the cochlear function. Significant increase of mean DPOAE amplitude by 1.13 dB at 3kHz was found within 30 minutes after MRI. Besides, standard deviations of DPOAE amplitude differences remarkably increased. A subtle reaction in cochlear function was found in neonates after exposure to 3.0T MRI noise with hearing protection.
Introduction
Although MRI has become a clinically-favored exam for neonates due to its non-invasive and no radiation1, the produced acoustic noise remains a great concern and may affect auditory system. The peak sound pressure levels (SPLs) of 3.0T MRI ranged from 122-131 dBA2. However, regulatory guidelines remains absent for neonatal acceptable sound levels during a short-term noise exposure. It is recommended that neonatal noise exposure in transport incubators should not exceed 60 dBA and noise exposure to medical equipment must be restricted to levels below 99 dBA3-4. Thus, the acoustic noise is a risk factor for neonates during MRI even with hearing protection. With excellent sensitivity and frequency selectivity OAEs, provides earlier indications of cochlear damage when hearing threshold is still normal5-6.By using DPOAE, the aim of this study is to investigate the effect of MRI noise on neonatal cochlear function.Method
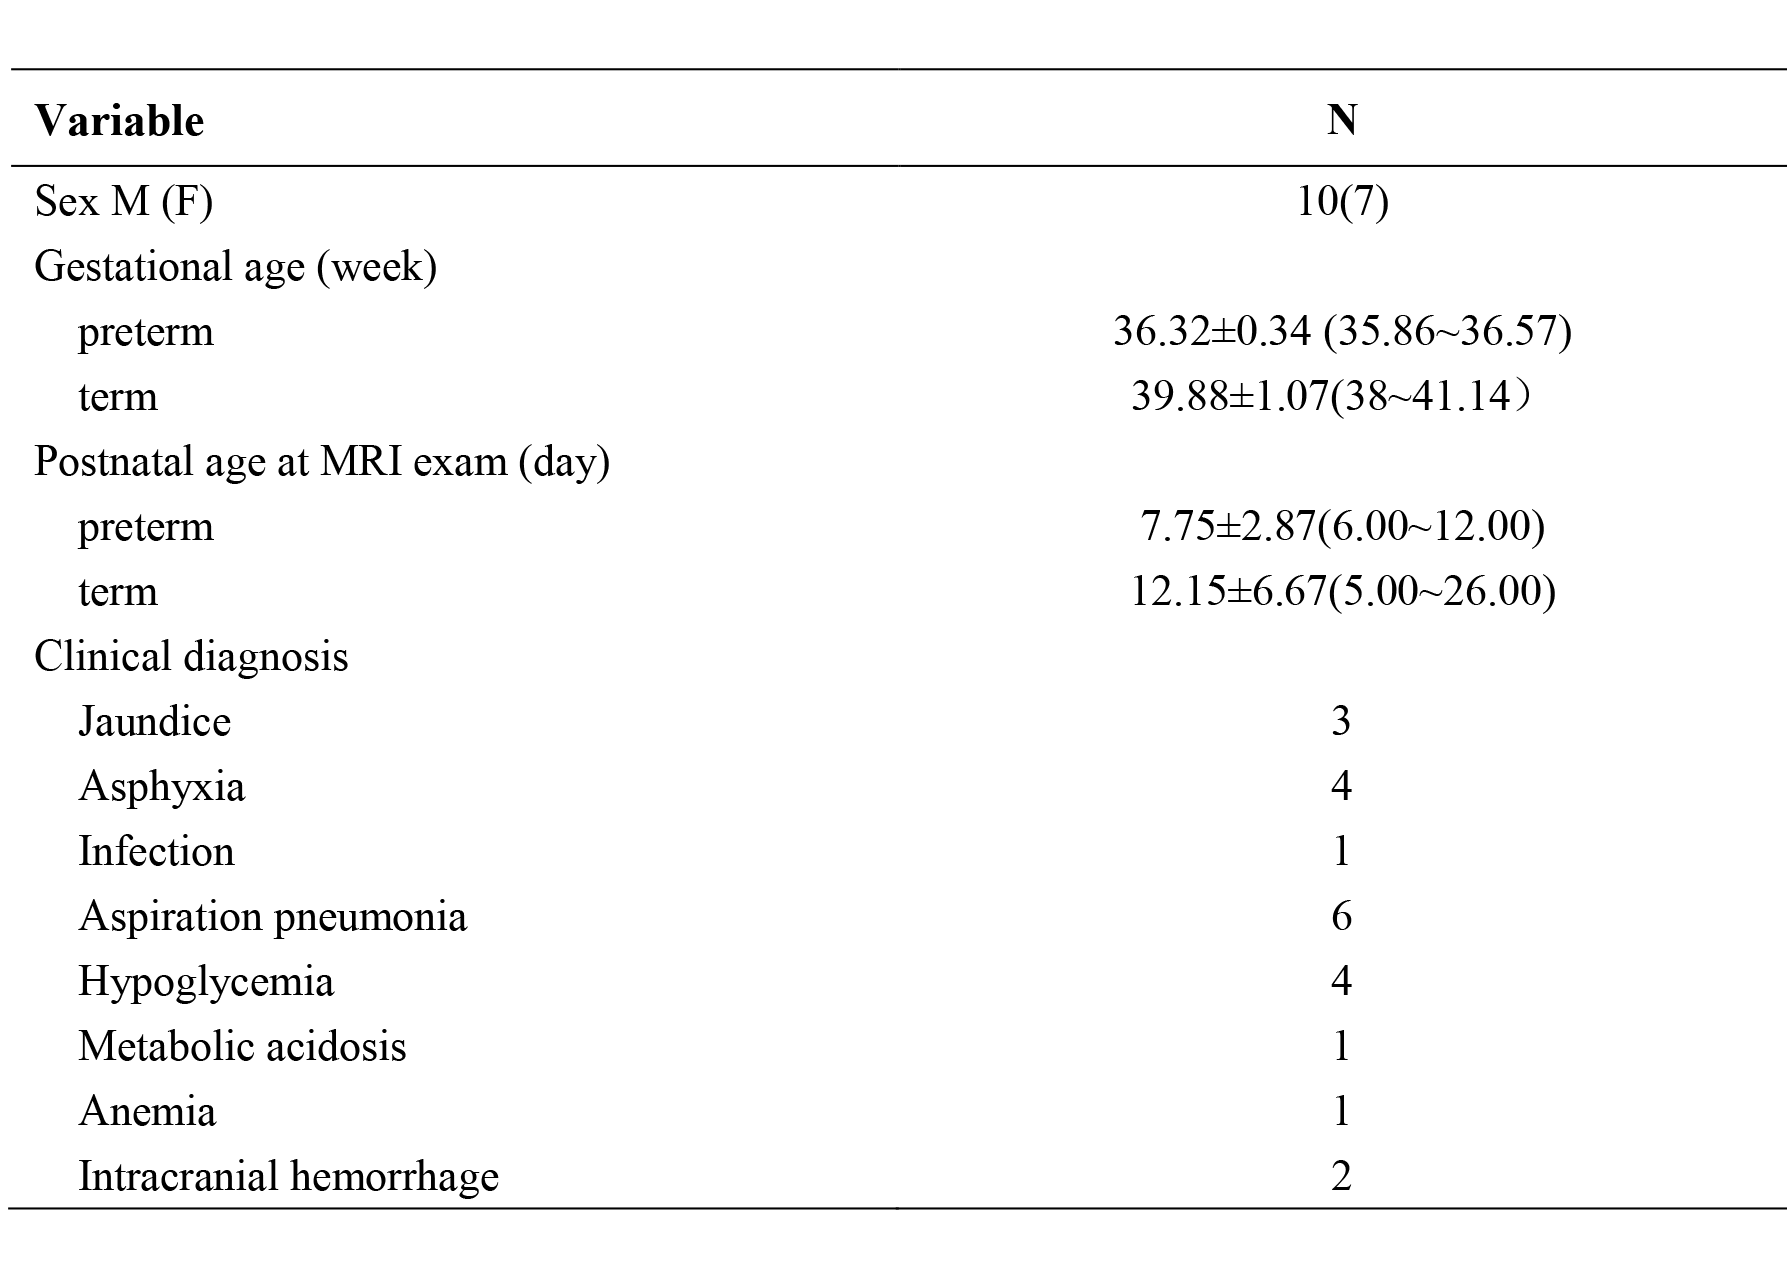
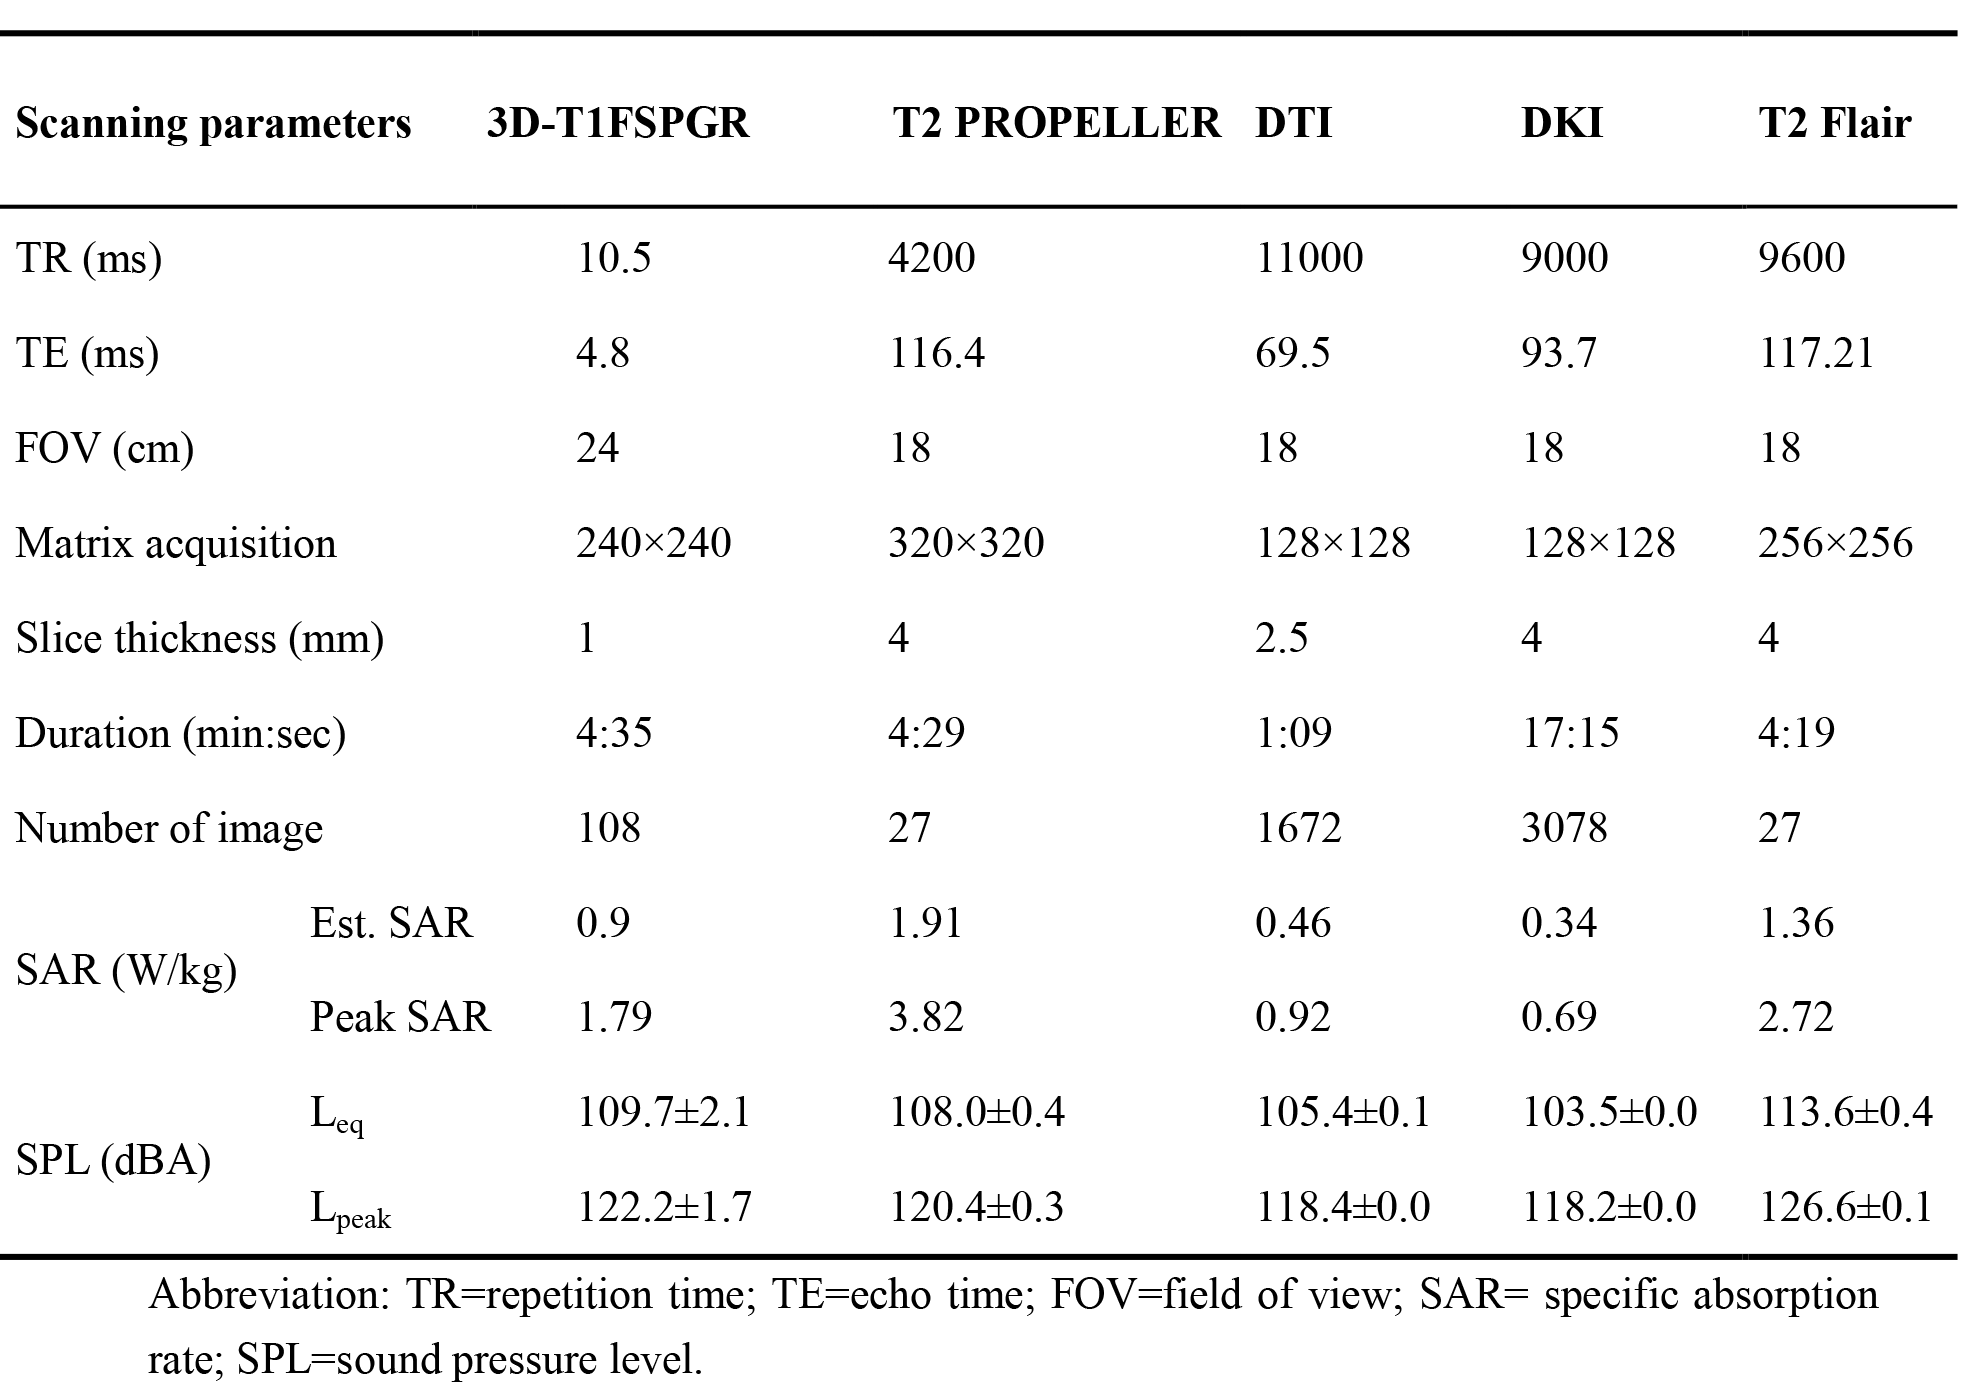
The study was approved by the local ethics committee, and informed consent was obtained from all patients.Thirty ears of 17 patients with no hearing impairment were enrolled from Department of Neonatology of the first author’s affiliation and underwent a 3.0T brain MRI examination. Four ears were excluded because of not pass the DPOAE test (n =3); not complete the DPOAE test (n = 1). The participant demographics and clinical information were shown in Table1.The scan parameters of MR protocols were shown in Table 2.By using Bio-Logic Navigator PRO Natus system, DPOAE was recorded in a quiet room. Before MRI, two DPOAE measures for each participant was performed, the first (test1) was recorded as baseline. The third DPOAE measurement (test3) was performed within 30 minutes after MRI. DPOAE amplitudes at frequency of 1.5~9.0 kHz were recorded. The standard deviations (SD) of differences of DPOAE amplitudes between test2 and test1, between test3 and test1 were calculated.Paired t-test was used to compare the DPOAE amplitude at frequencies of 1.5~9.0 kHz between before and after MRI. All statistical analysis were performed by SPSS 18.0 (SPSS, Chicago, IL, USA); P<0.05 was considered as statistically significant difference.Result
Measured
sound pressure levels in our study ranged from 103.5 to 113.6 dB (A), with
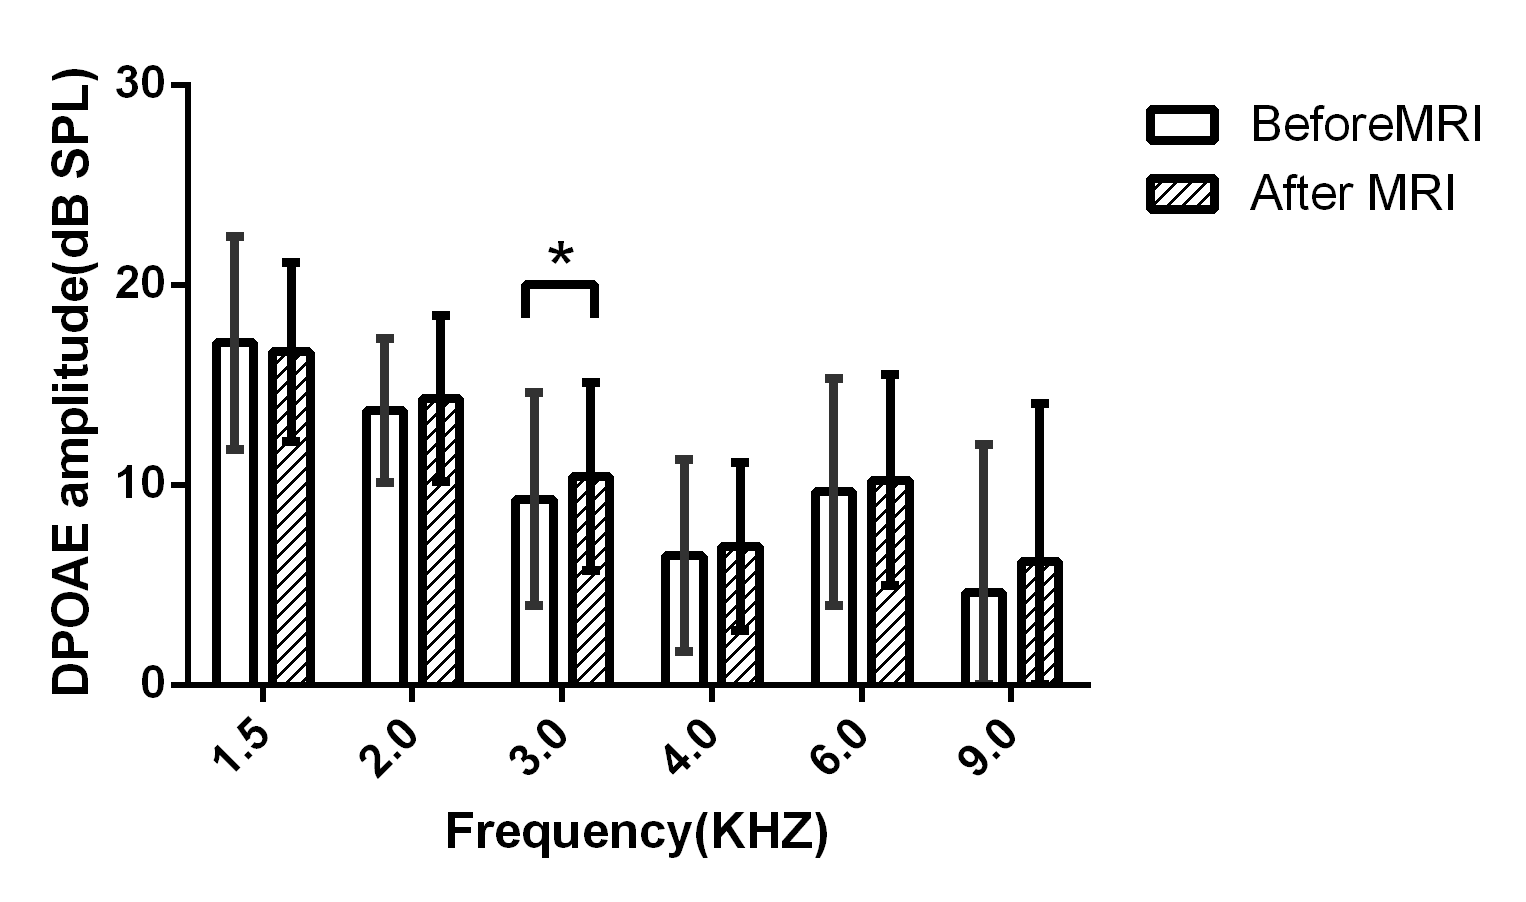
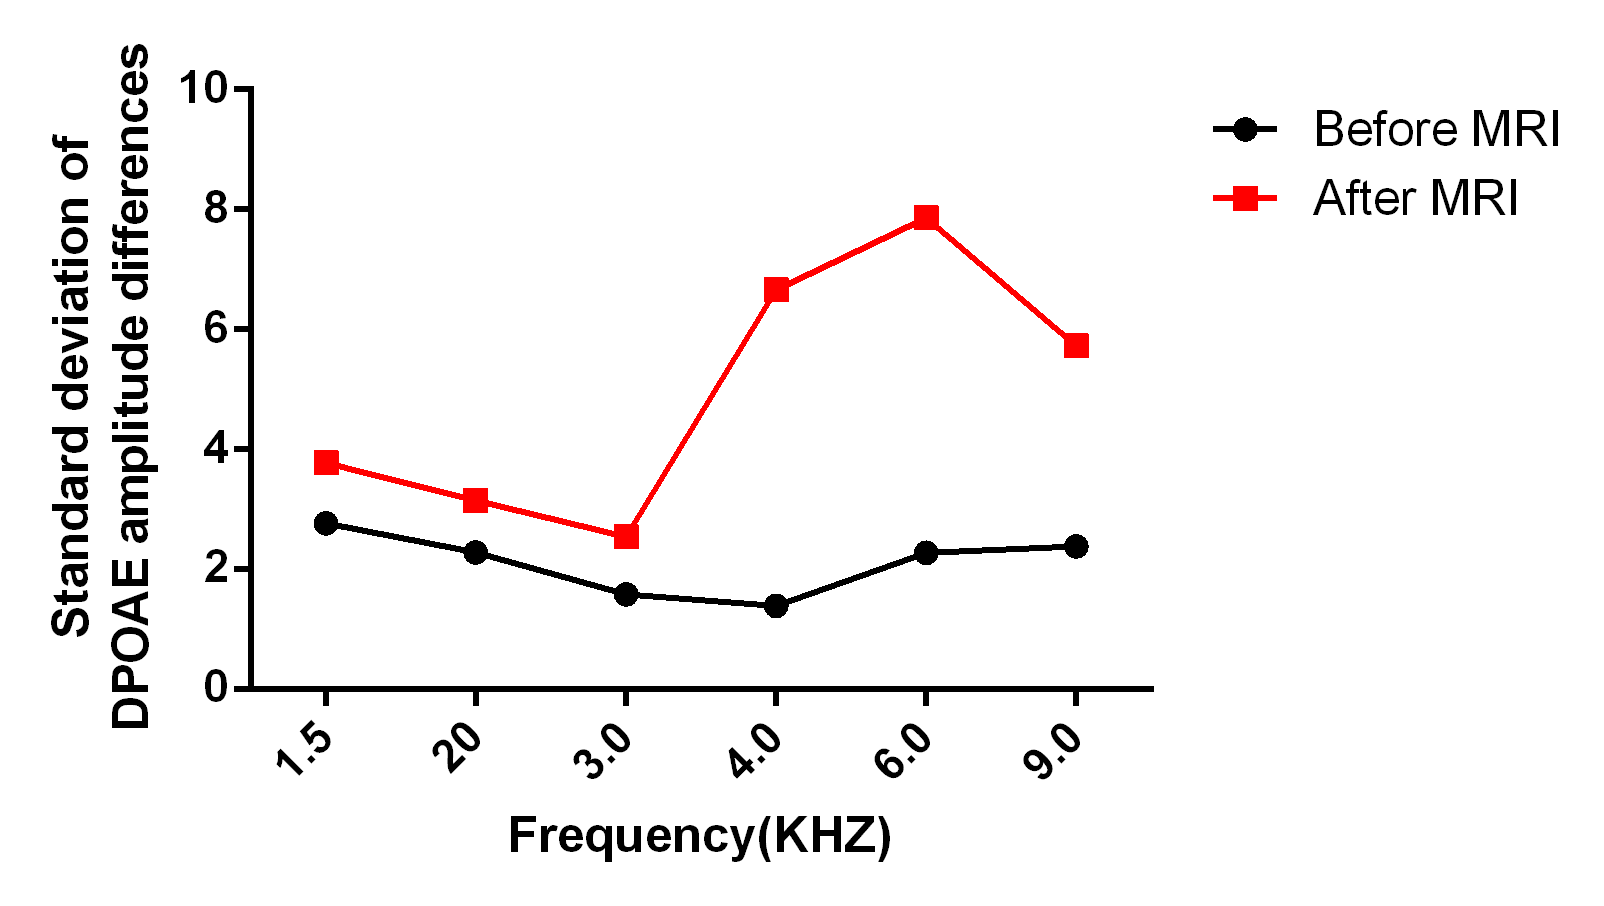
brief sound pressure peaks up to 126.6 dB SPL. We has found five frequencies demonstrated an increase in DPOAE amplitude following exposure to MRI noise (0.61 dB at 2 kHz, 1.13 dB at 3 kHz,0.47 dB at 4 kHz , 0.57 dB at 6 kHz , and 1.56 dB at 9 kHz) and there was a statistically significant at 3kHz (P<0.05; Figure 1). In contrast to those before MRI, the SD of differences of DPOAE amplitudes at frequencies of 1.5~9.0 kHz remarkably increased after MRI (Figure 2).
Discussion
In this study, we found an increase in DPOAE amplitude at 2-9kHZ after MRI and there was a statistically significant at 3kHz which may suggest a subtle change of cochlear function in neonates by 3.0T MRI noise. Previous studies have reported a “bounce” change in TEOAE after a 1.5 min noise exposure7. This ‘bounce’ effect may be attributed to oscillation in the regulation of the active amplification process of the outer hair cells. Besides, most effective in producing these bounce effects are tones well below the 1-2 kHz frequency band and levels between 100 and 110 dB SPL lasted for between 5 and 60 s. In our study, the enhancement in the cochlear (i.e. mean ) was lower than those in previous reports. It may be due to the longer noise exposure time and interval time of DPOAE measures after noise exposure.Furthermore, we observed the SD of DPOAE amplitudes at frequencies of 1.5~9.0 kHz remarkably increased after MRI. Wagner, et al. has found the increased DPOAE amplitude variability which indicated noise-induced effects which is not intense enough to cause OAE amplitude depression or temporary threshold shift, or both8. The SPLs reaching a patient’s ear were 79.5 -98.2 dBA and lasted 24.4 min, while our study has lower noise level of 82.5–92.6 dBA but longer time of 37.4 min. So the overall finding that MRI noise has a subtle reaction of cochlear function was the same as in our study.
Besides, we have observed an increase in DPOAE amplitude at high frequencies and standard deviations of DPOAE amplitude changes remarkably increased at high frequencies. Previous studies have pointed that cochlear region at high frequency, especially for 4kHz is more vulnerable to noise-induced hearing loss9. Such slight inconsistent with our results (3kHz) may be rooted in the noise frequency. It is known that noise-induced hearing loss also depends on the frequency of the sound to which the ear is exposed10.
Conclusion
Our
results found a subtle reaction of cochlear function in neonates after exposure
to 3.0T MRI noise with hearing protection.
Acknowledgements
This work was supported by the National Key Research and Development Program of China (2016YFC0100300), National Natural Science Foundation of China (No. 81471631, 81771810 and 51706178), the 2011 New Century Excellent Talent Support Plan of the Ministry of Education, China (NCET-11-0438) the Clinical Research Award of the First Affiliated Hospital of Xi’an Jiaotong University (No.XJTU1AF-CRF-2015-004)References
1.Raschle N, Zuk J, Ortiz-Mantilla S, et al. Pediatric neuroimaging in early childhood and infancy:challenges and practical guidelines. Ann. N.Y. Acad 2012; 1252:43-50.
2.Radomskij P, Schmidt MA, Heron CW, Prasher D. Effect of MRI noise on cochlear function. Lancet 2002; 359: 1486-88.
3.Macnab A, Chen Y, Gagnon F, et al.Vibration & noise in pediatric emergency transport vehicles: a potential cause of morbidity? Aviat Space Environ Med 1995; 66: 212-19.
4.McJury M, Shellock FG, et al. Auditory noise associated with MR procedures: a review. Magn Reson Imaging, 2000; 12(1):37-45.
5.Attias J, Furst M. Noise-induced otoacoustic emission loss with or without hearing loss. Ear Hear 1995;16:612-618.
6.Seixas NS, Kujawa SG, Norton S, et al. Predictors of hearing threshold levels and distortion product otoacoustic emissions among noise exposed young adults. Occup Environ Med 2004;61:899-907.
7.Kemp DT. Otoacoustic emissions, travelling waves and cochlear mechanisms. Hear Res 1986;22:95-104.
8.Wagner W, Staud I, Frank G, et al. Noise in Magnetic Resonance Imaging: No Risk for Sensorineural Function But Increased Amplitude Variability of Otoacoustic Emissions. Laryngoscope 2003;113:1216-1223.
9.Strainer JC, Ulmer JL, Yetkin FZ, et al. Functional MR of the primary auditory cortex: an analysis of pure tone activation and tone discrimination.AJNR Am J Neuroradiol, 1997;18(4):601-610.
10.Emmerich E, Richter F, Linss V, Linss W. Frequency-specific cochlear damage in guinea pig after exposure to different types of realistic industrial noise. Hearing Research 2005;201, 90-98.
Figures