1433
Feasibility and Repeatability of MR Fingerprinting in Knee Joints1Program of Advanced Musculoskeletal Imaging (PAMI), Cleveland Clinic, Cleveland, OH, United States, 2Electrical Engineering, Case Western Reserve University, Cleveland, OH, United States, 3Radiology, Case Western Reserve University, Cleveland, OH, United States
Synopsis
There is an increasing clinical need for improving early diagnosis and evaluation of early response after interventions and treatment in musculoskeletal disorders. Quantitative MRI is a promising tool towards these goals. However, quantifying relaxation times normally requires long acquisition time and is prone to B0 and B1 inhomogeneity and other imperfections. Moreover, it is difficult to optimize the acquisition parameters of conventional relaxation time imaging sequences to provide accurate T1 and T2 quantifications with a large range. MR fingerprinting (MRF) is a recently developed technique, which enables fast imaging and quantification of multiple tissue parameters simultaneously, and shows promising results in neural, body and cardiac imaging. However, the application of MRF to MSK imaging is very limited. The goal of this study was to demonstrate the feasibility and quantification repeatability of MRF in knee joints.
INTRODUCTION
There is an increasing clinical need for improving early diagnosis and evaluation of early response after interventions and treatment in musculoskeletal disorders. Quantitative MRI is a promising tool towards these goals as it provides evaluation of tissue compositions thus potential biomarkers sensitive to early and subtle changes with pathologies or treatments1. However, quantifying relaxation times normally requires long acquisition time and is prone to B0 and B1 inhomogeneity and other imperfections. Moreover, current quantitative MRI for musculoskeletal disorders normally focus on one tissue of interest, for example articular cartilage for osteoarthritis, which has very different T1 and T2 relaxation times compared to other tissues such as tendons and ligaments (which have very short T2s) and fluids and synovitis (which have very long T1s and T2s). It is difficult to optimize the acquisition parameters of conventional relaxation time imaging sequences to provide accurate T1 and T2 quantifications with a large range. MR fingerprinting (MRF)2 is a recently developed technique, which enables fast imaging and quantification of multiple tissue parameters simultaneously and shows promising results in neural, body and cardiac imaging3-5. However, the application of MRF to MSK imaging is very limited. The goal of this study was to demonstrate the feasibility and quantification repeatability of MRF in knee joints.METHOD
A 2D MRF scan with FISP readout6 was implemented with a FOV of 280x280 mm2, in-plane image resolution of 0.8x0.8 mm2, and slice thickness of 5mm for the knee scans in sagittal view. The acquisition time for a single shot spiral acquisition with 3000 time points was 45 seconds. After the acquisition, the highly undersampled images were reconstructed using NUFFT and the signal evolutions from these images were used to directly quantify T1, T2, and proton density (M0) maps simultaneously. An MRF dictionary was simulated with and without slice profile correction, with T1 ranging from 100 to 3000ms with a minimal step size of 10ms between 100 to 1000ms; and T2 ranging from 10ms to 500ms with a minimal step size of 0.5ms between 10 to 120ms. This resulted in a total of 36693 dictionary entries.
Two volunteers and three knees were scanned in compliance with the IRB using a 3T MR scanner (Siemens Healthcare, Prisma) with a 1Tx/15Rx knee coil (QED). To estimate the slice profile effects on the results, all the maps were reconstructed using the dictionary with and without slice profile correction. ROIs were defined in femoral cartilage, gastrocnemius muscle, synovial fluid, and meniscus and mean/SD of T1 and T2 values were calculated in each ROI. One knee was rescanned on the same day with repositioning between scan and rescan to evaluate the repeatability of the results by calculating the coefficients of variations (CVs).
RESULTS
Figure 1 compares the T1 and T2 results from a volunteer scan before and after slice profile correction. As can be seen from the difference maps, the slice profile correction in general increases T1 values and reduces T2 values. Figure 2 shows a proton density map acquired from a volunteer scan.
Table 1 shows the T1 and T2 relaxation times averaged over the knees scanned for femoral cartilage, gastrocnemius muscle, synovial fluid, and meniscus respectively. The values are comparable to the literature values7, with T2 values being slightly higher.
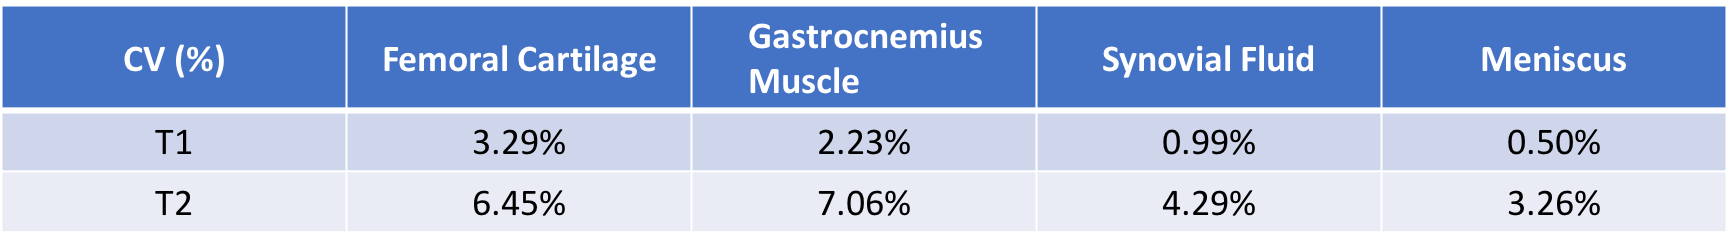
Table 2 shows the scan-rescan CVs of T1 and T2 quantifications using MRF. T1 has smaller variation than T2. The largest variation is in T2 for gastrocnemius muscle, which is around 7%.
CONCLUSION AND DISCUSSION
We demonstrated in this study the feasibility of MRF quantification in the knee joint with sub-mm in plane resolution and fine steps of T2 (0.5ms) in the dictionary. The T1 and T2 values obtained are close to those reported in the literature. The variation of T1 and T2 values between scan/rescans is small, suggesting excellent in vivo repeatability. Performing B1 correction may further improve the quantification of the relaxation times. Other features such as fat suppression and optimized k-space trajectory and downsampling for higher resolution will be further developed to optimize MRF techniques for MSK applications.Acknowledgements
The authors would like to acknowledge funding from Siemens Healthineers and NIH grants NIH 1R01EB016728References
1. Li X, Majumdar S. Quantitative MRI of articular cartilage and its clinical applications. J Magn Reson Imaging. 2013;38:991-1008.
2. Ma D, Gulani V, Seiberlich N, Liu K, et.al. Magnetic resonance fingerprinting. Nature 2013; 495:187–192.
3. Badve C, Yu A, Dastmalchian S, et al. MR Fingerprinting of Adult Brain Tumors: Initial Experience. American Journal of Neuroradiology. 2016;38(3):492-499.
4. Chen Y, Panda A, Pahwa S, et al. Three-dimensional MR Fingerprinting for Quantitative Breast Imaging. Radiology 2018;0:0-0
5. Hamilton JI, Jiang Y, Ma D, et al. Investigating and reducing the effects of confounding factors for robust T1 and T2 mapping with cardiac MR fingerprinting. Magn Reson Imaging. 2018;53:40-51.
6. Jiang Y, Ma D, Seiberlich N, Gulani V, Griswold MA. MR fingerprinting using fast imaging with steady state precession (FISP) with spiral readout. Magn Reson Med. 2015;74(6): 1621-1631.
7. Jordan CD, Saranathan M, Bangerter NK, et al. Musculoskeletal MRI at 3.0T and 7.0T: A Comparison of Relaxation Times and Image Contrast. Eur J Radiol. 2013;82(5):734-739.
Figures