1432
Evaluating Intraarticular Bleeding of Haemophilic Arthropathy Using Quantitative Susceptibility Mapping1Department of Medical Imaging,Nanfang Hospital,Southern Medical University, Guangzhou, China, 2School of Biomedical Engineering, Guangdong Provincial Key Laborary of Medical Image Processing, Southern Medical University, Guangzhou, China, 3Department of Hematology, Nanfang Hospital, Southern Medical University, Guangzhou, China, 4Philips Healthcare, Guangzhou, China
Synopsis
This work aims to explore the clinical application of quantitative susceptibility mapping (QSM) in evaluating the haemarrhrosis of heamophilic arthropathy with large heamosiderin. Our results showed that there was strong correlation between QSM and bleeding time, demonstrating that QSM has the potential to be a biomarker in evaluating the intraarticular bleeding of heamophilic arthropathy with large heamosiderin.
Introduction
Haemophilia is a rare, X-linked inherited bleeding disorder characterized by a deficiency of clotting factor VIII (haemophilia A) or IX (haemophilia B) in the coagulation cascade. Joints are affected in approximately 90% of patients with severe haemophilia. The first intraarticular bleeding episode typically occurs in boys aged 2–3 years and may result in haemophilic arthropathy, which is characterized by soft tissue and cartilage changes resulting from a chronic, self-perpetuating cycle of haemarthrosis–synovitis–haemarthrosis. Although medical management with factor prophylaxis is often effective, it is expensive and therefore requires follow-up tools to optimize its cost-effectiveness. Currently, MRI scoring scales can reflect the severe stage of haemophilic arthropathy, but cannot reflect small amount of intraarticular bleeding with large hemosiderin. The quantitative susceptibility mapping(QSM) can provide a new tool to evaluate the small amount of bleeding. A recent study has investigated QSM in intracerebral hemorrhages1, which inspires us to evaluate the intraarticular bleeding of heamophilic arthropathy and to monitor prophylactic therapy response with QSM.Methods
All exams were performed under protocols approved by the institutional review board and were HIPAA compliant. Fourteen patients with haemophilia B (range 4-21 years) were included in this study. There were 5 patients without bleeding in the joint in last year, and the other 9 patients with intraarticular bleeding between 0 to 285 days. A 3D multi-echo gradient-echo (GRE) sequence was implemented on a clinical 3T scanner (achieva, Philips) using the following parameters: TR=40ms, TE = 2.3, 4.6, 6.9, 9.1, and 11.4ms, FA = 20o, voxel size = 1.25 1.25 2, matrix size = 128 128 40 and total acquisition time = 3 min. In addition, A 2D proton-density weighted image (PDWI) was acquired with TR = 4000ms, TE = 30ms, FA = 90o, voxel size = 0.2 0.2mm2, and slice thickness = 3mm.
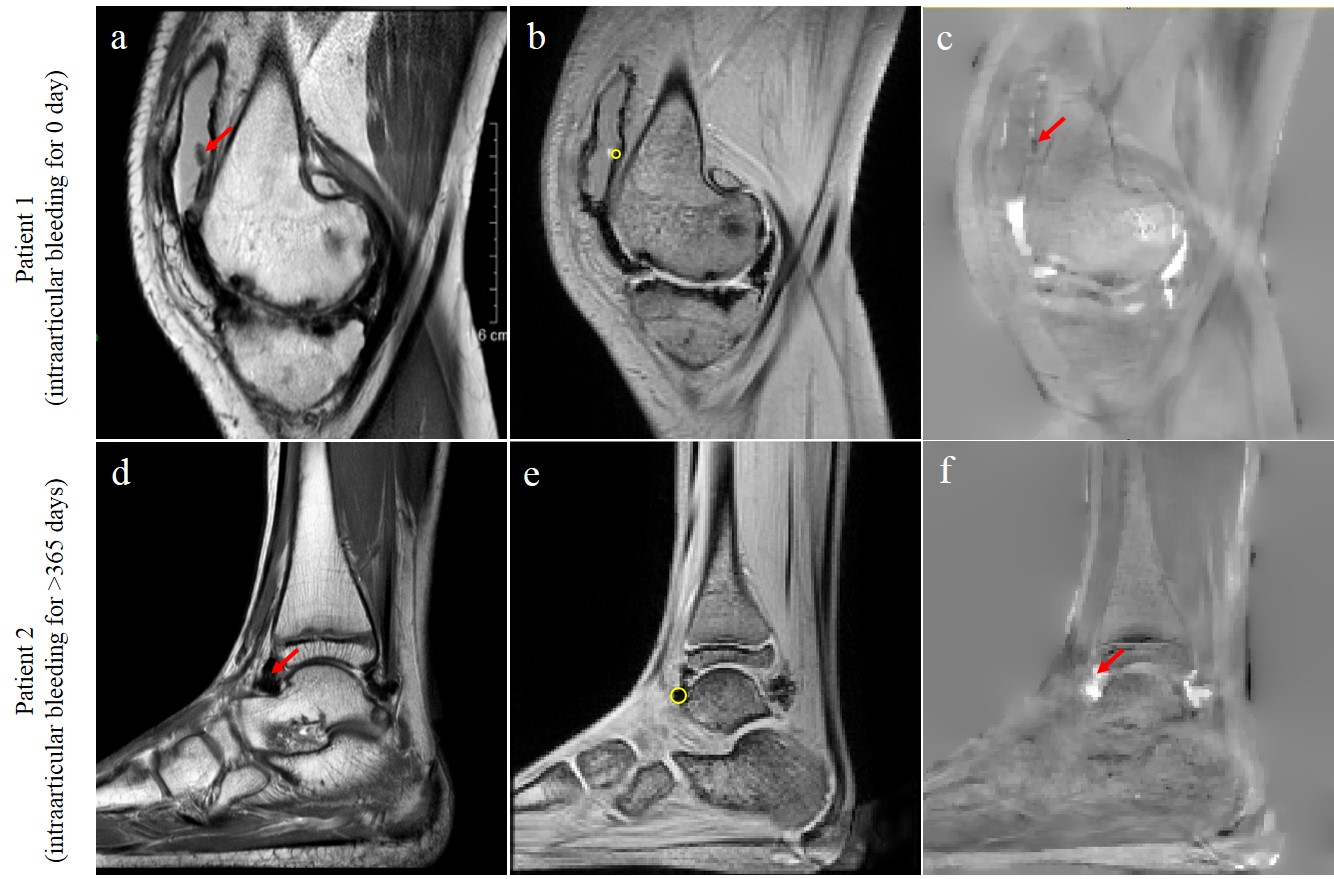
For QSM reconstruction, the total field was obtained from the complex image by using a nonlinear least square fitting method2, and was unwrapped by using a graph cuts approach3. The projection onto dipole field method was used for background field removal4, and QSM was computed by using the preconditioned field inversion method5. The region of interest (ROI) was drawn in the joint capsule on magnitude image (Fig. 1b), avoiding very low signals, and then the ROI was copied to QSM map for calculating the QSM value. The correlation coefficient between QSM value and the bleeding time was calculated by using a standard Pearson’s correlation.
Results
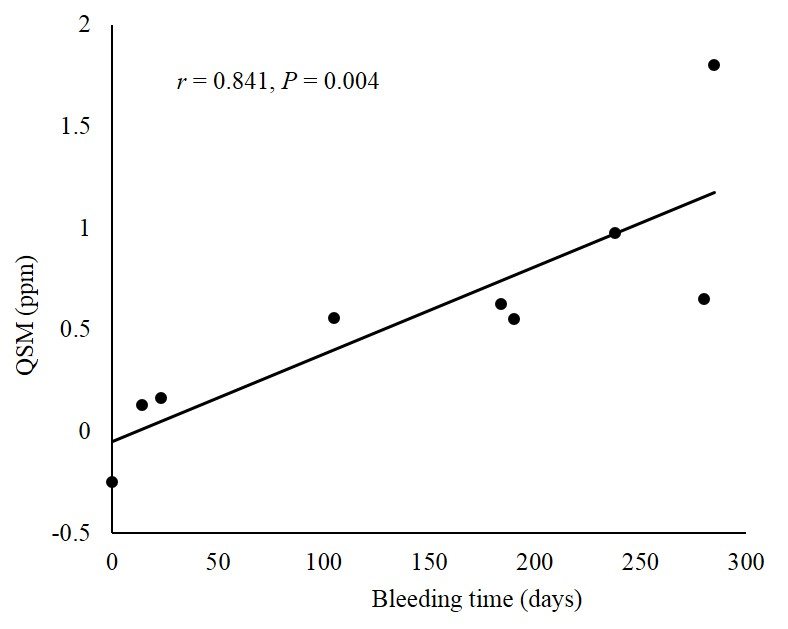
Figure 1 shows two haemophiliac patients with different bleeding time (0 day vs. more than 365 days) in the joint. For the magnitude image of PDWI, there is blood signal for the patient with 0-day bleeding (red arrow in Fig. a), while there is no blood signal for the patient with more than 365-days bleeding (red arrow in Fig. d). The magnitude image of GRE shows low signal in both patients (yellow circles in the middle column). The QSM is negative in the patient with 0-day bleeding (red arrow in Fig. c), while it is positive in the patient with more than 365-days bleeding (red arrow in Fig. f). The correlation coefficient between QSM and bleeding time is 0.841 (P=0.004), demonstrating the strong correlation between QSM and bleeding time (Fig. 2).Discussion
The results showed that there was strong positive correlation between QSM and bleeding time, demonstrating the QSM value was increased with bleeding time. It is well known that haemophilia involves bleeding in the joint. Since oxyhemoglobin is the main substance for the fresh bleeding and it is diamagnetic, it could explain the observed negative QSM value for the patient with 0-day bleeding time. Hemosiderin, a paramagnetic material, is increased with bleeding time. It could explain the observed strong positive QSM value in the patient with more than 365-days bleeding time.Conclusion
QSM is helpful in evaluating small intraarticular bleeding, and has the potential to be a biomarker for indicating bleeding time for the patient with haemophilia.Acknowledgements
NoReferences
[1]. Tan H, Zhang L, Mikati AG, et al. Quantitative Susceptibility Mapping in Cerebral Cavernous Malformations: Clinical Correlations. AJNR Am J Neuroradiol. 2016;37(7):1209-15.
[2] Lundin B, Manco-Johnson ML, Ignas DM, et al. An MRI scale for assessment of haemophilic arthropathy from the International Prophylaxis Study Group [J]. Haemophilia : the official journal of the World Federation of Hemophilia, 2012, 18(6): 962-70.
[3] Liu T, Wisnieff C, Lou M, Chen W, Spincemaille P, Wang Y. Nonlinear formulation of the magnetic field to source relationship for robust quantitative susceptibility mapping. Magnetic resonance in medicine : official journal of the Society of Magnetic Resonance in Medicine / Society of Magnetic Resonance in Medicine 2013;69(2):467-476.
[4]. Dong J, Liu T, Chen F, et al. Simultaneous phase unwrapping and removal of chemical shift (SPURS) using graph cuts: application in quantitative susceptibility mapping. IEEE transactions on medical imaging 2015;34(2):531-540.
[5]. Liu T, Khalidov I, de Rochefort L, et al. A novel background field removal method for MRI using projection onto dipole fields (PDF). NMR in biomedicine 2011;24(9):1129-1136.
Figures