1425
Quantitative MRI to assess disease activity change in children with juvenile idiopathic arthritis1Paediatric Rheumatology, Great North Children's Hospital, Newcastle upon Tyne Hospitals NHS Foundation Trust, Newcastle upon Tyne, United Kingdom, 2Institute of Cellular Medicine, Newcastle University, Newcastle upon Tyne, United Kingdom, 3Newcastle upon Tyne Hospitals NHS Foundation Trust, Newcastle upon Tyne, United Kingdom, 4Radiology, Freeman Hospital, Newcastle upon Tyne Hospitals NHS Foundation Trust, Newcastle upon Tyne, United Kingdom, 5Paediatric Radiology, British Columbia Children's Hospital, Vancouver, BC, Canada
Synopsis
Assessment of disease activity in children with juvenile idiopathic arthritis (JIA) is central to avoiding permanent joint damage. Affected joints are characterised by synovial proliferation resulting in synovial effusion and hypertrophy. Long-standing poorly controlled synovitis is associated with a high frequency of joint damage. 11 children with JIA were examined with quantitative MRI to measure synovial volume and rate of contrast uptake before and 12 weeks after routine intra-articular corticosteroid injection. All children showed marked reductions in synovial volumes, and in rates of uptake of gadolinium. These reductions were more consistent than changes in clinical assessments.
Introduction
Optimal assessment of disease activity in children and young people (CYP) with juvenile idiopathic arthritis (JIA, prevalence 1:1000 UK children 1) is central to high quality clinical care. Affected joints are characterised by synovial proliferation and inflammatory cell infiltration, resulting in synovial effusion and hypertrophy. Long-standing poorly controlled synovitis (inflammation of the synovium) is associated with a high frequency of joint damage and joint replacement surgery in adults with JIA 2. The advent of new biologic treatment agents and a growing evidence base in both adult-onset rheumatoid arthritis (RA) 3 and JIA 4, has led to an expectation that early aggressive therapy will improve remission rates, prevent joint damage and improve functional outcomes in JIA 5. Validated clinical measures include the juvenile arthritis disease activity score (JADAS) 6. Yet clinical examination alone is less sensitive than imaging-based diagnosis of synovitis, with MRI established as the gold standard 7,8. Quantitative MRI methods describing synovitis and response to treatment may provide a useful adjunct to clinical measures of disease activity.Methods
We assessed the response of CYP with JIA to routine intra-articular corticosteroid (IACI) by measuring clinical and MRI metrics at baseline and 3-months after IACI. Patients aged 4-16 years presenting with knee synovitis requiring IACI were eligible. Exclusion criteria included concurrent oral/intravenous steroid use, recent knee trauma, or IACI within past 6 months. The 3-variable juvenile arthritis disease activity score (cJADAS) was measured at both time points 9.The affected knee was examined using a Siemens 1.5T Espree and an extremity birdcage coil. The slice prescription was carefully matched at the post-treatment visit. The sequences included pre and post-contrast T1w-FS imaging to distinguish synovial enhancement. A T1w gradient echo was used to collect dynamic gadolinium uptake data before, during and after the injection of contrast agent. A single dose of gadoterate meglumine (0.2 ml/kg body weight) was administered after 2 dynamics and never reached the synovium before the 5th dynamic. The post-contrast T1w-FS TSE imaging was collected immediately after the dynamic series ended.
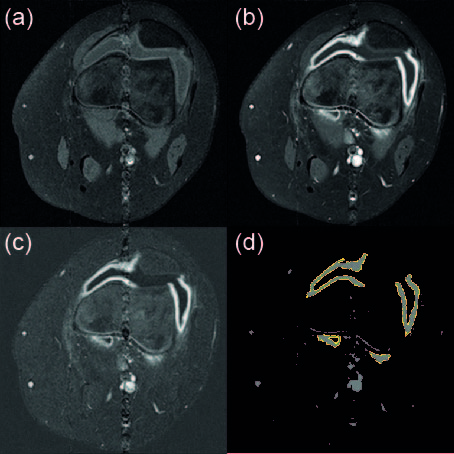
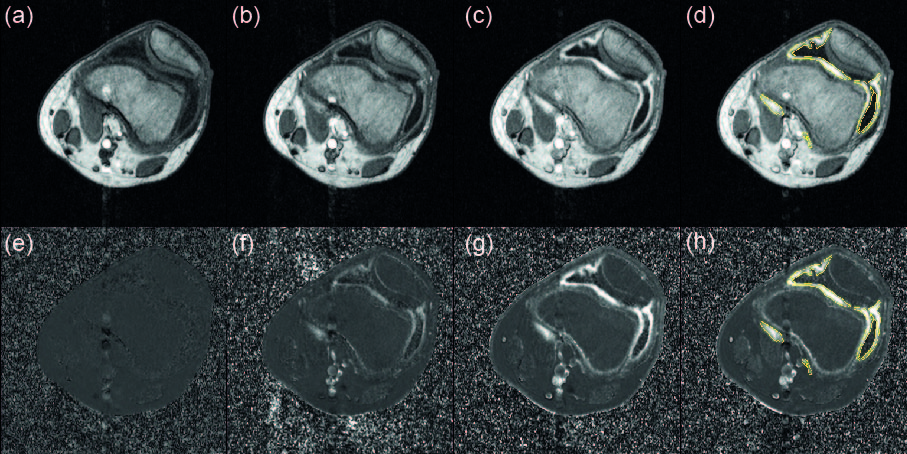
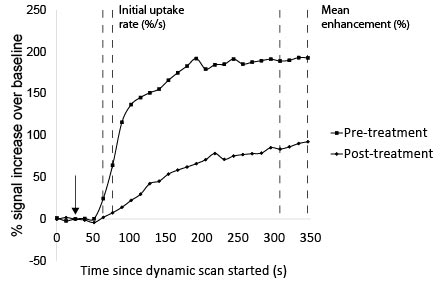
The MR images were reported by a radiologist and also quantitatively processed. The dynamic T1w sequence and the post-contrast T1w TSE were registered to the pre-contrast T1w TSE. A difference image was formed by subtracting the pre-contrast T1w TSE from the post-contrast T1w TSE (Figure 1) to highlight the intensity of gadolinium uptake. This image was thresholded to allow semi-automated delineation of the enhancing synovium from adjacent tissues (Figure 1d) by two observers. They worked independently using ImageJ to select areas of thresholded signal from the imaging volume that corresponded to synovium. The first four dynamics of the T1w series were averaged to produce a baseline intensity for each voxel for each slice. The signal in each voxel in each dynamic was expressed as a percentage change in intensity with respect to that baseline (Figure 2e-h). A custom macro in ImageJ applied the synovial segmentation to the dynamic images and calculated the volume weighted uptake curves for the synovium (Figure 3). The initial rate of uptake was estimated (in %/s) from the gradient of the first two measurements after the arrival of contrast in the synovium and the mean enhancement (in %) was calculated as the average percentage increase of the final four dynamics of the series (Figure 4).
Results
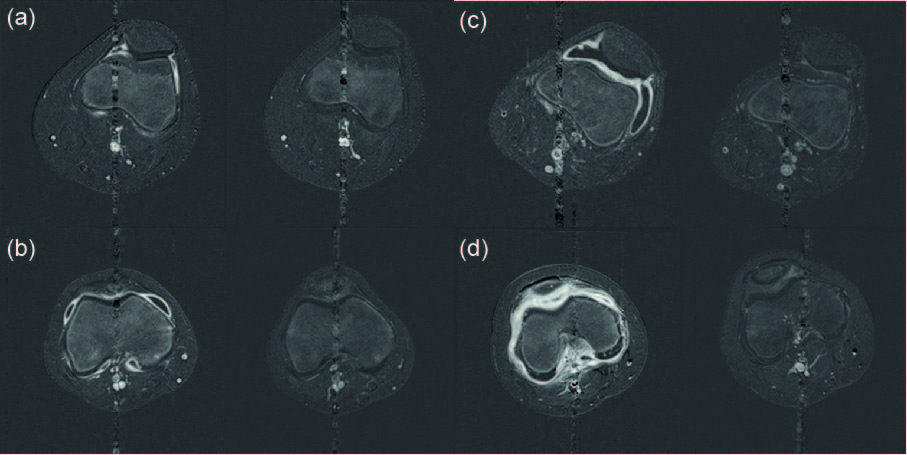
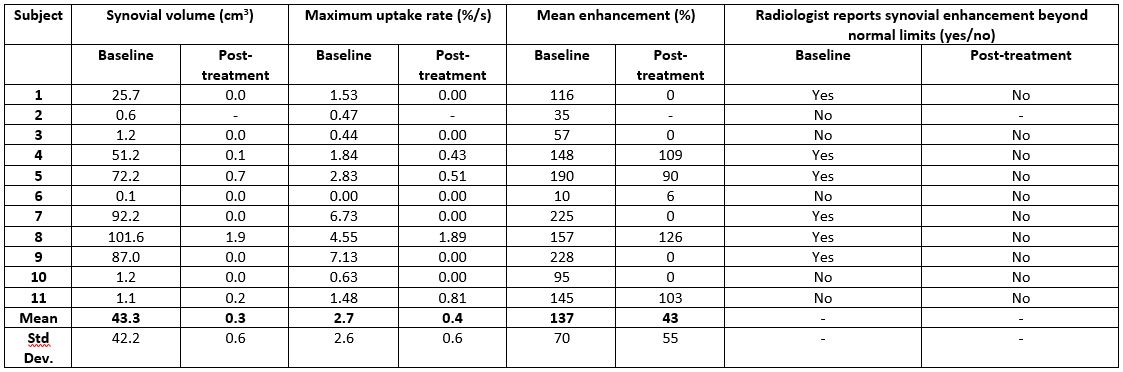
11 children (5 male) were recruited with median age 13 years (range 7-16), median disease duration 1.2years (0–11) and oligoarticular (n=8), polyarticular (n=2), psoriatic (n=1) JIA subtypes. 10 completed both assessments. Following IACI, the median cJADAS improved from 7.8 (2.0–15.6) to 1.6 (0–8.9), p=0.005, whilst the median synovial volume improved from 25.6cm3 (0.05–101.6cm3) to 0cm3 (0–1.9cm3) (p = 0.005, Figures 4 and 5). 6 patients had frank synovitis outside normal limits with a median synovial volume of 79.6cm3 (25.7–101.6cm3) that reduced to 0.1cm3 at follow-up (0–1.9cm3). The second group (n=3) had visible synovial enhancement, were called within normal limits but had a median synovial volume of 1.2cm3 (1.1–1.2cm3) that reduced to 0cm3 (0–0.2cm3) post-treatment. The remaining subject had a negligible volume that was unchanged (0.05cm3 vs. 0cm3). Rate of contrast uptake and mean enhancement decreased post-IACI for all subjects (Figure 5).Discussion
IACI led to a marked reduction in synovial volume on MRI scanning, whilst improvements in cJADAS were more variable. It was notable that the patient/parent global assessment component contributed the most to the cJADAS scores. Quantitative MRI identified more patients with a demonstrable synovial volume that improved with IACI in comparison to routine qualitative clinical reporting. Further work exploring the utility of quantitative MRI in a larger cohort and with different treatment modalities is indicated.Acknowledgements
This research and the support of JLB’s research time was supported by the Medical Research Council, UK, by a Confidence in Concept award (MC/PC/15030), with support from the NIHR Clinical Research Network North East and North Cumbria. We would like to acknowledge the assistance of Louise Fox (NuTH Radiology) in setting up our project and of the research radiographers Louise Jordan and Leoana McNamara (Northern Centre for Cancer Care MRI unit, Freeman Hospital) who helped acquire the MRI data.References
1 Symmons DP et al. , J. Rheumatol. 1996;23: 1975-80.
2 Malviya A et al., Clin. Rheumatol. 2009;28: 1411-7.
3 Anderson JJ et al., Arthr. Rheum. 2000;43: 22-9.
4 Tynjala P et al., Ann. Rheum. Dis. 2011;70: 1605-12.
5 Beresford MW et al., Arch. Dis. Child. Ed. Prac. 2009;94: 151-6.
6 Consolaro A et al., Arthritis Rheum. 2009;61:658-66.
7 Miller E et al., Am. J. Roentgenol. 2009; 192: 1209-1218.
8 Hemke R et al., Eur. Radiol. 2013; 23: 1998-2004.
9 McErlane F et al., Ann. Rheum. Dis. 2013; 72: 1983-8
Figures