1420
Clinical Feasibility of MAVRIC Based T2 Mapping Near Total Hip Arthroplasty1Hospital for Special Surgery, New York, NY, United States, 2Medical College of Wisconsin, Milwaukee, WI, United States
Synopsis
Morphologic MRI is commonly performed to assess the presence and extent of abnormal synovial reaction in total hip arthroplasty (THA) but relies on the reader’s training for an accurate diagnosis. Newly developed quantitative methods, including MAVRIC based T2 mapping, may provide a quantitative means for assessing synovial reactions. This study performed MAVRIC based T2 mapping on individuals with THA. Prolonged T2 values were found in subjects with synovitis. This study displays the feasibility of MAVRIC based T2 mapping near THA.
Introduction
MRI near total hip arthroplasty (THA) is challenging due to metallic susceptibility artifact that causes image distortion, pixel pile-up, and signal loss [1]. In a clinical setting, 2D FSE methods are effective at reducing susceptibility artifact [2] but newer 3D multi-spectral imaging techniques [3,4] sufficiently mitigate distortions to fully visualize the presence of osteolysis [5] and assess synovial reactions [6] near implanted devices. Quantitative MRI has been effective for assessing cartilage [7] and meniscus [8], but typically uses acquisitions that are rendered unusable near orthopaedic hardware. The purpose of this study was to assess the clinical feasibility of a MAVRIC based T2 mapping to assess soft tissue synovial reactions in subjects with THA. We hypothesized that T2 values would differ between subjects with and without a synovial reaction.Methods
This study was IRB approved with informed written consent. To date, the soft tissues surrounding 29 THA (17 ceramic-on-polyethylene, 10 metal-on-polyethylene, 2 ceramic-on-ceramic) from 27 subjects (11M/16F, 70±11 y.o.) have been evaluated. Images were acquired using a clinical 1.5T MR450W scanner (GE Healthcare, Waukesha, WI) with an 8 channel cardiac coil (Invivo, Gainesville, FL). Morphologic and susceptibility reduced images were acquired for each hip [2,4] and images were evaluated for the presence of synovitis, synovial thickness, synovial volume [6,9], and type of synovial reaction: fluid, solid, or mixed. The location and extent of synovial reaction were defined by a board certified radiologist. Following the morphologic THA imaging [10], a MAVRIC based T2 mapping sequence was acquired with the parameters: 2 TEs: 9.8/50ms, TR: 3.5s, matrix: 512x256, slice thickness: 3.5mm, FOV: 36-40 cm, ETL: 48, scan time: ~6min. T2 values were calculated [11] from the dual-echo acquisition, and a mean and SD was calculated for each hip. Statistical Analysis: A non-parametric t-test was performed to detect differences of synovial T2 values between subjects with and without a synovial reaction. A one-way ANOVA was performed to detect differences of synovial T2 values by type of synovial reaction and implant type. Spearman rank correlation was used to assess the relationship of synovial T2 values with synovial thickness and synovial volume. Statistical significance was p <0.05 (SAS V.9.3, Cary, NC).Results
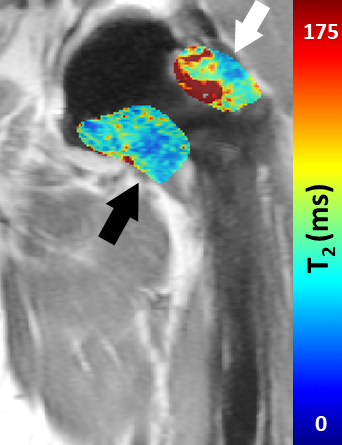
A majority of hips had synovitis present (23/29, 79%). A significant difference of synovial T2 values was detected between subjects with a synovial reaction (150±62ms) and subjects without a synovial reaction (78±31ms, p=0.008). Furthermore, a significant difference of synovial T2 values was detected based on synovial type, p=0.0192. Subjects with mixed and fluid synovitis had similarly prolonged T2 values, 121±72ms and 157±58ms respectively, compared to subjects with no synovitis, 78±31ms (Figure 1). Weak and insignificant correlations were found between synovial T2 values and synovial volume (ρ=0.35, p=0.06) and synovial thickness (ρ=-0.21, p=0.3). No differences in T2 values were found by implant type, p=0.5.Discussion
This study utilized a MAVRIC based T2 mapping method to quantitatively evaluate synovial reactions in subjects with THA. The results shows that this method can differentiate between subjects with and without synovial reactions, as well as type of synovial reaction. T2 prolongation in subjects with larger synovial volumes is attributed to the larger water content within the synovial expansion. No differences of T2 were found by implant type; however, further enrollment may aid in defining unique quantitative synovial reactions to a specific bearing material.Conclusion
MAVRIC based T2 mapping is feasible in a clinical setting and is capable of detecting differences between individuals with and without synovial reactions to an implanted THA. Future work will correlate the quantitative T2 values with histologic examination of synovial tissues and also examine sources of error for this novel quantitative outcome measure.Acknowledgements
Research reported in this publication was supported by NIH/NIAMS R01AR064840. The content is solely the responsibility of the authors and does not necessarily represent the official views of the NIH.References
1. Koff MF, Shah P, Koch KM, Potter HG. Quantifying image distortion of orthopedic materials in magnetic resonance imaging. J Magn Reson Imaging. 2013;38:1083-1091.
2. Potter HG, Nestor BJ, Sofka CM, Ho ST, Peters LE, Salvati EA. Magnetic resonance imaging after total hip arthroplasty: evaluation of periprosthetic soft tissue. J Bone Joint Surg Am. 2004;86-A:1947-1954.
3. Lu W, Pauly KB, Gold GE, Pauly JM, Hargreaves BA. SEMAC: Slice Encoding for Metal Artifact Correction in MRI. Magn Reson Med. 2009;62:66-76.
4. Koch KM, Lorbiecki JE, Hinks RS, King KF. A multispectral three-dimensional acquisition technique for imaging near metal implants. Magn Reson Med. 2009;61:381-390.
5. Walde TA, Weiland DE, Leung SB, Kitamura N, Sychterz CJ, Engh CA, Jr., Claus AM, Potter HG, Engh CA, Sr. Comparison of CT, MRI, and radiographs in assessing pelvic osteolysis: a cadaveric study. Clin Orthop Relat Res. 2005;437:138-144.
6. Nawabi DH, Hayter CL, Su EP, Koff MF, Perino G, Gold SL, Koch KM, Potter HG. MRI Findings in Symptomatic vs. Asymptomatic Subjects Following MOM Hip Resurfacing Arthroplasty. J Bone Joint Surg Am. 2013;95:895-902.
7. Pedoia V, Li X, Su F, Calixto N, Majumdar S. Fully automatic analysis of the knee articular cartilage T1rho relaxation time using voxel-based relaxometry. J Magn Reson Imaging. 2016;43:970-980.
8. Koff MF, Shah P, Pownder S, Romero B, Williams R, Gilbert S, Maher S, Fortier LA, Rodeo SA, Potter HG. Correlation of meniscal T2* with multiphoton microscopy, and change of articular cartilage T2 in an ovine model of meniscal repair. Osteoarthritis Cartilage. 2013;21:1083-1091.
9. Nawabi DH, Gold S, Lyman S, Fields K, Padgett DE, Potter HG. MRI predicts ALVAL and tissue damage in MOM hip arthroplasty. Clin Orthop Relat Res. 2014;472:471-481.
10. Burge AJ, Gold SL, Lurie B, Nawabi DH, Fields KG, Koff MF, Westrich G, Potter HG. MR Imaging of Adverse Local Tissue Reactions around Rejuvenate Modular Dual-Taper Stems. Radiology. 2015;277:142-150.
11. Koff MF, Amrami KK, Felmlee JP, Kaufman KR. Bias of cartilage T(2) values related to method of calculation. Magn Reson Imaging. 2008;26:1236-1243.
Figures