1418
Intervertebral Disc Mechanics Measured by dualMRI In Vivo1Mechanical Engineering, University Of Colorado Boulder, Boulder, CO, United States, 2Weldon School of Biomedical Engineering, Purdue University, West Lafayette, IN, United States
Synopsis
Functional imaging of
Introduction
Intervertebral disc (IVD) degeneration often leads to debilitating neck and back pain.[1] The depletion of IVD glycosaminoglycans (GAGs), a hydrophilic molecule that maintains hydrostatic pressure, is associated with IVD degeneration. GAG depletion alters IVD load transmission, changing the stress response and intra-tissue strain patterns. Magnetic resonance imaging (MRI) is a promising modality for early detection of IVD degeneration. However, the limited sensitivity of conventional relaxometry (monoexponential T2 and T1ρ) limits the ability to detect subtle macromolecular changes. Displacements under applied loading by MRI (dualMRI) recently demonstrated the ability to measure intra-tissue strain in vivo within the articular cartilage of human volunteers.[2] Moreover, dualMRI has been shown to detect changes in IVD mechanical properties ex vivo.[3], [4] Here, we document IVD biomechanics using dualMRI in vivo, and further relate functional metrics to relaxometry.Methods
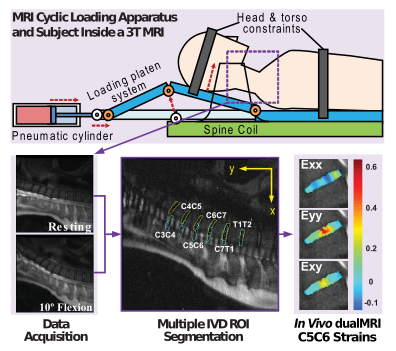
MRI was performed on cervical and thoracic IVDs (C2C3-T2T3) of 8 healthy participants (M/F:4/4, average age: 25.9, range: 20-29 years) with IRB approval. We focused our analysis on the cervical spine to specifically investigate motion during simple flexion-extension (i.e. neck bending). Bending was accomplished using a custom pneumatic apparatus (Figure 1) to achieve 10 degrees of flexion in a cyclic pattern, while images were acquired with a dedicated spinal RF coil. dualMRI imaging parameters were: FOV: 270×270mm2; matrix: 512×512px2, slice thickness: 7mm, number of averages: 10, flip angle: 90°. At registered image locations, and prior to mechanical loading, we acquired quantitative MRI (qMRI) T2 (TE: 6.78,13.97,21.15,42.72) and T1ρ (SLP: 500Hz TSL: 1,5,20,40,60) relaxometry data, with FOV: 270×270mm2, matrix: 256×128px2, slice thickness: 4mm, views per segment: 64, TR 1.2s, number of slices: 26, acceleration factor: 2.
Whole Disc regions of interest (ROI) were manually segmented for all cervical discs. Relaxometry ROIs were segmented separately because of slight subject movements between sequence acquisitions. Pixels with a signal to noise ratio (SNR) of less than 1 were removed. Displacements were calculated from phase data, smoothed, and then converted to finite (e.g. principal) strains.
Displacement and strain values for ROIs were averaged for each IVD and then averaged across all participants. The maximum strains were defined as the top 10% of strains for each IVD and then averaged in the same manner. The averages were analyzed via ANOVA to determine intra- and inter-IVD differences, with significance set at p<0.05.
Results
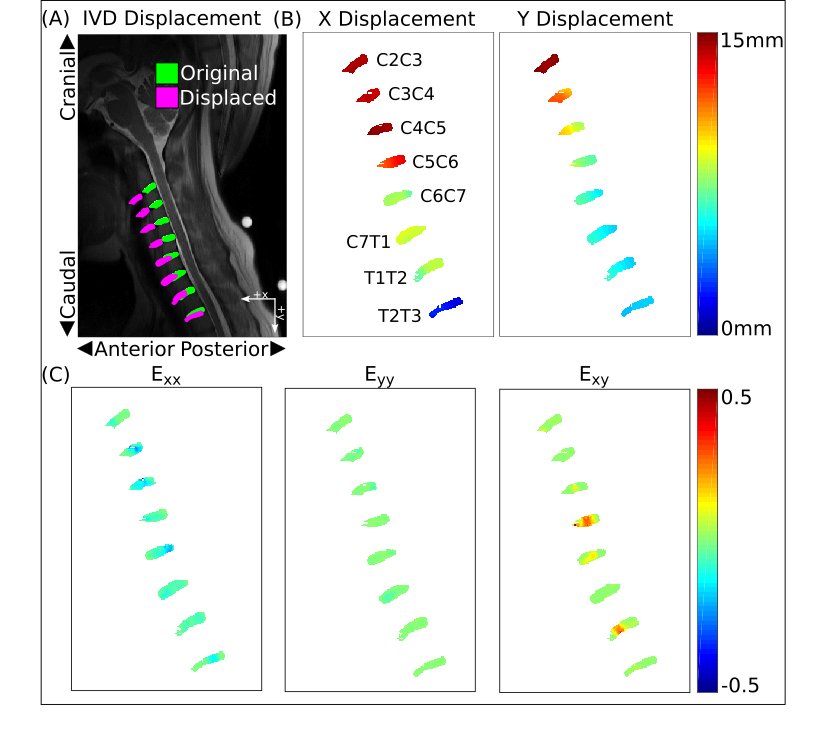
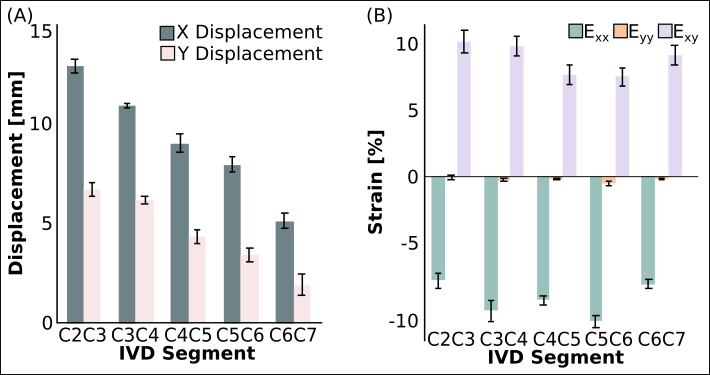
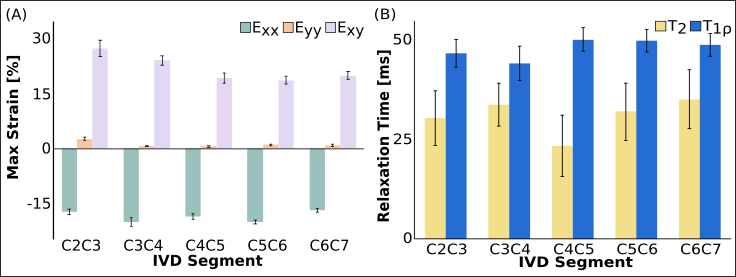
Overall motion and intra-tissue strains dependent on IVD segment (Figures 2 and 3). Strain data was not readily explained by the qMRI data (Figure 4). The IVD X and Y displacements were found to have significant differences (p<0.01) (Figure 3A). Average strains decreased caudally (Figure 3B), however, no significant differences were found (Exx: p=0.35, Eyy: p=0.92, Exy: p=0.33). Dominant strains were in transverse and shear directions. The 10% maximum strains (Figure 4A) showed a linearly decreasing trend. No qualitative trend was observed in the qMRI data (Figure 4B). IVD displacements for female subjects were significantly larger than values observed for males (p<0.01).Discussion
The calculated strain patterns, particularly the maximum strains, showed a position-dependent response, elucidating stress mitigation patterns of the IVDs (Figure 3, Figure 4A). Strain magnitudes agreed to both prior ex vivo data and mathematical models[3], [5]. While motion and strain variation was observed in the IVDs, trends in the qMRI data were less obvious, highlighting the potentially increased sensitivity of dualMRI (Figure 3C). Previous work has shown that the C5C6 IVD is particularly susceptible to damage from aging or traumatic events.[6], [7] Transverse strain results detailed a local maximum at C5C6 while shear analysis shows a local minimum at the same disc. The difference in strain patterns of the C5C6 disc compared to the other cervical discs suggest possible disease mechanisms. Interestingly, our observed strain patterns do not agree with recent simulated mechanical models of acute trauma.[5] Further study of this disagreement may yield more accurate simulation models. Further study of in vivo dualMRI in larger sample sizes may help to elucidate the sensitivity for investigating IVD biomechanics through strain pattern analysis compared to conventional MRI measures.Acknowledgements
This work was supported in part by NIH R21 AR066665 and University of Colorado Medical Science Training Program Grant T32
References
[1] M. A. Adams and P. J. Roughley, “What is Intervertebral Disc Degeneration, and What Causes It?,” Spine (Phila. Pa. 1976)., vol. 31, no. 18, pp. 2151–2161, Aug. 2006.
[2] A. J. Griebel, S. B. Trippel, and C. P. Neu, “Noninvasive dualMRI-based strains vary by depth and region in human osteoarthritic articular cartilage,” Osteoarthr. Cartil., vol. 21, no. 2, pp. 394–400, Feb. 2013.
[3] D. D. Chan and C. P. Neu, “Intervertebral disc internal deformation measured by displacements under applied loading with MRI at 3T,” Magn. Reson. Med., vol. 71, no. 3, pp. 1231–1237, Mar. 2014.
[4] D. D. Chan, P. C. Gossett, K. D. Butz, E. A. Nauman, and C. P. Neu, “Comparison of intervertebral disc displacements measured under applied loading with MRI at 3.0 T and 9.4 T,” J. Biomech., vol. 47, no. 11, pp. 2801–2806, Aug. 2014.
[5] P. Tropiano et al., “Using a Finite Element Model to Evaluate Human Injuries Application to the HUMOS Model in Whiplash Situation,” Spine (Phila. Pa. 1976)., vol. 29, no. 16, pp. 1709–1716, Aug. 2004.
[6] M. M. Panjabi, S. Ito, A. M. Pearson, and P. C. Ivancic, “Injury mechanisms of the cervical intervertebral disc during simulated whiplash,” Spine (Phila. Pa. 1976)., vol. 29, no. 11, pp. 1217–1225, 2004.
[7] M. Teraguchi et al., “Prevalence and distribution of intervertebral disc degeneration over the entire spine in a population-based cohort: the Wakayama Spine Study,” Osteoarthr. Cartil., vol. 22, no. 1, pp. 104–110, Jan. 2014.
Figures