1416
Computer Aided Detection of Synovial Abnormalities Near Total Hip Replacements on 3D-MSI MRI using Deep Neural Networks1Radiology, Medical College of Wisconsin, Milwaukee, WI, United States, 2Magnetic Resonance Imaging, Hospital for Special Surgery, New York, NY, United States, 3Center for Data Science, New York University, New York, NY, United States
Synopsis
3D-MSI increases the visibility of a large number of important pathologies commonly found near implanted orthopaedic hardware, including: host-mediated adverse local tissue reactions, infection, osteolysis, and osteonecrosis. MRI identification of these pathologies aids in planning for surgical revision and has been shown capable of predicting tissue destruction in symptomatic hip replacements. Identification of these features is difficult, even for the interpreting physicians with substantial specialized training and experience . To address this current challenge, a deep-learning based pattern classification approach using 3D-MSI MRI is proposed and demonstrated to predict patterns of adverse synovial responses near hip replacements.
Introduction
Soft tissue changes near symptomatic total hip replacements are best assessed using MRI, which can visualize adverse host-mediated synovial reactions, in addition to periprosthetic bone loss. Three-Dimensional Multi-Spectral Imaging (3D-MSI) technology was developed to reduce susceptibility artifacts due to implanted devices [1-3] and improve visualization near implant interfaces.
3D-MSI increases the visibility [4] of a large number of important pathologies commonly found near implanted orthopaedic hardware, including: host-mediated adverse local tissue reactions, infection, osteolysis, and osteonecrosis [5]. MRI identification of these pathologies aids in planning for surgical revision and has been shown capable of predicting tissue destruction in symptomatic HA[6]. Identification of these features is difficult, even for the interpreting radiologist or clinician with substantial specialized training and experience .
To address this current challenge, a neural-network based pattern classification approach using 3D-MSI MRI is demonstrated as a potential mechanism for computer-aided diagnosis (CAD) of adverse synovial responses after HA.
In this preliminary technical feasibility study, a selection of proton density contrast 3D-MSI MRI acquired at 1.5T were utilized for training of a 2D encoder-decoder UNET architecture[7]. The resulting dataset allowed for a training set of 306 training images and 46 pathology validation images. Data augmentation methods were used to heavily inflate the reduced number of curated training images. Testing was performed on an additional 13 cases without any clear pathology as a control experiment, which provided an additional 402 images for evaluation of the 2D network.
Methods
Data was collected on clinical imaging subjects who provided written consent into studies approved by local IRB committees. For the 28 training (15) and control test (13) cases, areas of synovitis (if present) were manually identified on coronal 3D-MSI based by an expert board certified radiologist.
The proposed deep learning network was created using PyTorch. The model had two halves, an encoder and decoder. Each encoder step consisted of two 3x3, 2D convolution layers followed by a single 2x2 max pooling layer. Decoder steps had a single 2x2 up convolution followed by two 3x3, 2D convolution layers. The final layer was a single 1x1, 2D convolution which created a prediction map of the same size as the input images. The model had a depth of 4, meaning there were a total of 3 max pooling and up sampling steps. For each epoch, the input data was divided into batches of 4, and a random distortion was applied to 50% of the data using PyTorch’s Augmentor library. Then the model was trained on each batch dataset. After each training pass, the loss was calculated using the binary cross entropy loss function and model parameters were updated. Once all training batches were complete, the updated model was applied to a separate validation set, and the loss was calculated using the same loss function. If the loss improved from the previous epoch, the latest model was saved. This training process was repeated for 200 epochs.
Analysis was performed on a voxelwise basis. Synovitis prediction values were computed across entire slices for both the training, validation, and control testing image sets. Examination of the control testing cohort was performed by identifying slices in which a false positive high thresholded prediction region was found in an area of potential synovitis.
Results
Figure 1 provides an ROC curve of the 2D synovitis neural net trained on 15 augmented cases with 306 synovitis labeled images randomly augmented by 50% (resulting in 459 total slices).
Figure 2 provides a box-plot exemplifying these voxelwise comparisons spread across all training, validation, and control testing slices. It is clear from the plot that the labeled synovitis regions showed substantially increased neural network prediction value (p < 0.00001, student t-test).
In the control test experiment, 31/402 slices resulted in potential false positives, indicating a false positive rate of 7.7%.
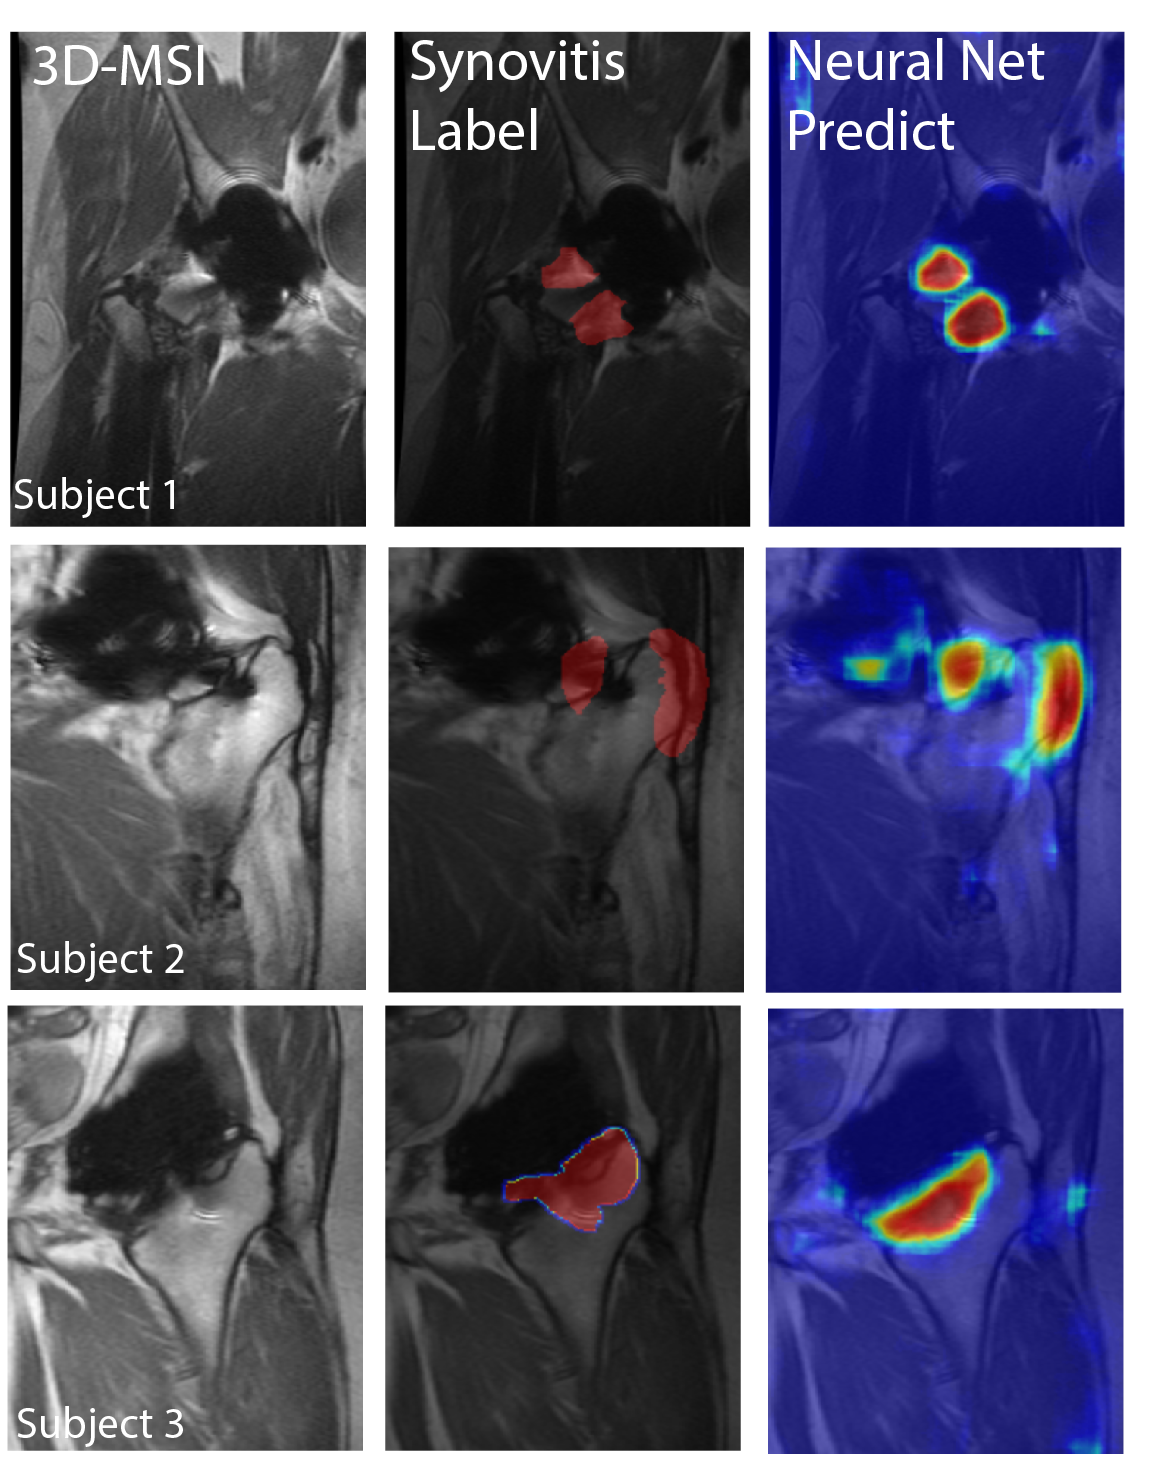
Figure 3 provides images of predictions and masks on 3 different labeled subjects. The prediction maps show excellent agreement with labeled synovitis regions.
Discussion
This preliminary study has shown promising feasibility for developing a deep learning neural network to aid detection of synovial reactions near total hip arthroplasty. A low false positive rate was found even as the current network was not restricted to searching per-prosthetic regions. We anticipate that reducing the network search region will substantially improve classification capabilities. The clinical utility of this method is substantial as further development could lead to classification of synovial reaction based on the primary bearing surface of the HA (e.g. ceramic-on-ceramic vs. metal-on-polyethylene), as well as the ability to monitor longitudinal progression and/or expansion of synovial reactions. Future work will curate larger datasets and refine the search areas for the network.Acknowledgements
Research reported in this publication was supported by NIH/NIAMS R01AR064840. The content is solely the responsibility of the authors and does not necessarily represent the official views of the NIH.
References
1. Koch KM, Lorbiecki JE, Hinks RS, King KF. A multispectral three- dimensional acquisition technique for imaging near metal implants. Magn Reson Med 2009;61:381–390.
2. Lu W, Pauly KB, Gold GE, Pauly J, Hargreaves B. SEMAC: slice encoding for metal artifact correction in MRI. Magn Reson Med 2009; 62:66–76.
3. Koch KM, Brau AC, Chen W, Gold GE, Hargreaves BA, Koff M, McKinnon GC, Potter HG, King KF. Imaging near metal with a MAVRIC-SEMAC hybrid. Magn Reson Med 2011;651:71–82.
4. Hayter CL, Koff MF, Shah P, Koch KM, Miller TT, Potter HG. MRI After Arthroplasty: comparison of MAVRIC and conventional fast spin-echo techniques. Am J Roentgenol 2011;197:W405–411.5.
5. Fritz J, Lurie B, Miller T, Potter HG. MR Imaging of Hip Arthroplasty Implants. Radiographics 2014;344:E106–E1326.
6. Nawabi DH, Gold S, Lyman S, Fields K, Padgett DE, Potter HG. MRI Predicts ALVAL and Tissue Damage inMetal-on-Metal Hip Arthroplasty. Clinical Orthopaedics and Related ResearchR©2013;4722:471–481. 7.
7. Ronneberger, O., Fischer, P. and Brox, T., 2015, October. U-net: Convolutional networks for biomedical image segmentation. In International Conference on Medical image computing and computer-assisted intervention (pp. 234-241). Springer, Cham.
Figures