1413
3D Multi-spectral T2 Mapping Near Metal Implants1Medical College of Wisconsin, Milwaukee, WI, United States, 2GE Healthcare, Waukesha, WI, United States, 3Hospital for Special Surgery, New York, NY, United States
Synopsis
The need for examining tissue integrity near metal implants in post-operative arthroplasty is rapidly increasing. Quantitative T2 mapping can be beneficial for characterization of tissues and early diagnosis of tissue pathology. Current T2 mapping techniques lack the capability to image near metal hardware. A novel 3D fast spin echo based two-echo multi-spectral T2 mapping technique is proposed to address this need. This technique is compared to the commercially available approach for accuracy of relaxometry measurements both in phantom and human experiments.
Introduction
The increase of arthroplasty revisions has multiplied the need for imaging near metal implants to assess post-operative joint integrity [1]. 3D multi spectral imaging (MSI) techniques like MAVRIC [2], SEMAC [3] and MAVRIC-SL [4] have successfully mitigated the effects of magnetic susceptibility artifacts due to metal implants. Quantitative parametric mapping techniques like T2 mapping are useful in assessing tissue hydration and orientation of collagen, making it an important biomarker for detecting early-stage osteoarthritis [5]. Several techniques (Cartigram, Maplt, 3DMAPSS) are available for T2 mapping; however, they lack the ability to image near metal implants. In this work, a two-echo multi-spectral 3D fast spin echo (3D-FSE) based T2 mapping pulse sequence for imaging near metal hardware is described and demonstrated.Methods
The sequence was developed by modifying the 3D-MSI pulse sequence to serially acquire images at two echo times within a single scan prescription (Fig 1). In order to acquire all spectral bins for the second echo time, the number of passes are doubled. The two rows below the RF waveforms in Fig 1 (rows in blue) and the last two rows (in red) show the acquisition scheme for shorter echo time (TE1), and longer echo time (TE2) respectively. The number of skipped echoes are recalculated for TE2. A constant flip angle (FA) is required to accurately quantify the signal obtained from both echo times. The refocusing FA of <180o leads to oscillations in signal intensity from initial echoes, hence we empirically estimate the number of echoes to skip for TE1 to reach pseudo-steady state. This scheme was compared to its multi series (5 echoes) sequence and Cartigram on phantom and knee datasets. The imaging parameters were: FOV=16cm, 128x128 matrix size, ETL=20, FA=110o, receiver BW = 1kHz/pixel, slice thickness = 4mm, TEs = (12.54ms, 20.04ms, 25.23ms, 38.16ms, and 46.01ms) for multi-series variant and (12.54ms, 46.01ms) for the modified two echo sequence. An in-vivo knee dataset was acquired using an externally positioned cobalt chrome implant (50 mm diameter total hip resurfacing acetabular component) to allow for controlled tests with and without metal artifact at 3T. Imaging parameters: FOV: 16 cm, 192x128 matrix size, 2.5mm slice thickness, and 16 slices. An in-plane phase acceleration of 2 was used for both cases. 16 spectral bins were collected in the metal implant setting. Single-acquisition two-echo 3D-MSI T2 maps were also collected on two patients undergoing clinical MRI examinations of their total hip replacements.Results
Quantitative comparisons between Cartigram, multi-series 3D-MSI, and the modified two-echo sequences collected on the T2 phantom are shown in Fig 2. The mean T2 values obtained from the 3 approaches were in good agreement with each other, with a maximum difference of ~10% demonstrating that the two-echo approach was sufficient for quantitative assessment. Fig 3 shows the validation of the above techniques on knee with and without metal. The Cartigram single echo image (3b) shows significant signal void and slice distortions because of the implant and the trochlear cartilage is lost in the artifact. On the contrary, the map obtained from the modified two-echo sequence shows no artifacts in the trochlear cartilage due to the multi-spectral data acquisition. T2 values in the muscle (shown in green box in (a)) are comparable to Cartigram, both with and without metal. The modified two-echo sequence demonstrated on two patients with total hip arthroplasty (THA) is seen in Fig. 4. ROIs 1 and 2 represent a shorter T2 component of the synovium, as well as extracapsular fat (longer T2 value). ROI 3 identifies posterior short external rotator tendon, while ROI 4 provides a measurement of extracapsular fat leaked from the bone marrow into the synovial region.Discussion
In this work, we have developed an imaging technique to acquire T2 maps near metal implants by modifying the existing 3D-MSI pulse sequence. Within this study, it was observed that the conventional sum of squares bin combination could lead to inflated T2 values because of the overlapping spectral profiles, especially in regions away from the implants, as observed in the muscle within the knee experiment. Further investigation on improved methods to combine the spectral bins will help in improving the accuracy of T2 maps.Conclusion
In conclusion, with further testing, the proposed T2 mapping technique could further improve quantitative diagnostic capability of MR to image near metal implants.Acknowledgements
Research reported in this publication was supported by NIH/NIAMS R01AR064840. The content is solely the responsibility of the authors and does not necessarily represent the official views of the NIH.References
[1] Kurtz, S., Ong, K., Lau, E., Mowat, F., & Halpern, M. (2007). Projections of primary and revision hip and knee arthroplasty in the United States from 2005 to 2030. JBJS, 89(4), 780-785.
[2] Koch KM, Lorbiecki JE, Hinks RS, King KF. A multispectral three- dimensional acquisition technique for imaging near metal implants. Magn Reson Med 2009; 61:381–390.
[3] Lu W, Pauly KB, Gold GE, Pauly JM, Hargreaves BA. SEMAC: slice encoding for metal artifact correction in MRI. Magn Reson Med 2009;
[4] Koch, K. M., Brau, A. C., Chen, W., Gold, G. E., Hargreaves, B. A., Koff, M., & King, K. F. (2011). Imaging near metal with a MAVRIC‐SEMAC hybrid. Magn Reson Med, 65(1), 71-82.
[5] Dunn, T. C., Lu, Y., Jin, H., Ries, M. D., & Majumdar, S. (2004). T2 relaxation time of cartilage at MR imaging: comparison with severity of knee osteoarthritis. Radiology, 232(2), 592-598.
Figures

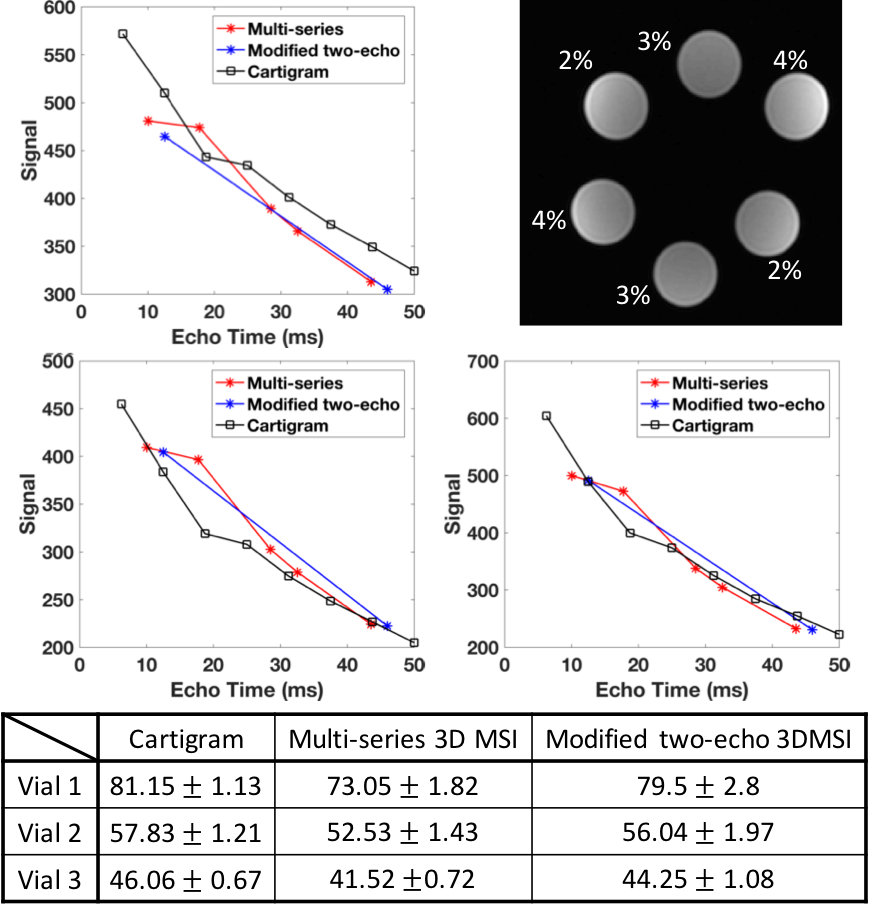
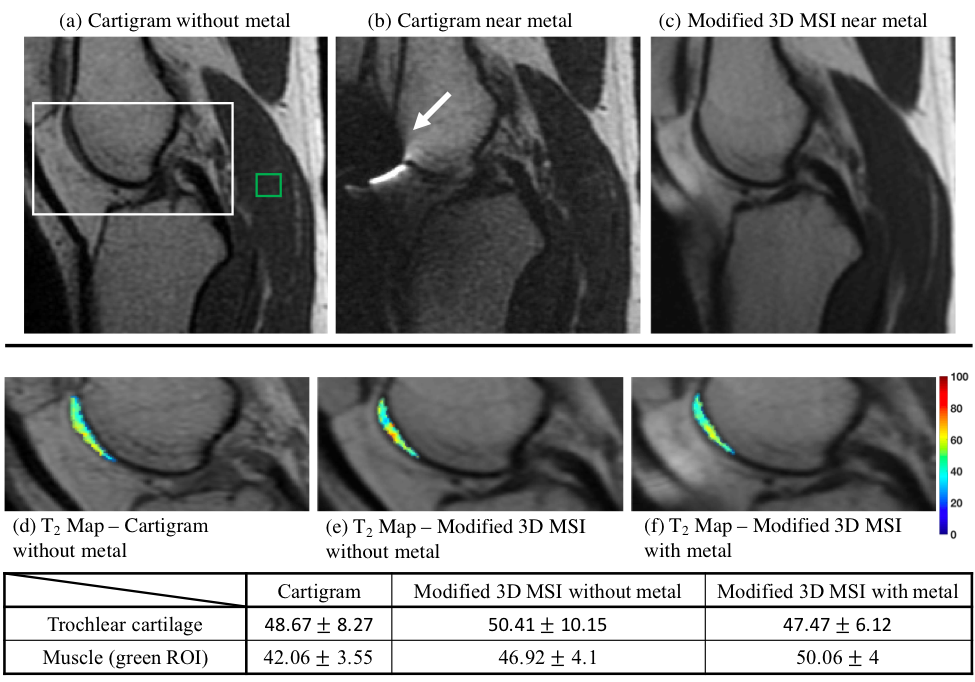
Figure 3: In-vivo evaluation of the modified two-echo MAVRIC sequence in knee: The top row shows a T2-weighted image for Cartigram with and without metal and modified 3D-MSI T2 sequence with metal in knee (a-c) respectively. The T2 map for the trochlear cartilage obtained using Cartigram(d), Modified two-echo 3D-MSI without (e) and with (f) metal are seen in the bottom row. The trochlear cartilage is completely lost in Cartigram near metal(b) due to metal induced susceptibility shown by white arrow. The table shows the T values(in ms) for trochlear cartilage and muscle (green ROI in (a)) for Cartigram and Modified 3D-MSI without and with metal.
