1410
Imaging of the Region of the Osteochondral Junction (OCJ) Using a 3D Adiabatic Inversion Recovery Prepared Ultrashort Echo Time Cones (3D IR-UTE Cones) Sequence at 3T1Radiology, University of California, San Diego, San Diego, CA, United States, 2GE health care, San Diego, CA, United States, 3VA San Diego Healthcare System, San Diego, CA, United States
Synopsis
The osteochondral junction (OCJ) region serves as a functional barrier between the synovial joint space and subchondral bone marrow, and may play an important role in the pathogenesis of osteoarthritis (OA). MRI of the OCJ region is difficult due to the short T2 of deep radial uncalcified cartilage and calcified cartilage, which results in little or no signal when conventional pulse sequences are used. The purpose of this study was to use a 3D adiabatic inversion recovery prepared UTE Cones (3D IR-UTE-Cones) sequence for volumetric imaging of OCJ region with high spatial resolution and contrast in clinically acceptable scan times.
Introduction
Osteoarthritis (OA) is considered a whole joint disease with pathologic changes involving all of constituent joint tissues 1. MRI of the OCJ region is difficult due to its short T2, which results in little or no signal with conventional sequences 2. Recently, studies have focused on 2D UTE techniques with various long T2 suppression schemes to suppress signals form the superficial layers of cartilage and marrow fat, leaving the OCJ to be selective imaged 2-7. However, 2D UTE sequences are sensitive to eddy currents, and it is difficult to image the whole knee joint 8. This study aimed to develop 3D adiabatic inversion recovery UTE Cones (IR-UTE-Cones) sequences for volumetric imaging of the OCJ region.Methods
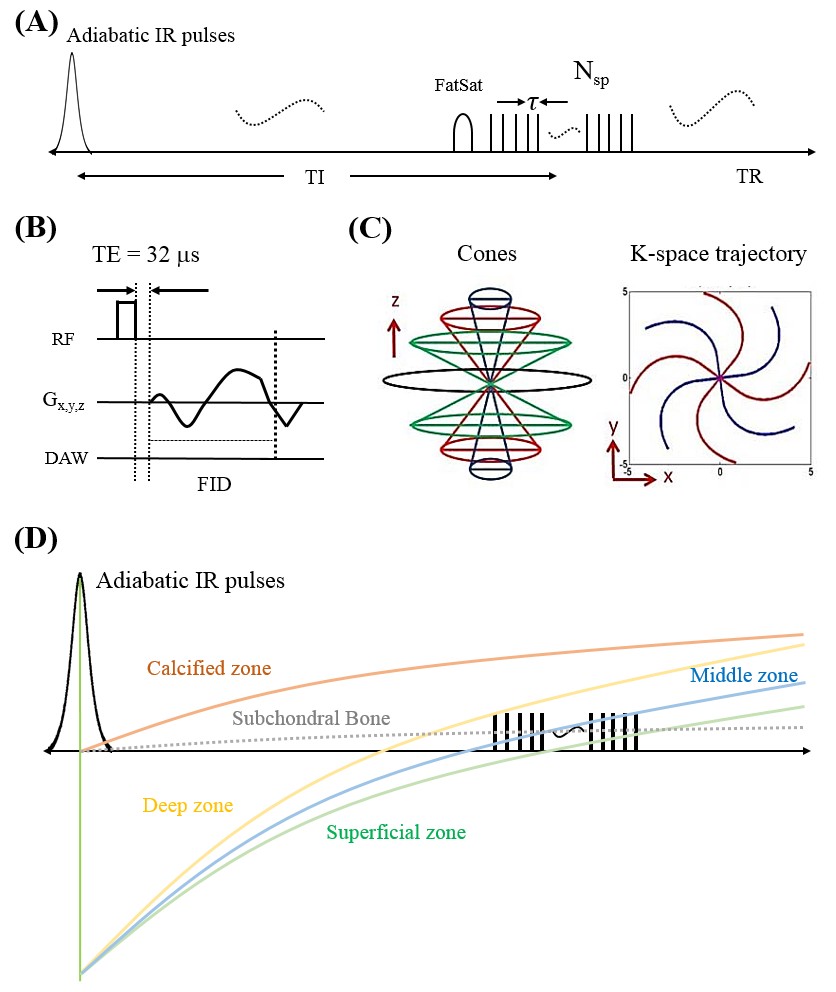
The 3D IR-UTE-Cones pulse sequence was implemented on a 3T scanner 9. To improve the acquisition efficiency, a series of spokes (Nsp) were acquired after each IR pulse (Figure 1A). Fat signal was suppressed with a chemical shift fat saturation (FS) module before the acquisition spoke trains. For each spoke, a short rectangular pulse (e.g., 50µs) was used for non-selective signal excitation (Figure 1B), and this was followed by a Cones data acquisition (Figure 1C). The contrast mechanism was shown in Figure 1D. The magnetizations of the superficial, middle and deep layers are inverted by the adiabatic IR pulse. Then the inverted magnetizations recover based on their T1 relaxation mechanisms. The longitudinal magnetization in the deeper zone recovers faster than those in the middle and superficial layers. Thus the deep uncalcified cartilage has higher signal when UTE data acquisitions start near the signal nulling point for the superficial cartilage. The OCJ regions have very short T2s and their magnetizations are not inverted but largely saturated 10. In addition, the OCJ region tissues have shorter T1s than the more superficial uncalcified layers of cartilage. The saturated magnetization of the OCJ region recovers faster than other tissues, leading to much higher signal intensity and thus high contrast imaging of the OCJ region. The feasibility of OCJ region imaging with IR-UTE-Cones sequence was assessed on a patellar sample from a 31y male donor. Then IR-UTE-Cones sequence was used to image OCJ region in eight the cadaveric knee specimens (66±28 years old). Two groups of human subjects were included in this study. The first group was eight healthy volunteers (37±13 years old) and the second group was six OA patients (58±14 years old).
The sequence parameters of IR-UTE-Cones are shown as follows: FOV=13×13×8cm3, Matrix=256×256×40, TR/TI=1200/600 ms, flip angle=10°, Nsp=21, spoke interval =5.2 ms, BW=166 kHz, scan time=10 min.
Results and Discussion
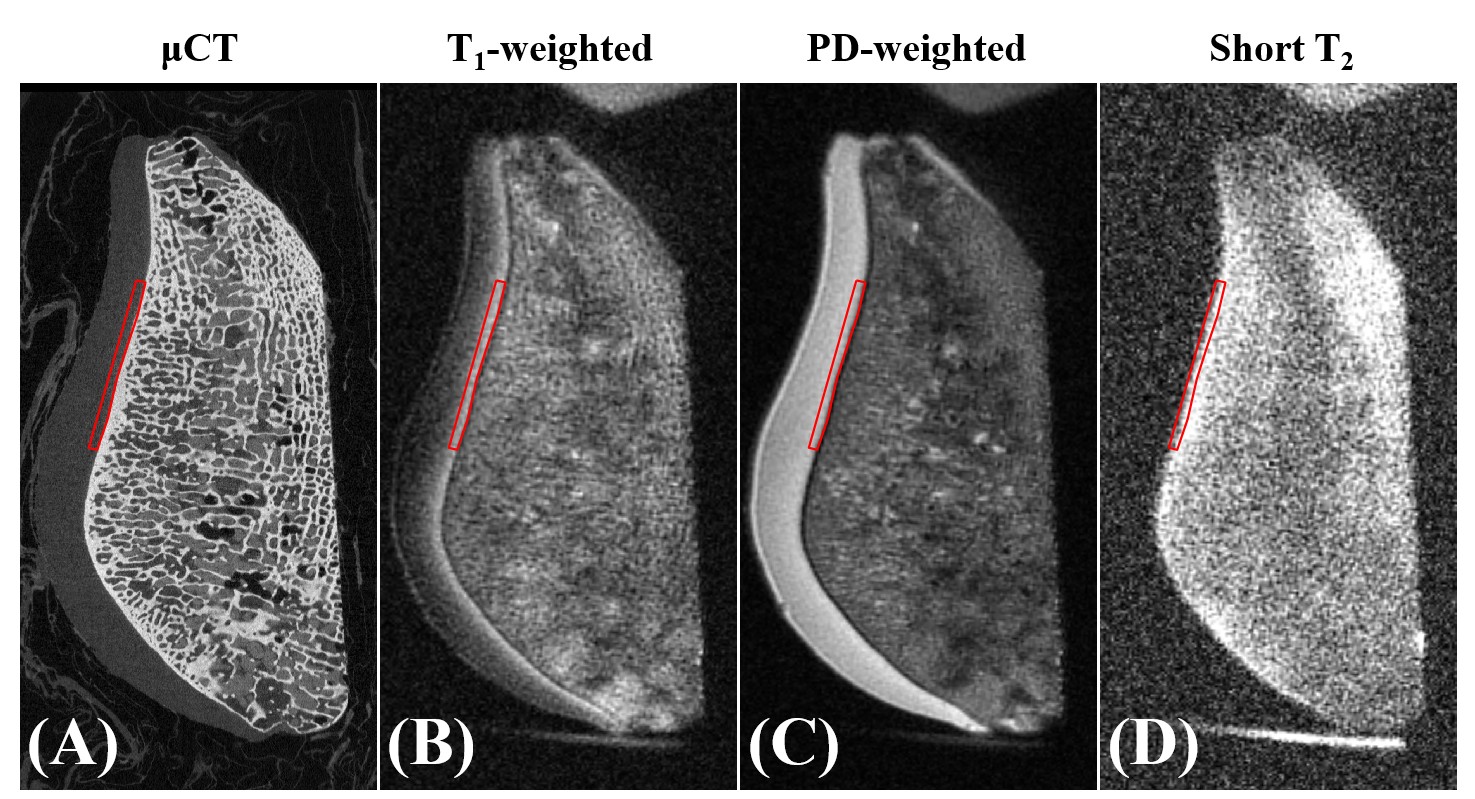
Figure 2 shows a comparison between UTE MRI and μCT images of the patellar cartilage sample. ROIs corresponding to the high signal line shown with the T1-weighted 3D IR-UTE-Cones sequence (Figure 2B) were located on the μCT and other UTE images. The high signal line which lies beneath the superficial layers of cartilage was confirmed to be immediately above the subchondral bone plate on the µCT images (Figure 2A). It shows as high contrast with the T1-weighted UTE sequence but low contrast with the PD-weighted UTE sequence (Figure 4C). The subchondral bone plate only shows high signal with the selective short-T2 UTE imaging sequence (Figure 4D). Those results together suggest that the high signal line in T1-weighted 3D IR-UTE-Cones imaging mainly comes from the calcified cartilage, with some contribution from the deep radial layer, but no significant contribution from the subchondral bone plate.
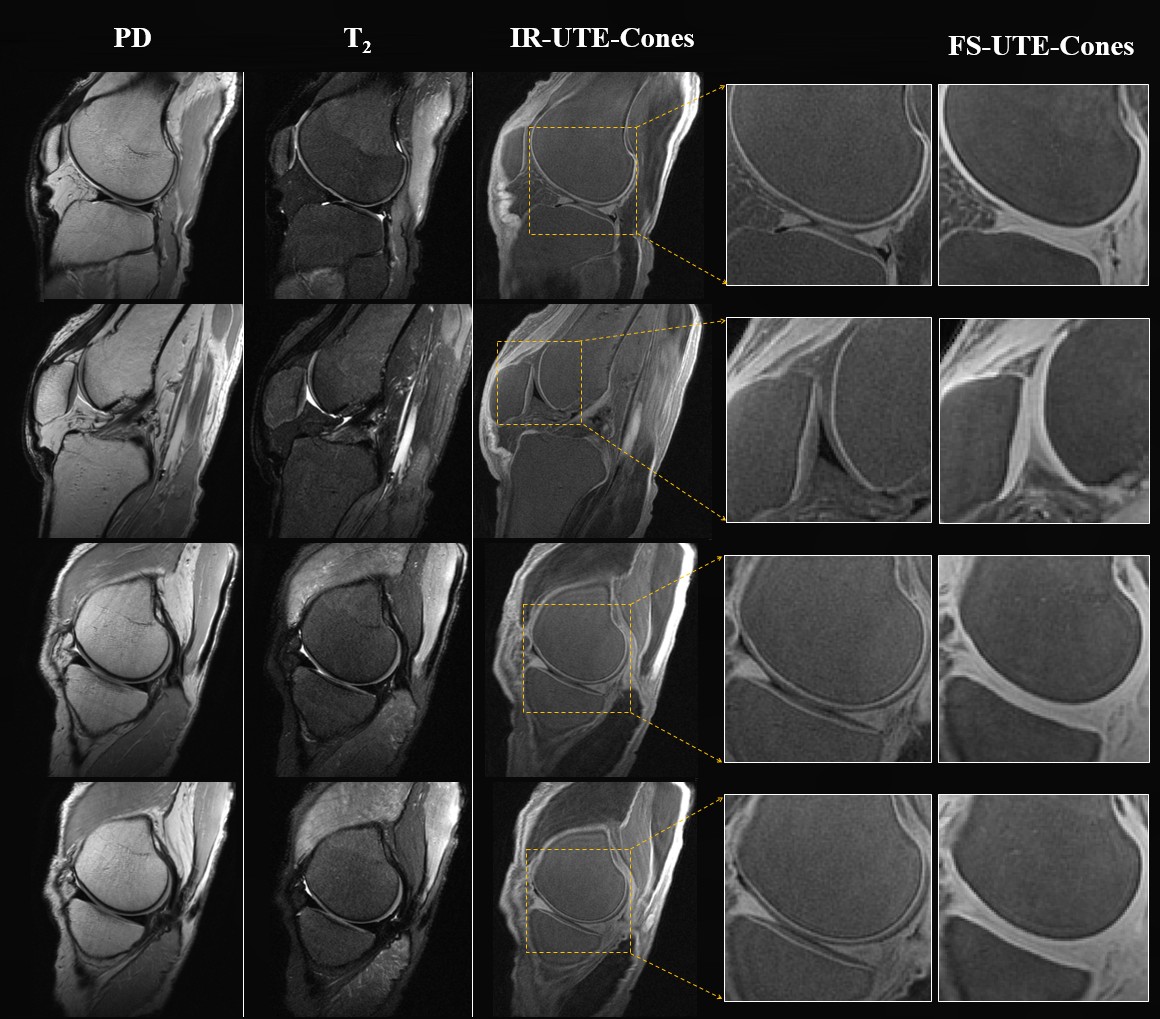
The OCJ regions in a normal knee joint are displayed in Figures 3. The 3D FS UTE-Cones sequence shows high signal for all the components of articular cartilage. There is little contrast between the OCJ region and the more superficial layers of articular cartilage. However, the 3D IR-UTE-Cones sequence shows well defined linear signals in the patellar, femoral and tibia cartilage of the knee joints.
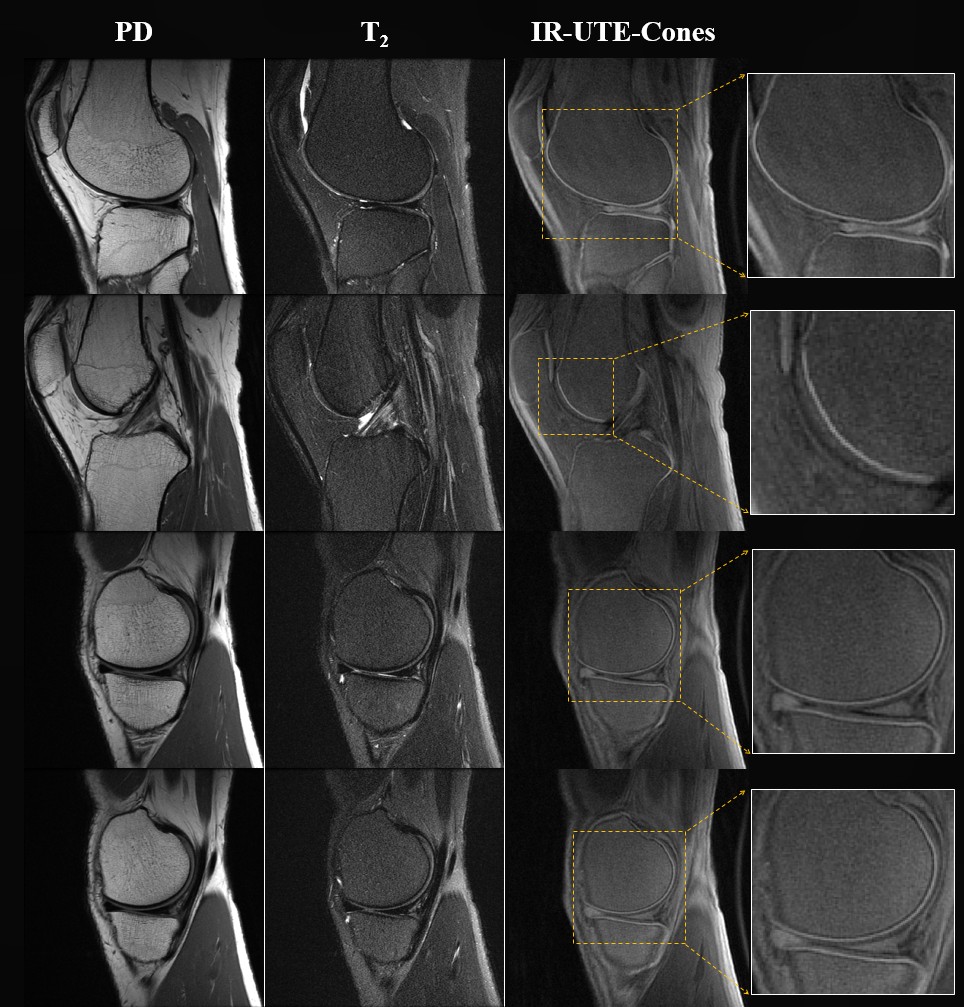
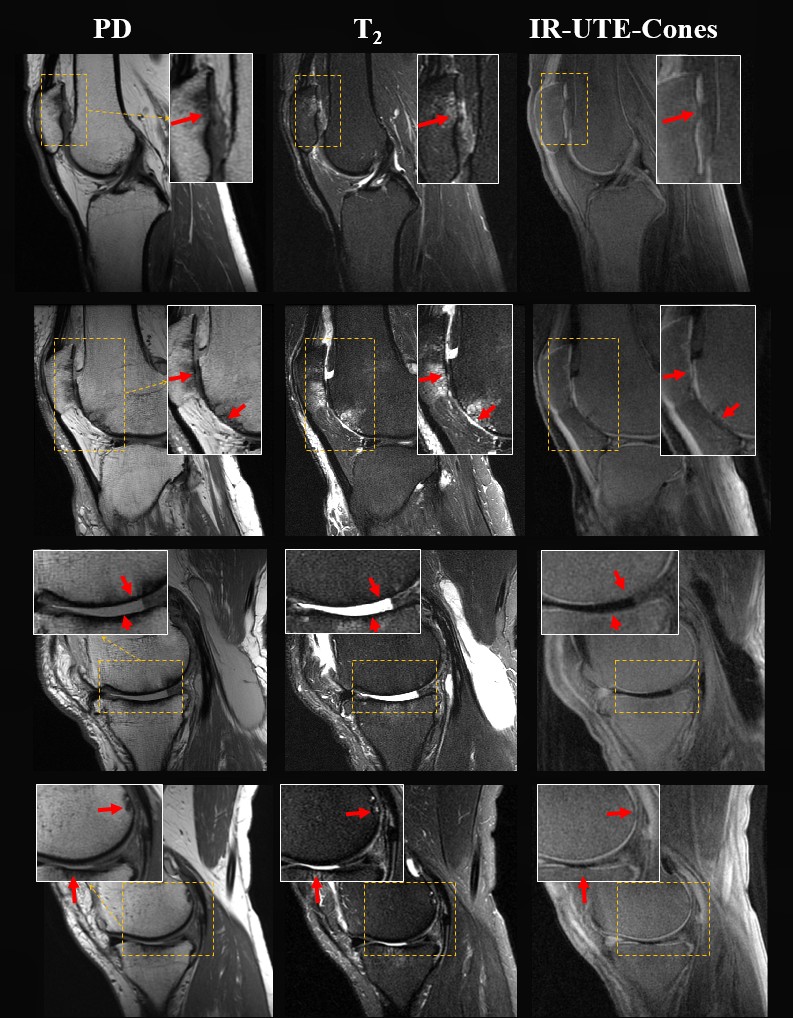
Figure 4 shows OCJ region imaging of an in vivo normal knee joint. Continuous bright signal lines can be found in patellar, femoral and tibial cartilages. T1-weighted 3D IR-UTE-Cones imaging of four OA patients are shown in Figure 5. As with the OA knee specimen morphological changes were observed in the OCJ region, including ill-defined focal loss, and non-visualization of the high linear signal line adjacent to the subchondral bone plate. The abnormal OCJ regions shown with the T1-weighted 3D IR-UTE-Cones imaging corresponded well with the abnormal superficial layers seen in the clinical PD- and T2-weighted FSE imaging.
Conclusion
The 3D IR-UTE-Cones sequence can be used to image the OCJ region in vivo. Abnormalities in the OCJ region can be depicted with high spatial resolution and high contrast.Acknowledgements
The authors acknowledge grant support from GE Healthcare, NIH (R01AR062581,1R21AR073496, R01AR068987), and the VA Clinical Science and Rehabilitation R&D Awards (I01CX001388 and I01RX002604)References
1. Loeser RF, Goldring SR, Scanzello CR, Goldring MB. Osteoarthritis: a disease of the joint as an organ. Arthritis Rheum. 2012;64(6):1697-707.
2. Gold GE, Thedens DR, Pauly JM, et al. MR imaging of articular cartilage of the knee: new methods using ultrashort TEs. AJR Am J Roentgenol. 1998;170(5):1223-6.
3. Chang EY, Du J, Chung CB. UTE imaging in the musculoskeletal system. J Magn Reson Imaging. 2015;41(4):870-83.
4. Bae WC, Dwek JR, Znamirowski R, et al. Ultrashort echo time MR imaging of osteochondral junction of the knee at 3 T: identification of anatomic structures contributing to signal intensity. Radiology. 2010;254(3):837-45.
5. Du J, Takahashi A, Bae WC, Chung CB, Bydder GM. Dual inversion recovery ultrashort echo time imaging: Creating high contrast for short T2 species. Magn Reson Med 2010; 63:447-455.
6. Du J, Carl M, Bae WC, Statum S, Chang EY, Bydder GM, Chung CB. Dual inversion recovery ultrashort echo time (DIR-UTE) imaging and quantification of the zone of calcified cartilage. Osteoarthritis Cartilage 2013; 21:77-85.
7. Mackay JW, Low SB, Houston GC, Toms AP. Ultrashort TE evaluation of the osteochondral junction in vivo: a feasibility study. Br J Radiol. 2016;89(1059):20150493.
8. Lu A, Daniel BL, Pauly JM, Pauly KB. Improved slice selection for R2* mapping during cryoablation with eddy current compensation. J Magn Reson Imaging 2008; 28:190-198.
9. Carl M, Bydder GM, Du J. UTE imaging with simultaneous water and fat signal suppression using a time-efficient multispoke inversion recovery pulse sequence. Magn Reson Med 2016;76:577–582.
10. Larson PE, Conolly SM, Pauly JM, Nishimura DG. Using adiabatic inversion pulses for long-T2 suppression in ultrashort echo time (UTE) imaging. Magn Reson Med 2007; 58:952-961.
Figures