1407
Accurate 3D T2 Relaxometry with Simultaneous High-Resolution Structural Imaging using Deep Learning1Radiology, Stanford University, Palo Alto, CA, United States, 2LVIS Corporation, Palo Alto, CA, United States, 3Neurology, Stanford University, Palo Alto, CA, United States
Synopsis
Rapidly obtaining high-resolution structural magnetic resonance images (MRI) and generating quantitative biomarkers, such as the T2 relaxation time, using a single sequence is useful for musculoskeletal imaging. However, high-resolution is at odds with high signal-to-noise ratio (SNR) in MRI, which makes it challenging to simultaneously optimize for image quality and quantitative accuracy. In this study, we demonstrate how deep-learning-based super-resolution can create high-resolution images with accurate T2 values using a prospectively-sampled 5-minute quantitative double-echo steady-state sequence. We validate this method using high-SNR reference sequences for T2 accuracy and high-resolution reference sequences and a reader study for image quality assessment.
Introduction
Obtaining high resolution magnetic resonance images (MRI) and generating quantitative image-based biomarkers to assess tissue biochemistry is crucial for developing early osteoarthritis biomarkers and for routine clinical musculoskeletal imaging1,2. However, acquiring quantitative biomarkers such as the T2 relaxation time, which may indicate degeneration of collagenous tissues, requires high signal-to-noise ratio (SNR), which is at odds with high-resolution in MRI, especially in a single rapid sequence. The quantitative double-echo in steady-state (qDESS) pulse sequence provides accurate T2 measurements and high-quality morphological imaging with in-plane resolution of 0.4mm and 1.4mm thick slices in only five minutes3. However, reducing the slice thickness to enable blurring-free multi-planar isotropic reformations while maintaining scan time decreases SNR and biases T2 measurements. Advances in deep-learning-based super-resolution may enable acquiring low-resolution MRI scans with accurate T2 values and subsequently enhancing image resolution. In this study, we evaluate whether deep learning can create high-resolution images with accurate T2 values using a prospectively-sampled 5-minute qDESS scan for highly efficient musculoskeletal imaging.Methods
A 3D convolutional neural network termed MRSR was used to enhance image quality by learning image transformations between low and high-resolution datasets, using methods described previously4. MRSR was first pre-trained using 159 3D DESS datasets obtained through the Osteoarthritis Initiative5. Subsequently MRSR was trained/validated on 34/10 high-resolution qDESS datasets respectively. All cases were from patients referred for a clinical knee MRI to ensure inclusion of healthy and pathologic tissues during training. qDESS consisted of 160 slices with a slice thickness of 0.7mm acquired with 2x2 parallel imaging. Acquisition of 2x thicker slices (1.4mm) was simulated using sequential anti-aliasing low-pass filtering followed by Fourier interpolating (FI) to the ground-truth slice locations.
The hold-out testing data consisted of 13 low-resolution scans (qDESS-LR: 416x416 matrix, 1.4mm slices, 2x1 parallel imaging) acquired with the same scan parameters as the simulated training data. A high-resolution sequence unseen during training with identical scan parameters as the training (qDESS-HR) was used as a reference for image quality enhancements. A low-resolution high-SNR qDESS sequence (qDESS-T2Ref: 256x256 matrix, 2.8mm slices, no parallel imaging) was used as a reference for accurate T2 values (overall study design in Fig.1).
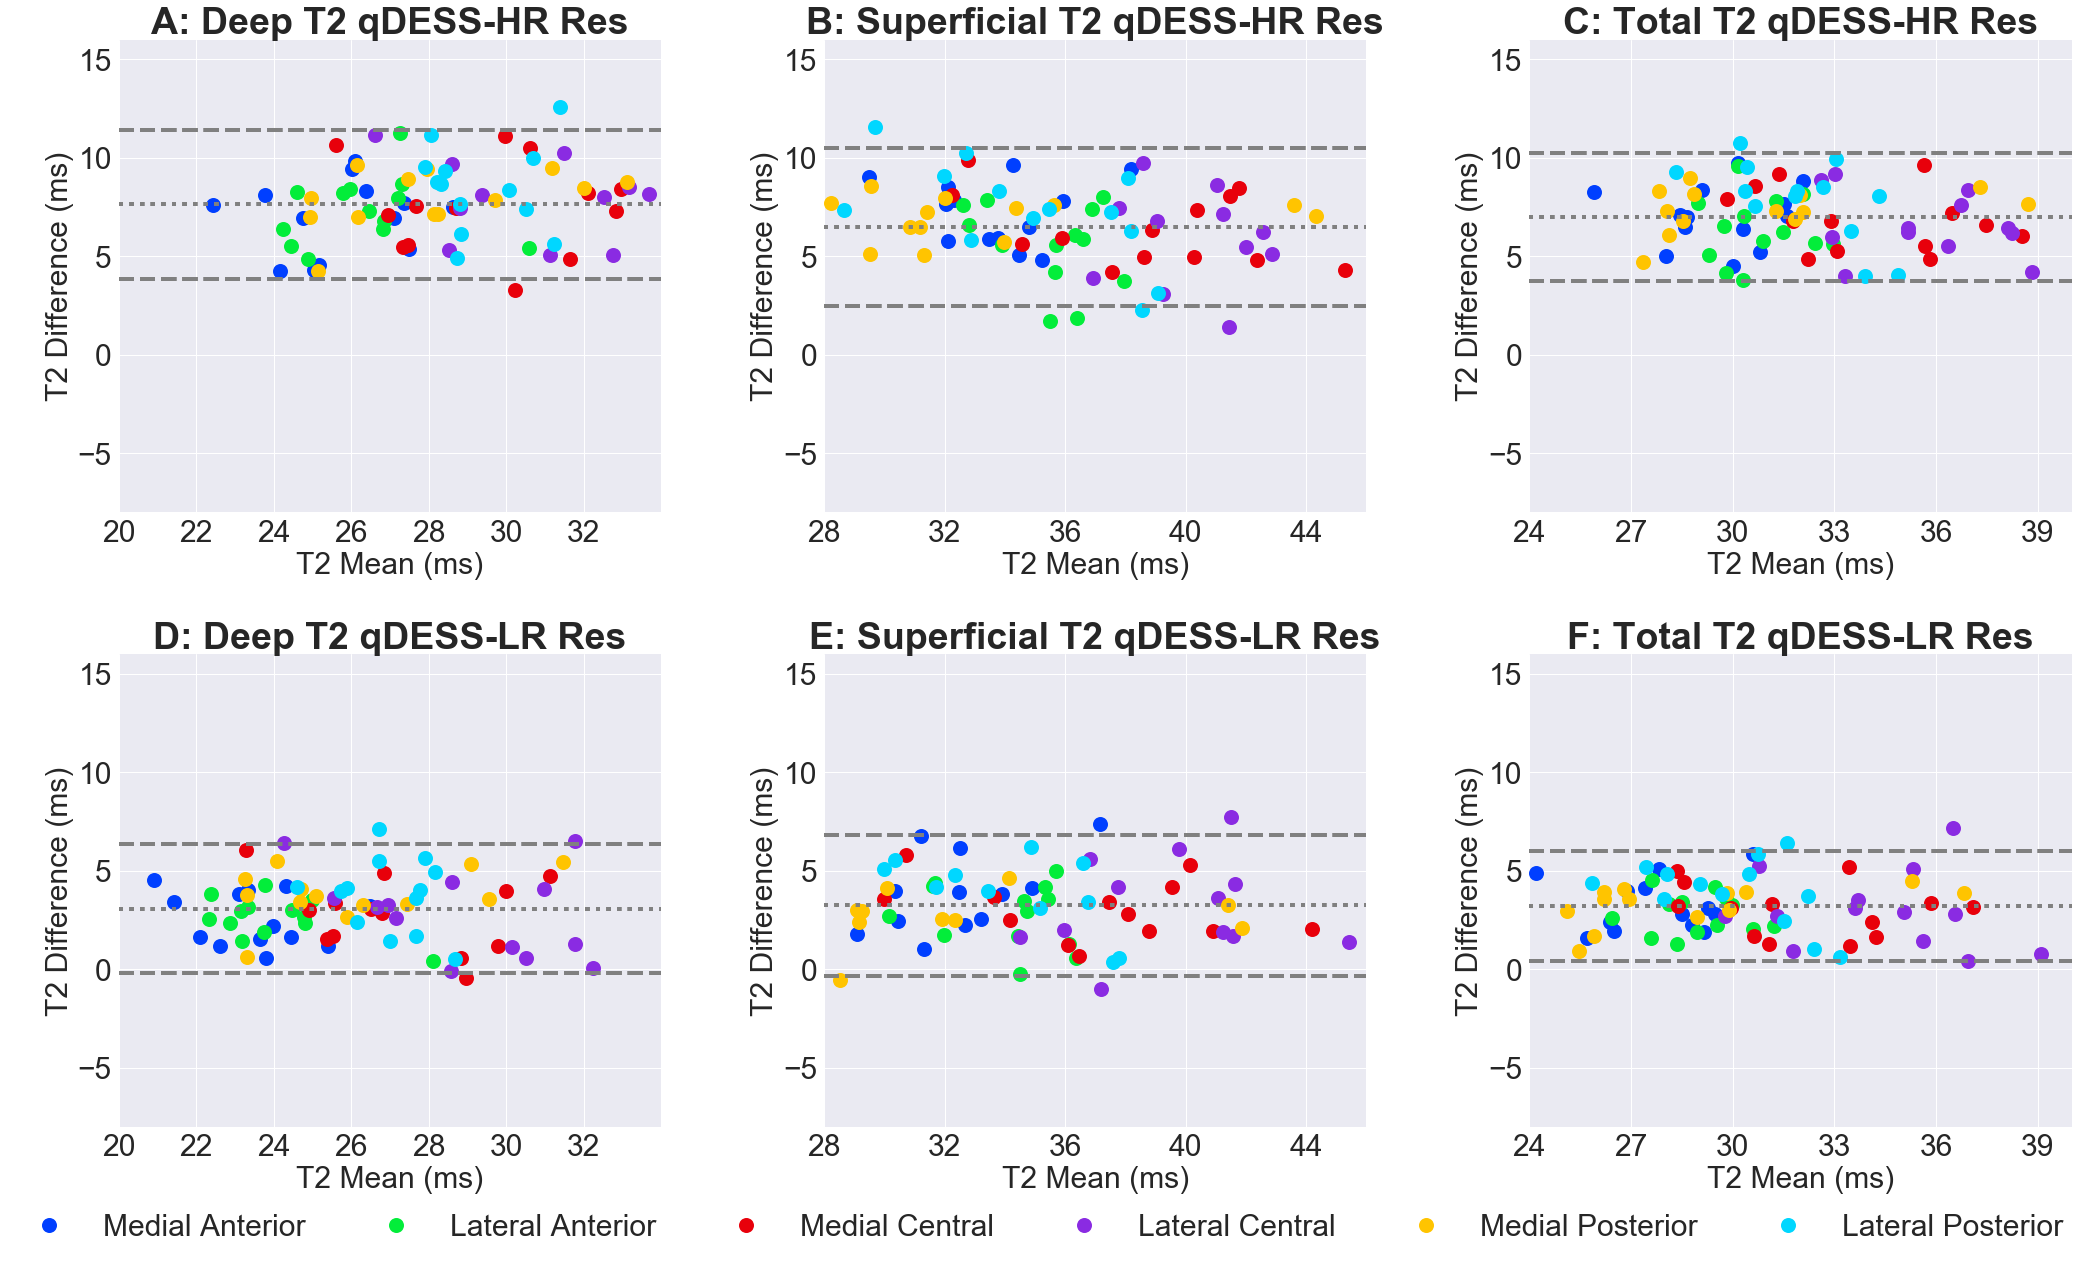
Femoral cartilage was manually segmented and sub-divided into deep/superficial layers for the medial/lateral and anterior/central/posterior subregions. T2 for each sub-region was calculated by analytically inverting the qDESS signal model for all scans (qDESS-LR, qDESS-HR, and qDESS-T2Ref)6. Approximate SNR for the entire cartilage surface was measured using an aliasing-free background region-of-interest. Pearson and concordance correlation coefficients, coefficients of variation (CV%), and Bland-Altmann plots were used to compare qDESS-HR and qDESS-LR T2 values with reference to qDESS-T2Ref.
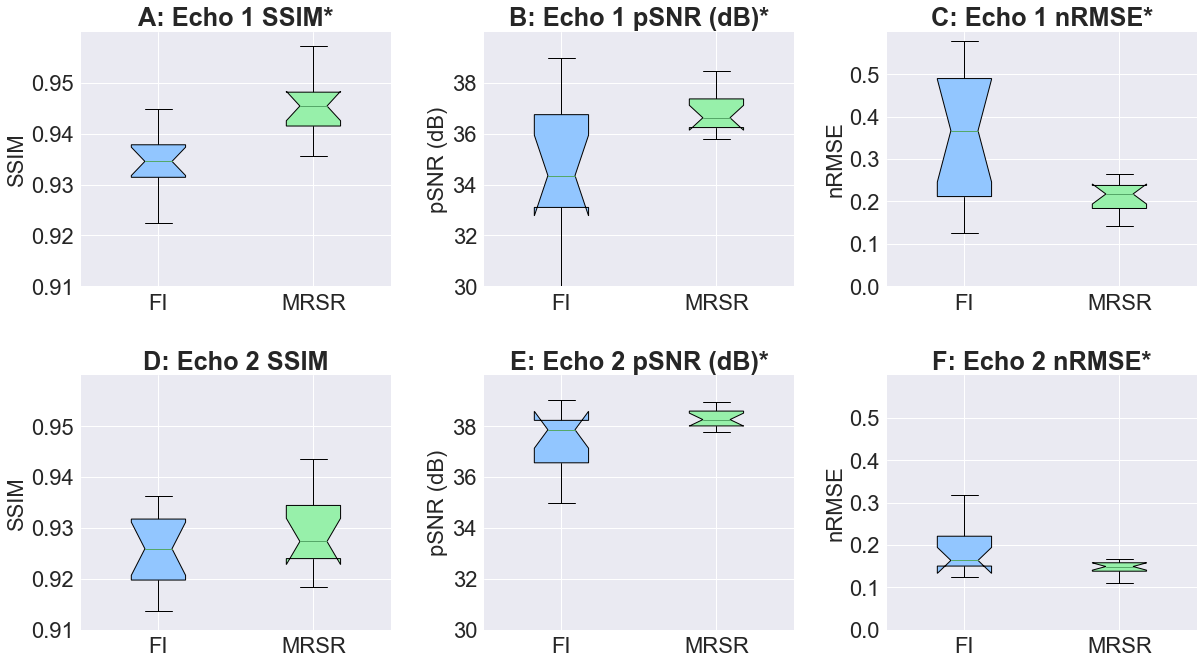
Image quality enhancement of MRSR images was compared using computer-vision metrics of normalized root-mean-square-error (nRMSE), peak SNR (pSNR), and structural similarity (SSIM) for FI images and MRSR images, compared to the qDESS-HR reference. Mann-Whitney U-Tests (α=0.05) compared quantitative and qualitative image quality, T2, and SNR metrics pooled per subject.
Results
Comparisons of image enhancements using MRSR and FI for the prospectively sampled qDESS-LR datasets (Fig.2) show better image-enhancements with MRSR and significantly higher quantitative image quality metrics of nRMSE, pSNR, and SSIM (Fig.3). In the reader study, MRSR had higher SNR and contrast than the qDESS-HR images and higher sharpness than FI images (Fig.4). qDESS-HR had a consistently higher bias in T2 values as compared to the considerably lower bias in qDESS-LR (Fig.5). qDESS-HR had lower SNR for both echoes than qDESS-LR, and both had lower SNR than q-DESS-LR (p<0.001).Discussion
While many deep-learning-based MRI super-resolution studies only achieve resolution enhancement on simulated datasets, we demonstrated resolution enhancement on prospectively undersampled images7–9. Reducing slice thickness twofold while maintaining identical scan time engenders aliasing artifacts and lower SNR due to parallel imaging, thereby reducing diagnostic utility and quantitative T2 accuracy. MRSR preserved higher SNR and improved qualitative and quantitative image quality compared to the commonly utilized FI method. The qDESS-LR concordance correlations suggest higher T2 agreement than those for qDESS-HR. There was still a small difference between qDESS -T2Ref and qDESS -LR T2 values, possibly due to lower second echo SNR for qDESS-LR, as shown previously10. However, high Pearson’s coefficients suggest minimal systematic biases, comparable to scan-rescan experiments3, which could either be accounted or corrected for and would not affect longitudinal or cross-sectional studies.Conclusion
MRSR enhanced image quality of prospectively-acquired low-resolution MRI scans verified through a qualitative reader study and maintained adequate quantitative T2 accuracy. MRSR maintained higher SNR, contrast, and T2 accuracy compared to the high-resolution scans, suggesting that it may be useful tool for enhancing the efficiency of MRI acquisitions.Acknowledgements
We would like the acknowledge the following NIH grants for providing research support: R01 AR0063643, R01 EB002524, P41 EB015891, K24 AR062068, along with GE Healthcare and Philips.References
1. Welsch, G. H. et al. Cartilage T2 assessment at 3-T MR imaging: in vivo differentiation of normal hyaline cartilage from reparative tissue after two cartilage repair procedures--initial experience. Radiology 247, 154–161 (2008).
2. Mosher, T. J. & Dardzinski, B. J. Cartilage MRI T2 relaxation time mapping: overview and applications. Semin Musculoskelet Radiol 8, 355–368 (2004).
3. Chaudhari, A. S. et al. Five-minute knee MRI for simultaneous morphometry and T 2 relaxometry of cartilage and meniscus and for semiquantitative radiological assessment using double-echo in steady-state at 3T. J. Magn. Reson. Imaging 47, 1328–1341 (2018).
4. Chaudhari, A. S. et al. Super-resolution musculoskeletal MRI using deep learning. Magn. Reson. Med. 80, 2139–2154 (2018).
5. Peterfy, C. G., Schneider, E. & Nevitt, M. The osteoarthritis initiative: report on the design rationale for the magnetic resonance imaging protocol for the knee. Osteoarthr. Cartil. 16, 1433–1441 (2008).
6. Sveinsson, B., Chaudhari, A., Gold, G. & Hargreaves, B. A simple analytic method for estimating T2 in the knee from DESS. Magn. Reson. Imaging 38, 63–70 (2017).
7. Pham, C., Ducournau, A., Fablet, R. & Rousseau, F. Brain MRI super-resolution using deep 3D convolutional networks. in 2017 IEEE 14th International Symposium on Biomedical Imaging (ISBI 2017) 197–200 (IEEE, 2017). doi:10.1109/ISBI.2017.7950500
8. McDonagh, S. et al. Context-Sensitive Super-Resolution for Fast Fetal Magnetic Resonance Imaging. 1–11 (2017).
9. Chen, Y. et al. Brain MRI Super Resolution Using 3D Deep Densely Connected Neural Networks. 1–4 (2018).
10. Chaudhari, A. S. et al. Imaging and T2 relaxometry of short-T2 connective tissues in the knee using ultrashort echo-time double-echo steady-state (UTEDESS). Magn. Reson. Med. 78, 2136–2148 (2017)
Figures