1405
Fat suppression based on single point Dixon for morphological and quantitative UTE imaging1Department of Radiology, University of California San Diego, San Diego, CA, United States, 2GE Healthcare, San Diego, CA, United States, 3Radiology Service, VA San Diego Healthcare System, San Diego, CA, United States
Synopsis
Use of fat saturation pulses with UTE sequences can improve short T2 contrast and parameter estimation, but can reduce the short T2 signal due to the broad spectrum. Moreover, conventional two-/three-point Dixon-based methods can misestimate fat contents due to the short T2* decay in UTE imaging. In this study, we demonstrate feasibility and efficacy of a single point Dixon method to suppress fat for morphological and quantitative UTE imaging. We evaluate the proposed framework in in vivo experiments in a clinical 3T MR system: morphological UTE imaging and UTE-T1 mapping in knee joints and UTE-bone imaging in a leg.
Introduction
Fat suppression techniques are widely used in many MRI applications (e.g., MSK and abdominal imaging) to achieve better image contrast with suppressed signal from adipose tissues. UTE imaging can also benefit from fat suppression for morphological and quantitative imaging, but unfortunately, conventional fat suppression methods are problematic since the tissues with short T2* decay demonstrate a broad spectrum; thusly, fat-saturation pulses may undesirably suppress these tissues’ signals in addition to those of fat. Moreover, the regular two-/three-point Dixon methods do not consider water signal decay, so the estimated fat and water signals can deviate. In this study, we propose a fast, simple, and robust method to suppress fat signal for morphological and quantitative UTE imaging utilizing a single-point Dixon (1p-Dixon) approach.Methods
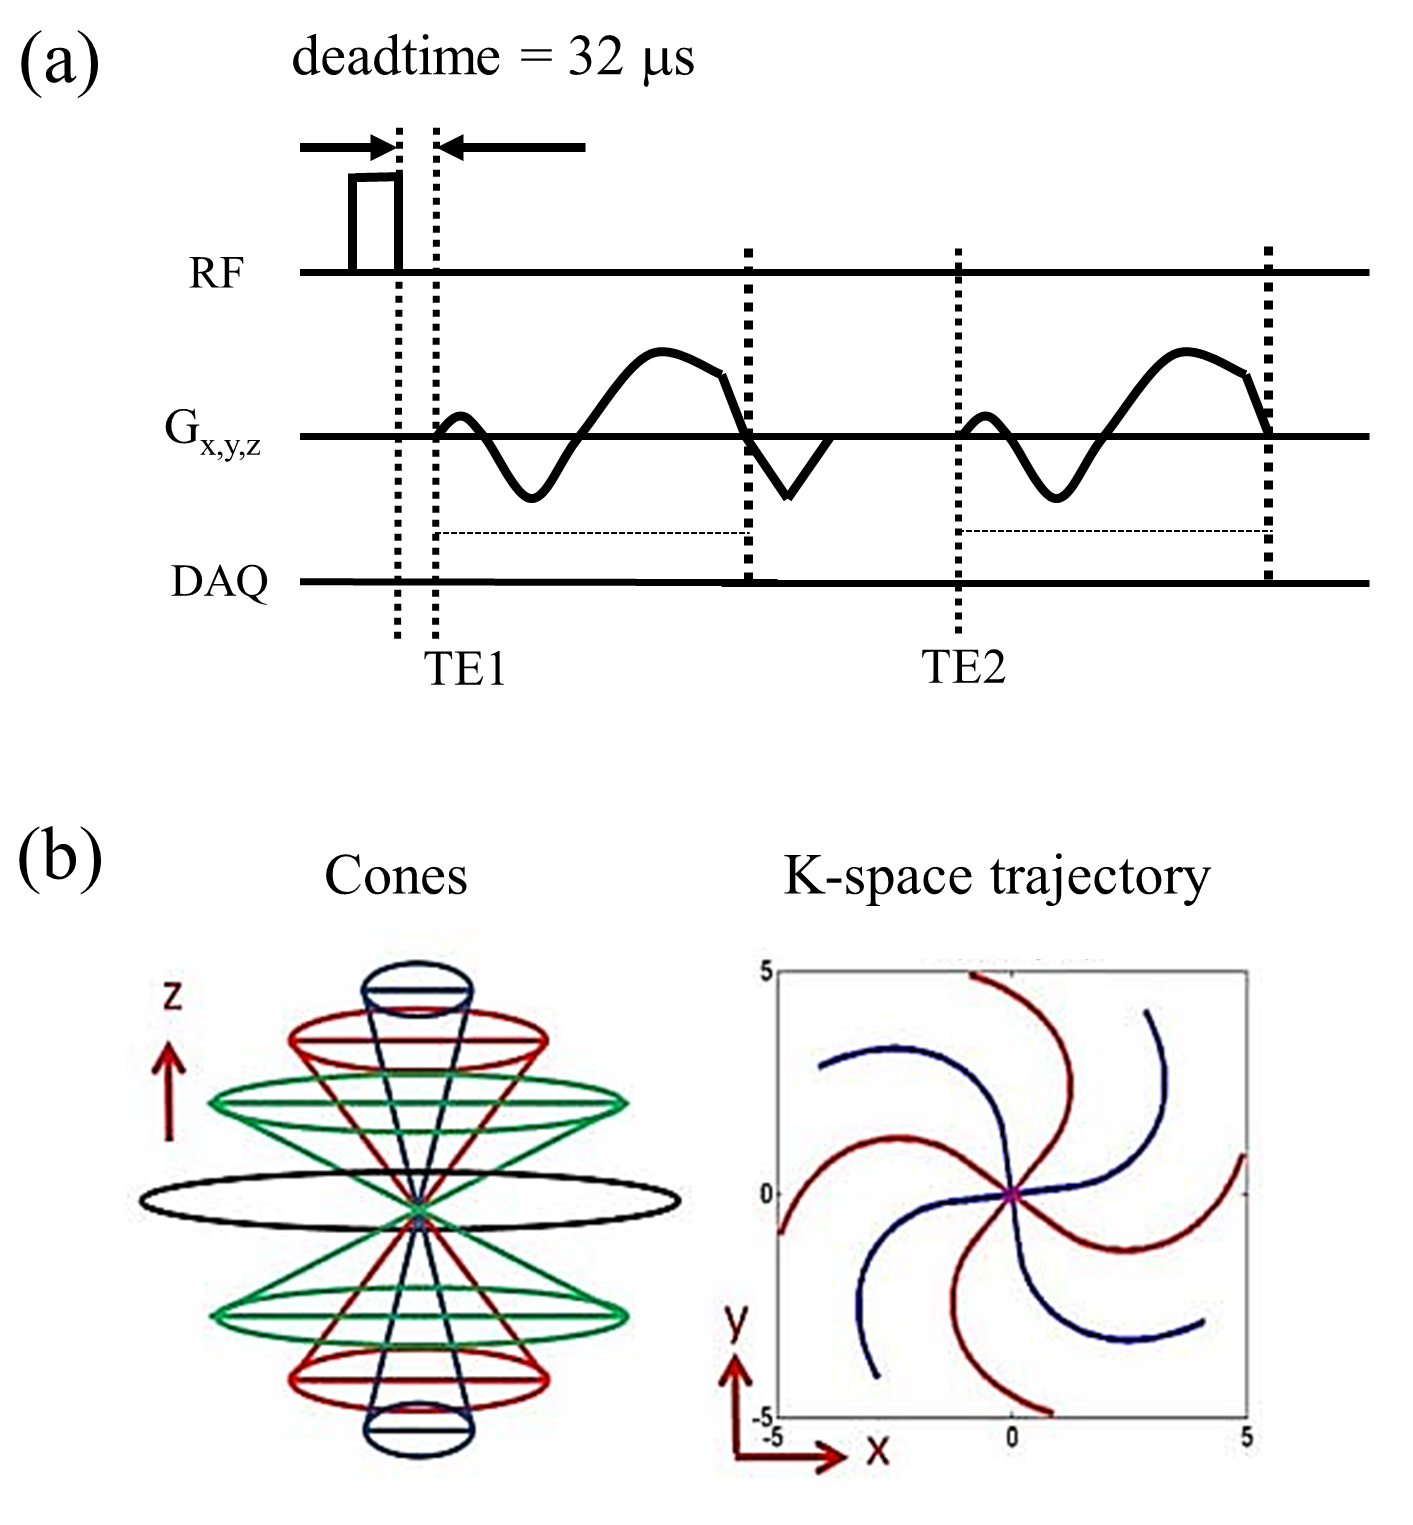
In the proposed method, 3D-Cones dual echo UTE imaging is utilized to acquire two images at TE1(UTE) and TE2(GRE) in a rapid single scan (Figure 1). The complex MR signal in the image at TE2 is directly decomposed to fat and water components using the 1p-Dixon approach1,2 after correcting phase errors caused by phase offset and B0 inhomogeneity. Then, fat suppression can be performed by applying a scaling factor to the fat image and simply subtracting the estimated fat image from the UTE image. The scaling factor is automatically found such that error between the UTE image and the scaled sum of the fat and water images is minimized. The following in vivo experiments were performed with 4 healthy volunteers on 3T GE-MR750: (Experiment-1) morphological UTE knee imaging with 35- and 36-year-old males, (Experiment-2) UTE variable flip angle (VFA) T1 mapping on the knee of a 36-year-old male, and (Experiment-3) UTE bone imaging on the lower leg of a 31-year-old male. Imaging parameters for Experiment-1 were: GE 8-CH transmit/receive knee coil, FA=20 degrees, TE1/TE2/TR=32µs/2.7ms/20ms, readout BW=±125kHz, FOV=160x160x96mm3, matrix size=256x256x32, scan time=3min 53sec. The same parameters were used for Experiment-2 except for the following parameters: four scans performed with FA=5, 10, 20, or 30 degrees; TE1/TE2/TR=32µs/2.9ms/20ms. Experiment-3 was performed with the same parameters as Experiment-1 except for: matrix size=160x160x24 and scan time=1min 54sec. External field map acquisition was performed with an in-plane resolution reduced by a factor of 2.Results
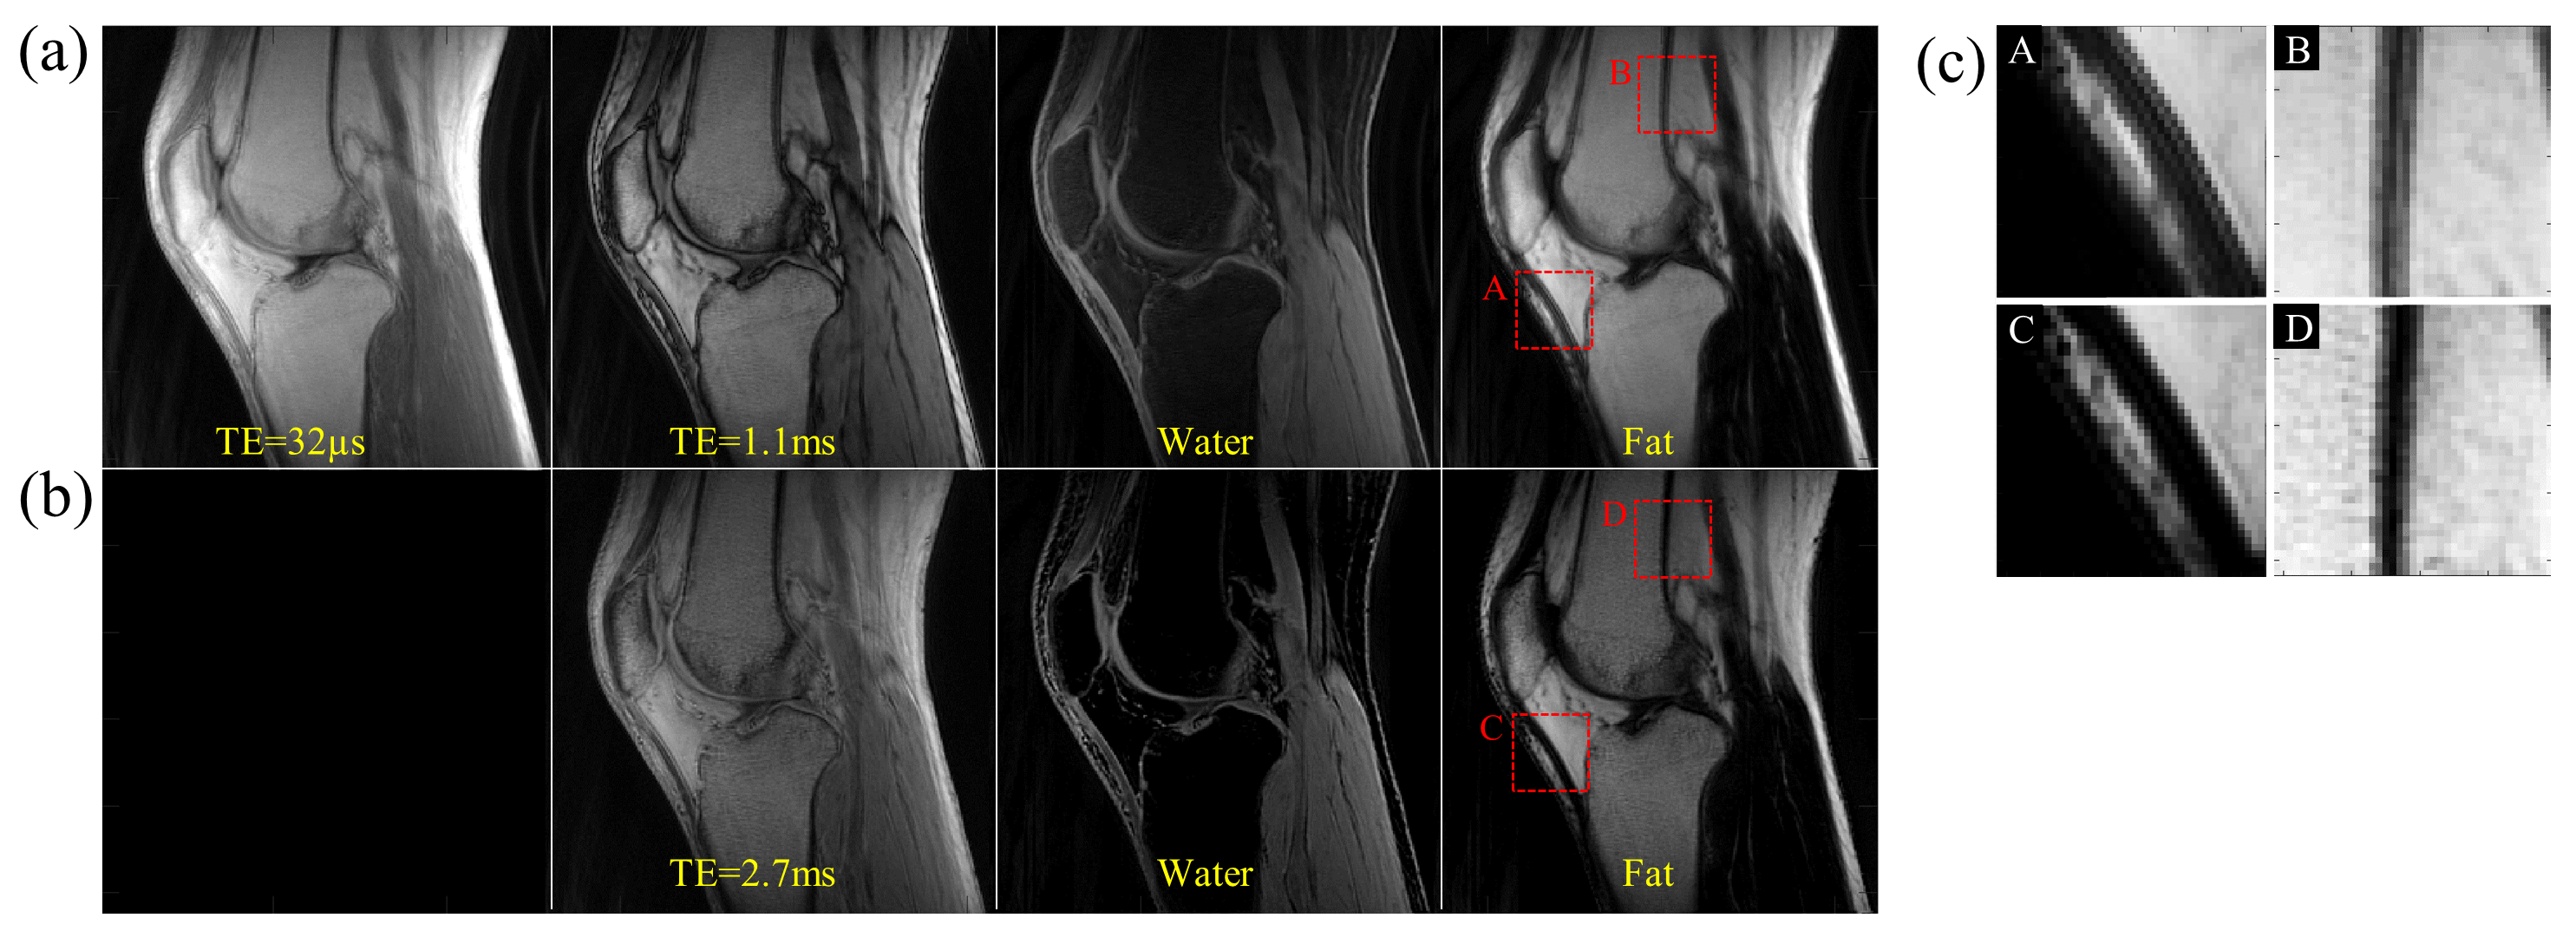
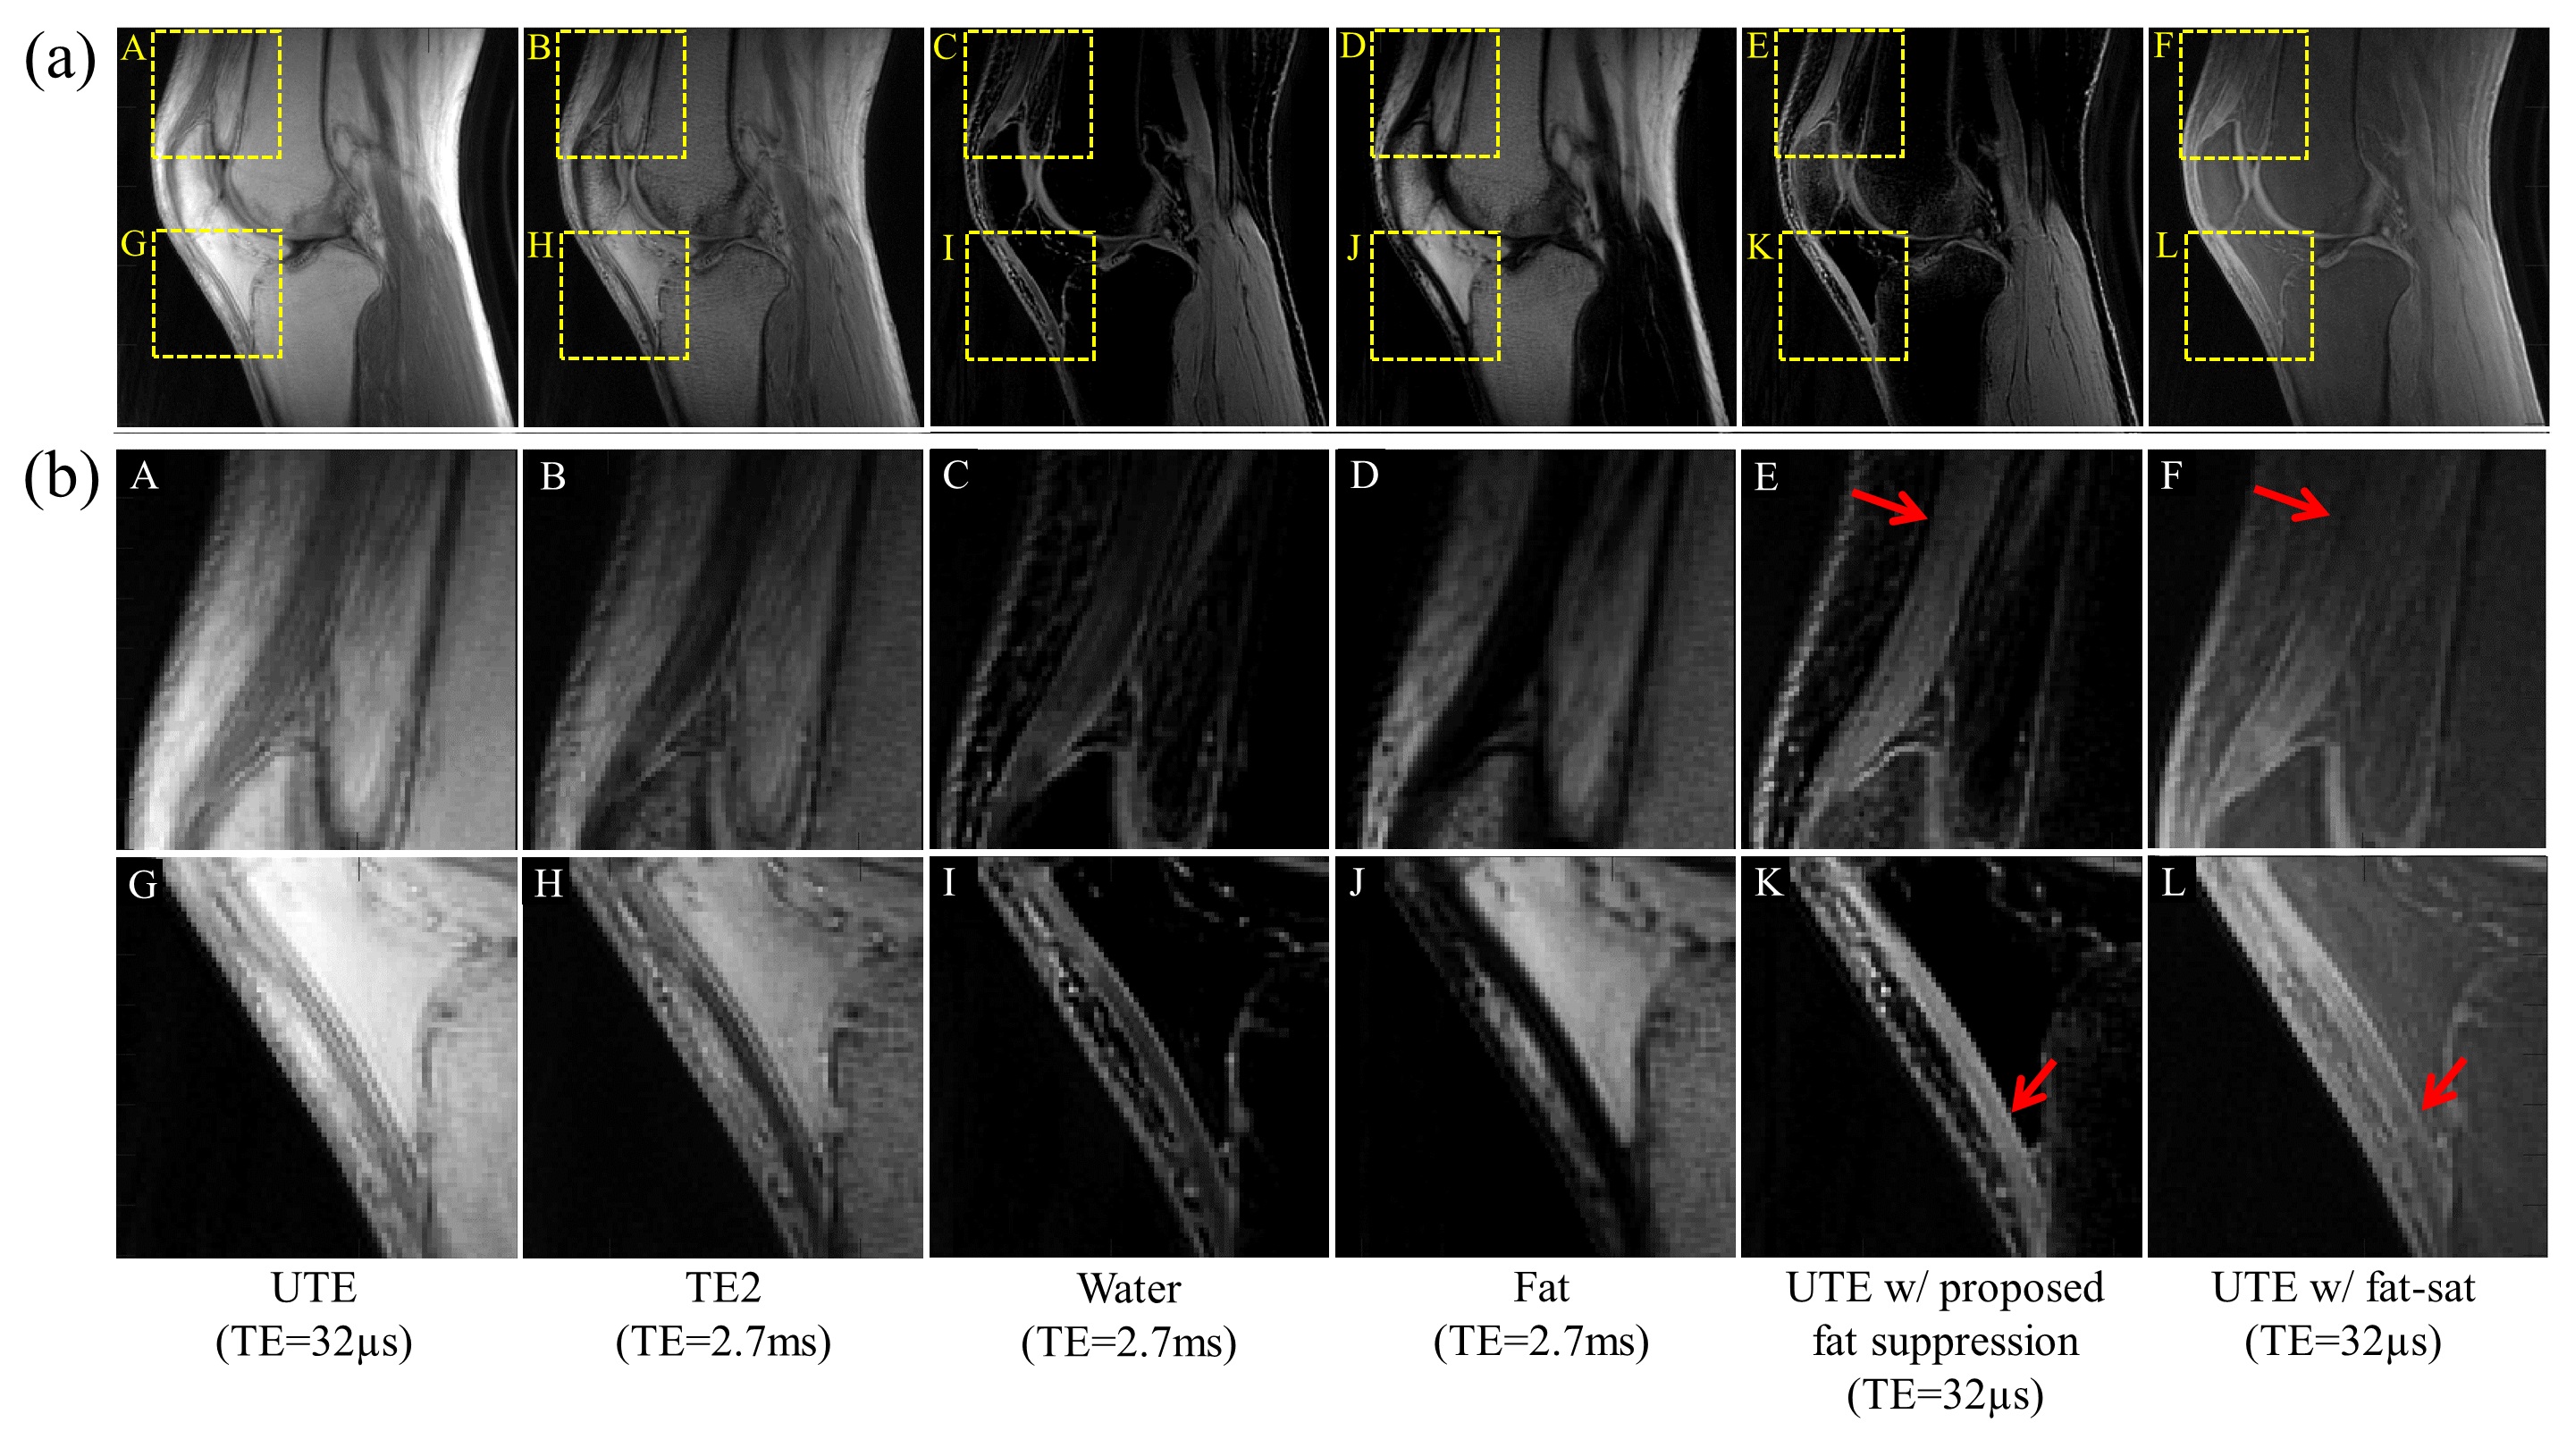
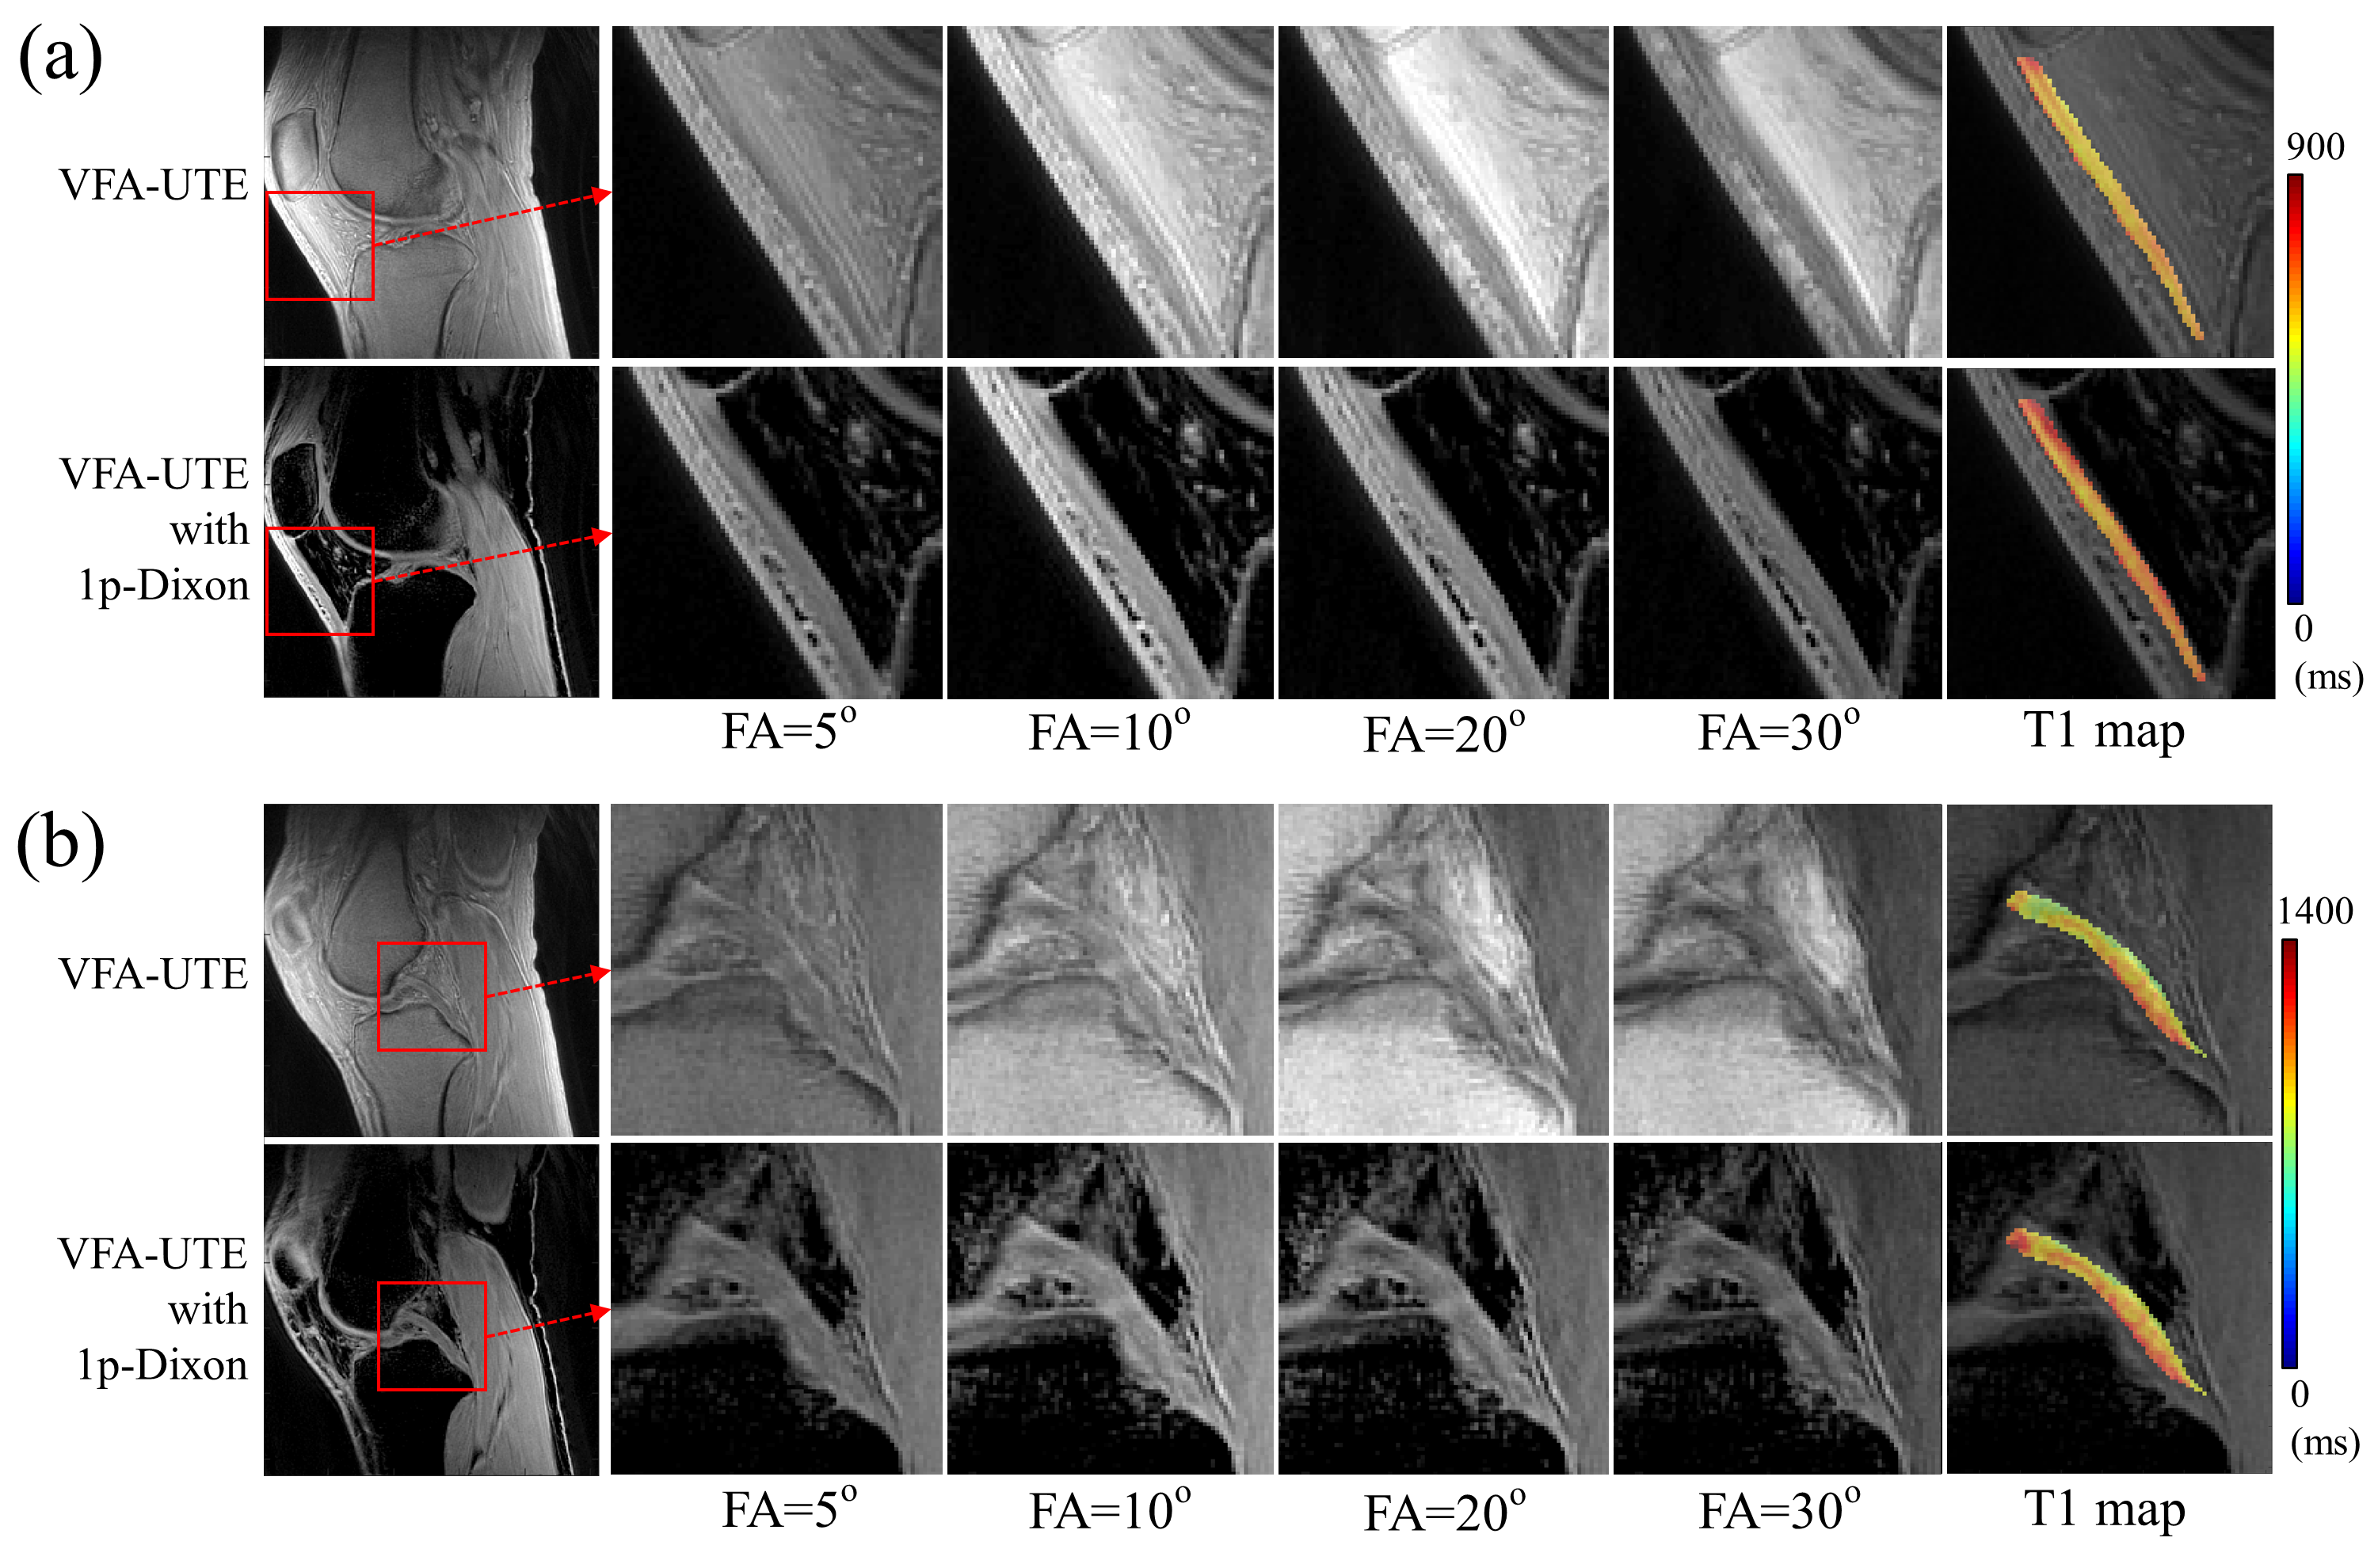
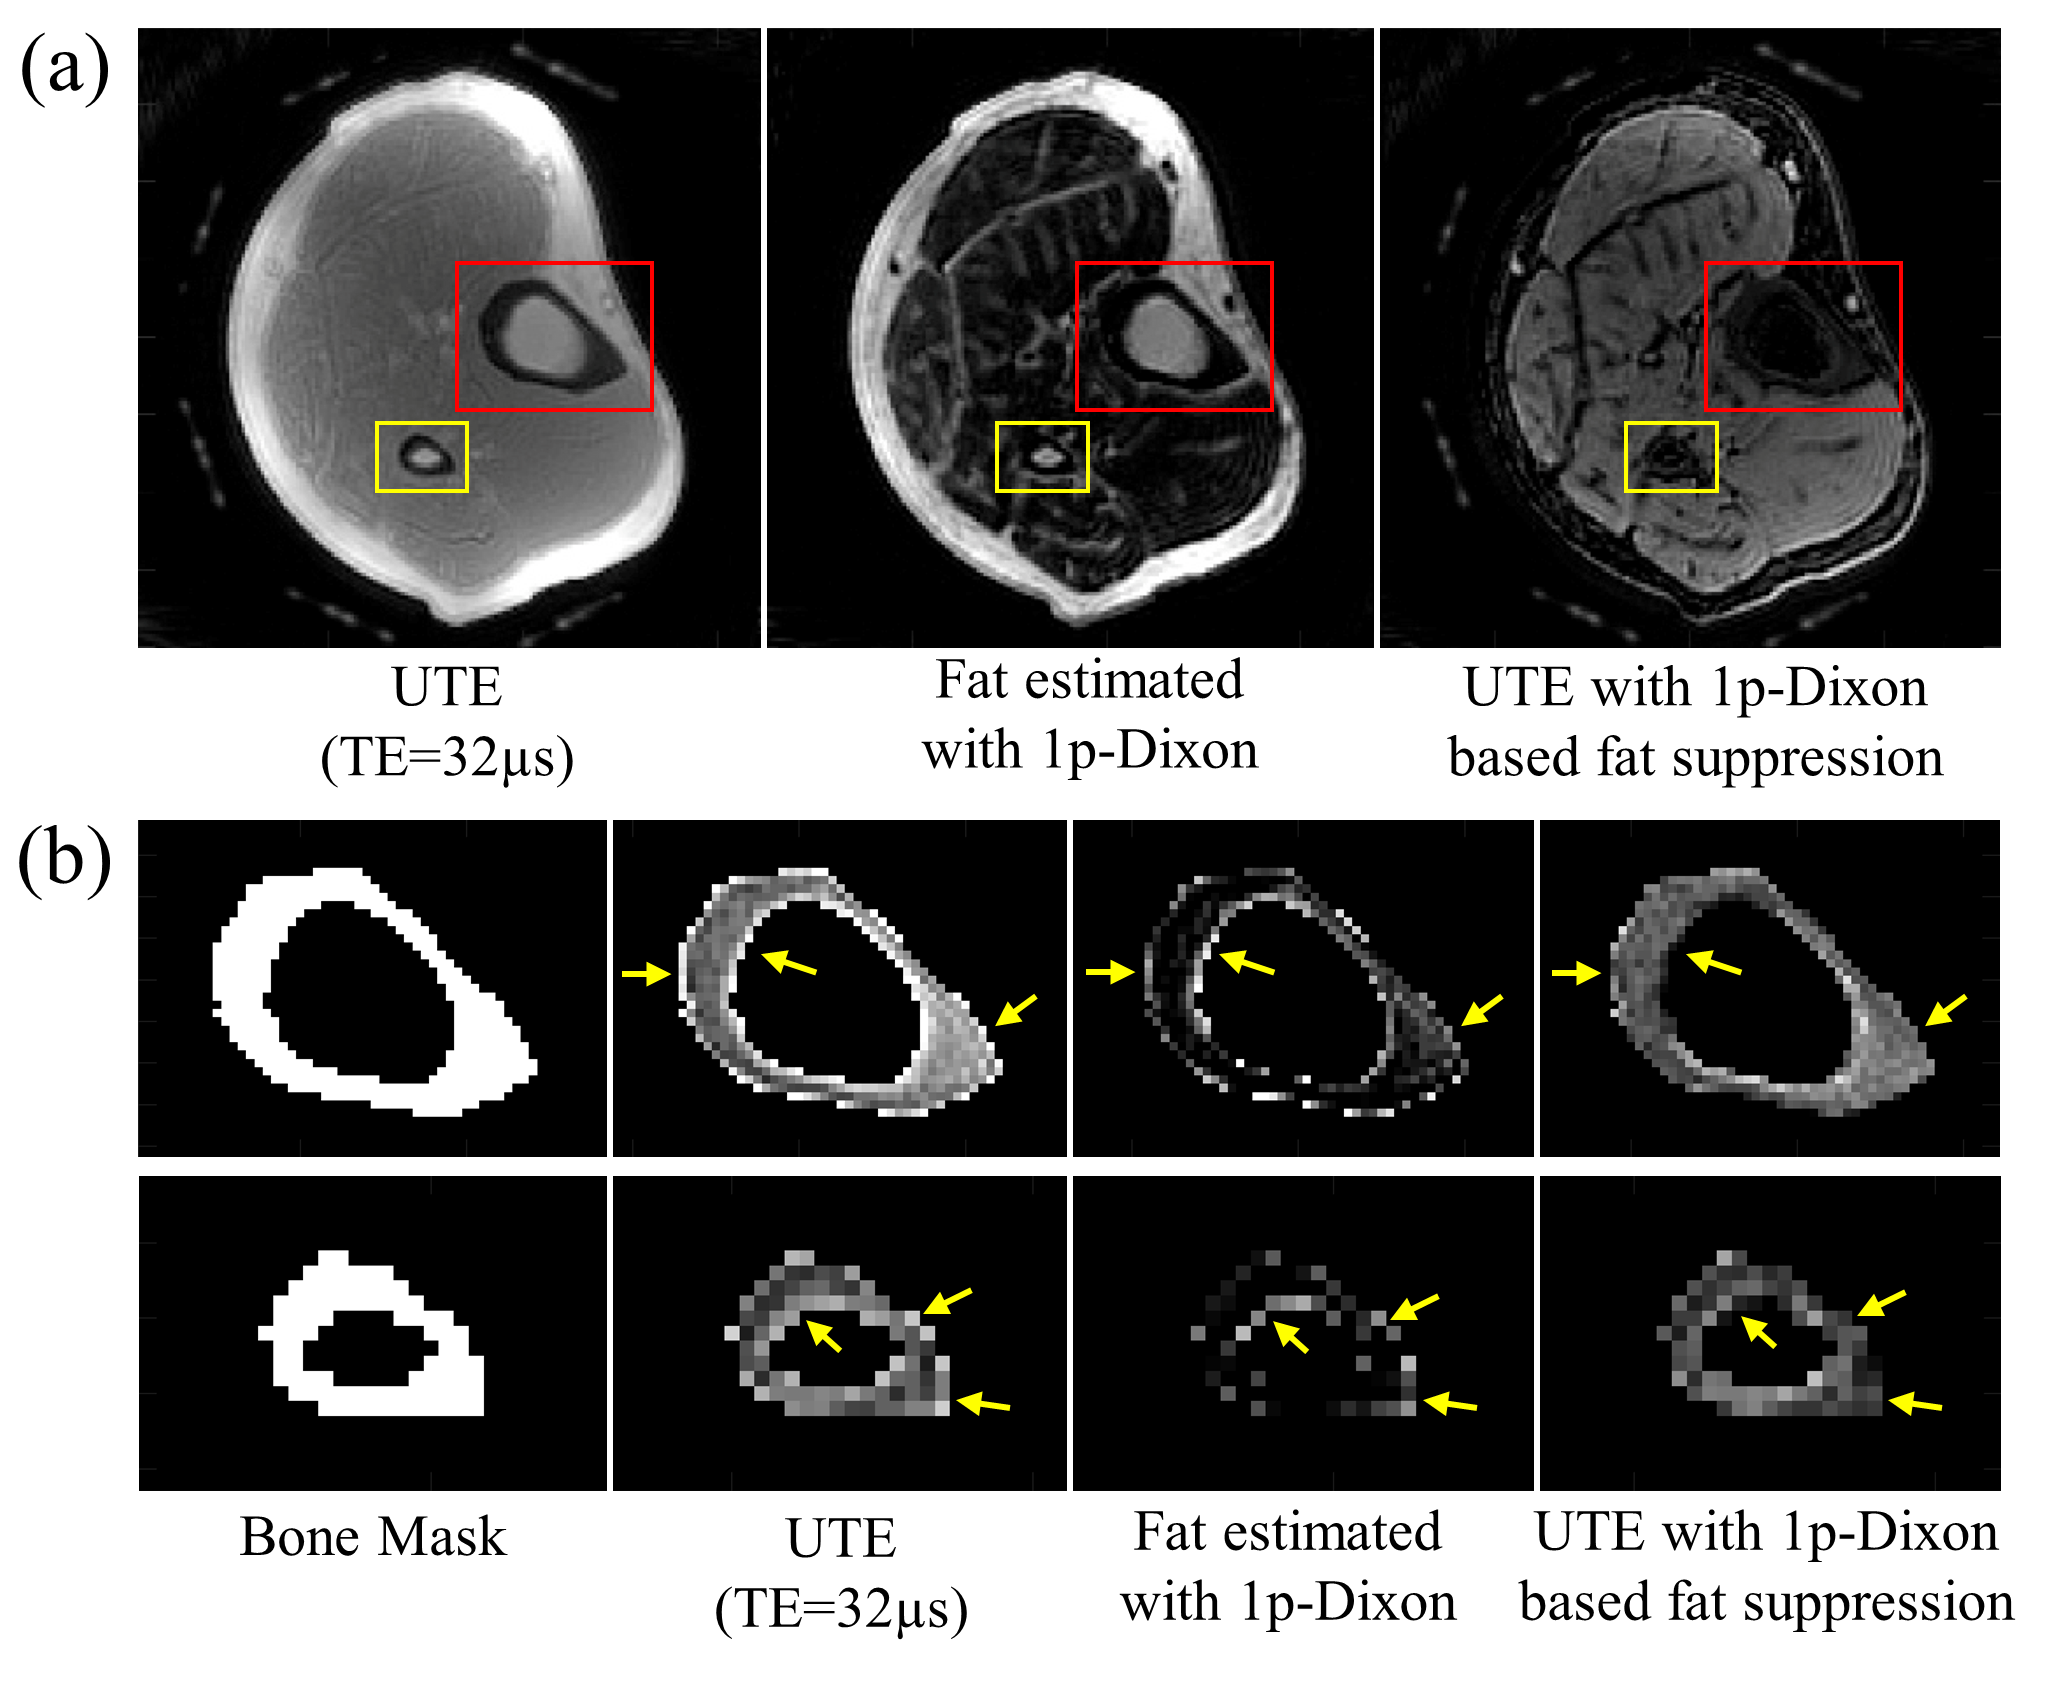
Figure 2 shows comparisons between 2p-Dixon and 1p-Dixon in Experiment-1. As demonstrated, the short T2* decay in water is misinterpreted as the coexistence of fat and water signals with 2p-Dixon. Therefore, the fat signal is misestimated in tissues containing short T2* components, as clearly indicated in the zoomed-in images of Figure 2-c; meanwhile, the 1p-Dixon based method does not show this misestimated fat signal. Figure 3-a shows the comparison between the 1p-Dixon based method and conventional fat saturation in Experiment-1. As shown in the zoomed-in images of Figure 3-b, the proposed 1p-Dixon based approach shows strong signal intensity in the quadriceps and in the patellar tendons, with less spatial variation in the fat suppressed UTE image, while the UTE image with FatSat exhibits gradually varying signals as indicated by red arrows. The pattern of signal variation in the UTE image with fat-saturation shows high similarity to the estimated water images at TE2 (2.7ms), where most of the short T2* signals already decayed. This observation implies broad-spectrum short T2* components were partially affected by the fat saturation pulse. For both subjects in Experiment-1, the proposed 1p-Dixon was able to suppress fat and to clearly visualize the tendons. The measured contrast-to-noise-ratio (CNR) for the quadriceps tendon with respect to the adjacent adipose tissue was 16.0±1.6 or 10.9±2.1 in the 1p-Dixon method, and 4.6±1.0 or 2.6±1.0 in the fat-saturation for the two subjects. The measured CNR for the patellar tendon with respect to the infrapatellar fat pad was 26.8±1.3 or 24.1±4.1 in the 1p-Dixon method and 17.5±1.0 or 9.9±1.9 in the fat-saturation for the two subjects. Figure 4 demonstrates 1p-Dixon applied to quantitative VFA-UTE-T1 mapping (Experiment-2). Without or with 1p-Dixon fat suppression, the estimated T1 was 633.83±50.06 or 685.96±58.99, respectively, for the patellar tendon (Figure 4-a), and 914.75±123.71 or 989.93±132.86, respectively, for the posterior cruciate ligament (Figure 4-b). Figure 5 shows the UTE bone imaging with application of 1p-Dixon method (Experiment-3), where the proposed 1p-Dixon method drastically reduced partial volume artifact and aliased signal from fat (yellow arrows).Discussion and Conclusion
The proposed 1p-Dixon-based fat suppression method is fast and robust, and addresses problems with conventional 2p-Dixon or fat-saturation for UTE imaging. This approach is simple and therefore very flexible for incorporation into various types of UTE imaging schemes such as UTE-T2* mapping3,4, UTE-T1 mapping5,6, and UTE-magnetization transfer imaging7,8.Acknowledgements
The authors acknowledge research support from GE Healthcare, NIH (1R21AR073496, R01AR068987, R01AR062581) and VA Clinical Science and Rehabilitation R&D Awards (I01CX001388 and I01RX002604).References
1. Ma J. A single-point dixon technique for fat-suppressed fast 3D gradient-echo imaging with a flexible echo time. J. Magn. Reson. Imaging 2008;27:881–890 doi: 10.1002/jmri.21281.
2. Yu H, Reeder SB, McKenzie CA, et al. Single acquisition water-fat separation: Feasibility study for dynamic imaging. Magn. Reson. Med. 2006;55:413–422 doi: 10.1002/mrm.20771.
3. Du J, Diaz E, Carl M, Bae W, Chung CB, Bydder GM. Ultrashort echo time imaging with bicomponent analysis. Magn Reson Med 2012;67:645–649 doi: 10.1002/mrm.23047.
4. Du J, Bydder GM. Qualitative and quantitative ultrashort-TE MRI of cortical bone. NMR Biomed. 2013;26:489–506 doi: 10.1002/nbm.2906.
5. Chen J, Chang EY, Carl M, et al. Measurement of bound and pore water T 1 relaxation times in cortical bone using three-dimensional ultrashort echo time cones sequences. Magn. Reson. Med. 2017;77:2136–2145 doi: 10.1002/mrm.26292.
6. Ma Y-J, Lu X, Carl M, et al. Accurate T 1 mapping of short T 2 tissues using a three-dimensional ultrashort echo time cones actual flip angle imaging-variable repetition time (3D UTE-Cones AFI-VTR) method. Magn. Reson. Med. 2018;608:598–608 doi: 10.1002/mrm.27066.
7. Ma YJ, Shao H, Du J, Chang EY. Ultrashort echo time magnetization transfer (UTE-MT) imaging and modeling: magic angle independent biomarkers of tissue properties. NMR Biomed. 2016;29:1546–1552 doi: 10.1002/nbm.3609.
8. Ma YJ, Chang EY, Carl M, Du J. Quantitative magnetization transfer ultrashort echo time imaging using a time-efficient 3D multispoke Cones sequence. Magn. Reson. Med. 2018;79:692–700 doi: 10.1002/mrm.26716.
Figures