1403
Effects of sampling window on quantitative imaging of major tissues in the knee joint using 3D ultrashort echo time (UTE) Cones sequences1Department of Radiology, UC San Diego, San Diego, CA, United States, 2Department of Radiology, Shanghai Tenth People's Hospital of Tongji University, Shanghai, China, 3GE healthcare, San Diego, CA, United States, 4Radiology Service, VA San Diego Healthcare System, San Diego, CA, United States
Synopsis
We have developed a series of 3D UTE-Cones MRI techniques for quantitative assessment of all major tissues in the knee joint. Continuing improvements in scan time will facilitate their clinical use, but it remains unclear how acceleration affects quantification. This study focused on the effects of stretching sampling windows on quantitative UTE biomarkers in cadaveric human knee joint tissues. We found that extending sampling windows results in vastly reduce scan time without adverse effects on quantitative accuracy of T1, AdiabaticT1ρ, macromolecular fraction and MTR of articular cartilage, menisci, tendons and ligaments in the knee joint.
Introduction
Articular cartilage, menisci, ligaments, tendons and bone are the major tissues in the human knee, all of which are vital to the normal function of this joint (1-3). Conventional MRI sequences can only image long T2 tissues such as the superficial layers of cartilage, with little information from short T2 tissues such as menisci, ligaments, tendons and bone. Recently a series of quantitative 3D ultrashort echo time (UTE) Cones MRI techniques have been developed to evaluate all the major tissues in the knee (4-8). However, multi-parametric quantification results in relatively long scan times. This adversely affects clinical throughput and patient motion during acquisition is also a concern. The total scan time can be greatly reduced by stretching the spiral trajectory during Cones data acquisition, however, the effects of acceleration on accurate quantification remain unknown. This study was aimed to evaluate the quantitative errors associated with extended sampling window on biomarkers including T1, AdiabaticT1ρ, MTR and macromoleculat fraction (MMF) for all major knee joint tissues.Methods
Sample preparation: High resolution whole knee imaging was performed on 9 whole knee joint specimens from 8 donors (65 ± 26 years old, 7 males and 1 female).
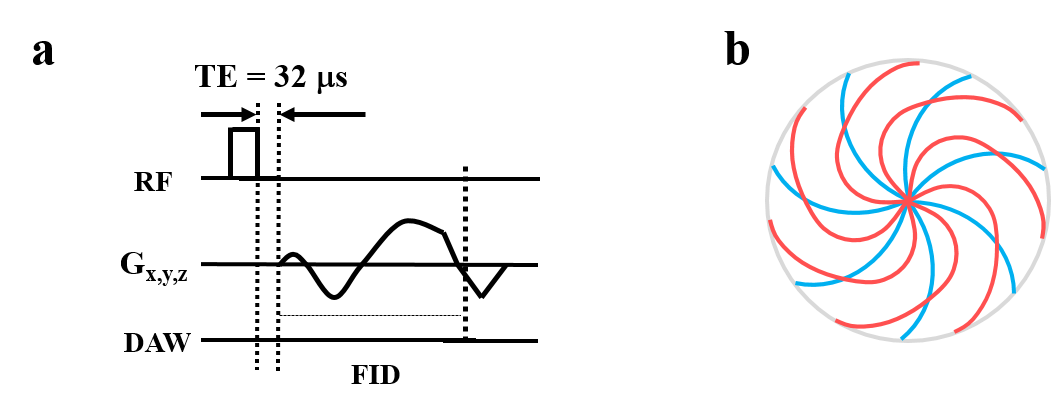
UTE sequences: All imaging was performed on a 3T clinical MRI scanner (MR750, GE Healthcare Technologies, Milwaukee, WI, USA) using a knee coil. All 3D UTE-Cones sequences used a short rectangular excitation pulse followed by 3D spiral sampling with various data acquisition window lengths (Figure 1a, 1b). Three quantitative imaging protocols were performed: T1 was mapped using a 3D UTE-Cones AFI-VFA method with B1 correction (FAs = 5, 10, 20, 30 ˚, TR = 20 ms), AdiabaticT1ρ was mapped using the 3D UTE-Cones-Adiabatic T1ρ sequence which employs adiabatic full passage pulse train prepared UTE-Cones acquisitions (spin lock time=0, 12, 24, 36, 48, 72, 96 ms, TR=500, FA=10˚), MTR and MT modeling were performed with a 3D UTE-Cones-MT sequence (MT saturation power = 500°, 1000°, and 1500°, frequency offset = 2, 5, 10, 20, and 50 kHz, TR=100 ms, FA = 7˚). A two-pool MT modeling was performed for calculation of macromolecular proton fraction. Cones trajectories were used for all quantitative UTE measurements. Each measurement was repeated with three sampling windows: Cones_1.0 with no stretching and 1116 µs sampling window (reference), Cones_1.5 with a stretching factor of 1.5 and 1668 µs sampling window, and Cones_2.0 with a stretching factor of 2.0 and 2232 µs sampling window . Other imaging parameters included: FOV = 15×15×8 cm, acquisition matrix = 256×256, 40 slices, and bandwidth = 166 kHz.
Data analysis: The effect of sampling window on each biomarker was investigated for cartilage, menisci, ligaments and tendons using manually drawn regions-of-interest (ROIs). Error percentage [(Results longer cones –Results Cones 1.0)/ Results Cones 1.0] for each biomarker was calculated for Cones_1.5 and Cones_2.0 using results from Cones_1.0 as a reference standard.
Results
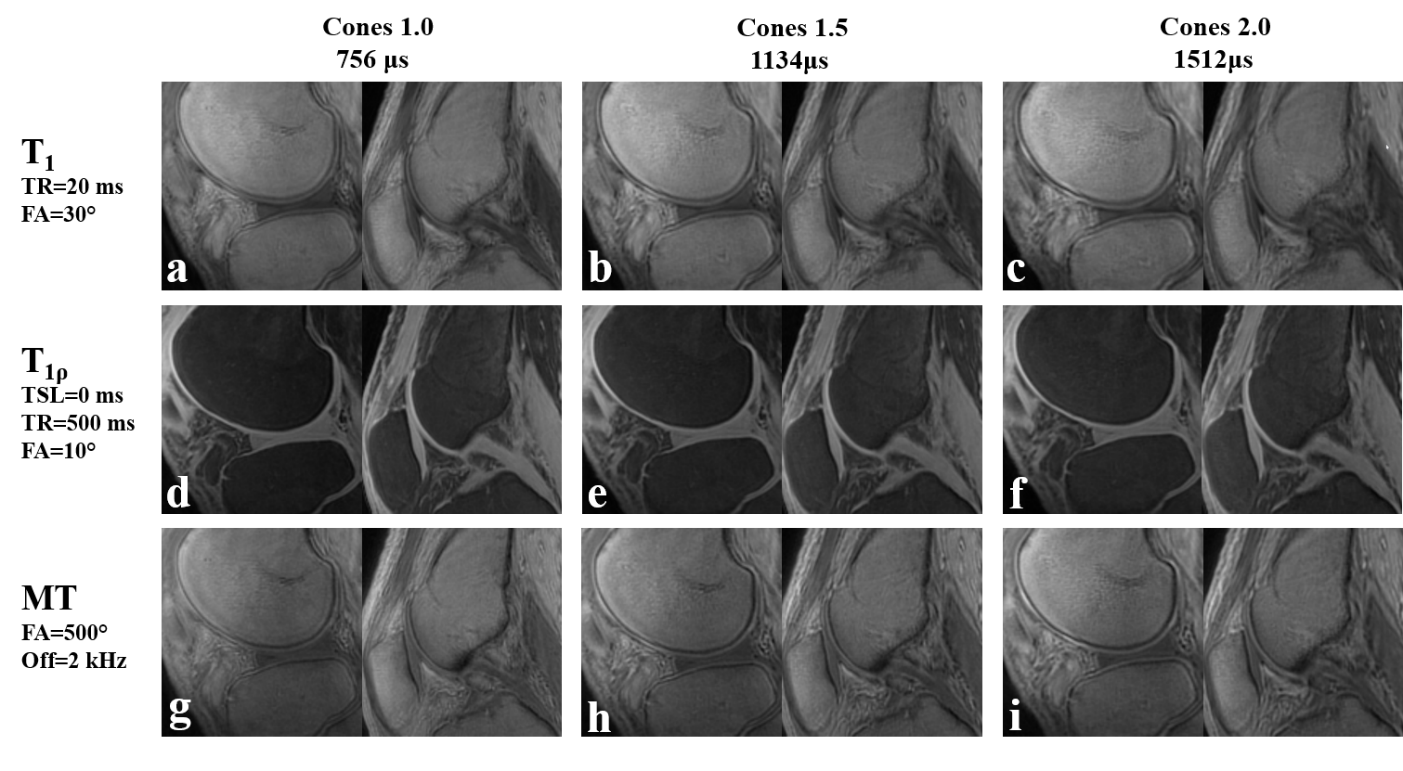
Figure 2 shows no distinct morphological differences between Cones_1.0 to Cones_2.0 for long T2 tissue components such as the superficial layer of cartilage. However, short T2 blurring was observed in tissues with short T2 components such as the deep layer of cartilage and ligaments (e.g. PCL).
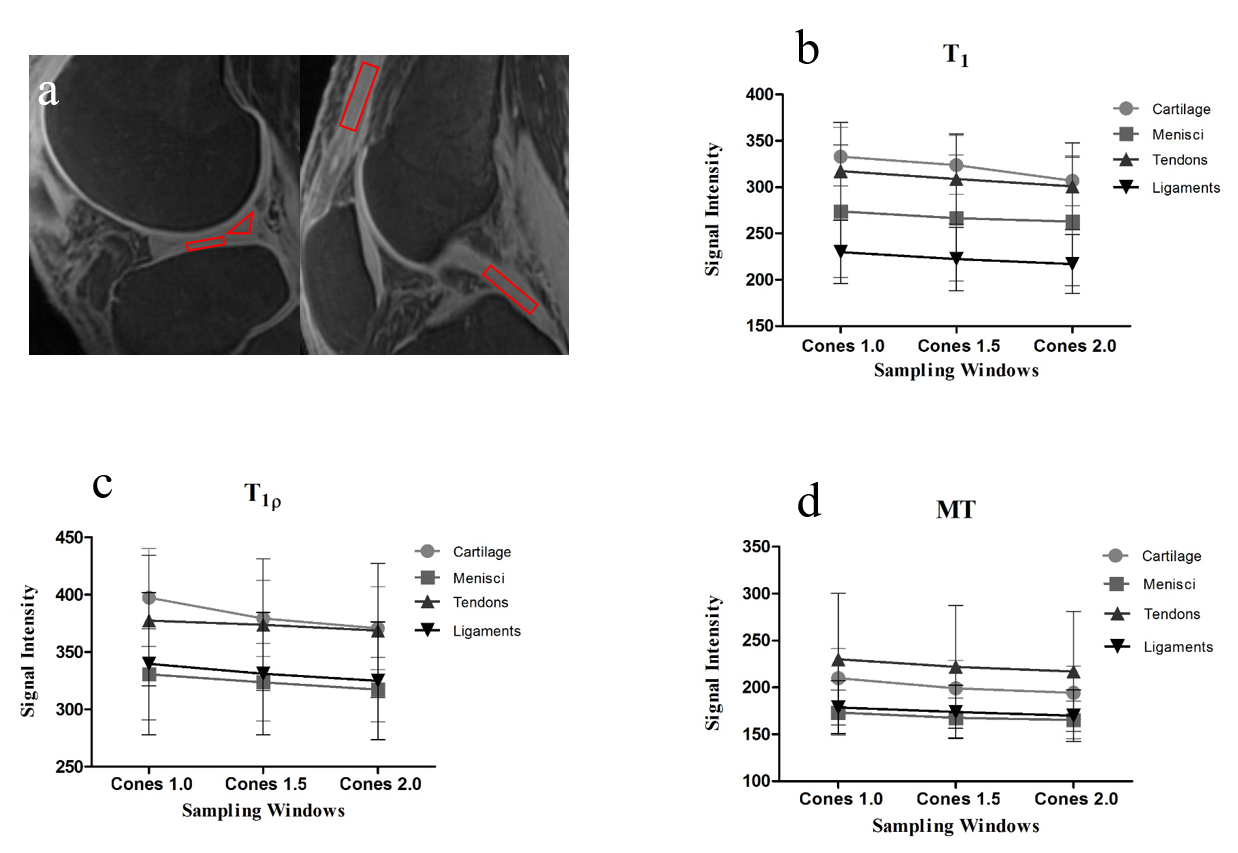
Figure 3 shows that the signal intensities of T1, AdiabaticT1ρ and MT images decreased for all evaluated tissues by increasing the stretching factor, indicating signal loss for all knee joint tissues by extending the sampling window.
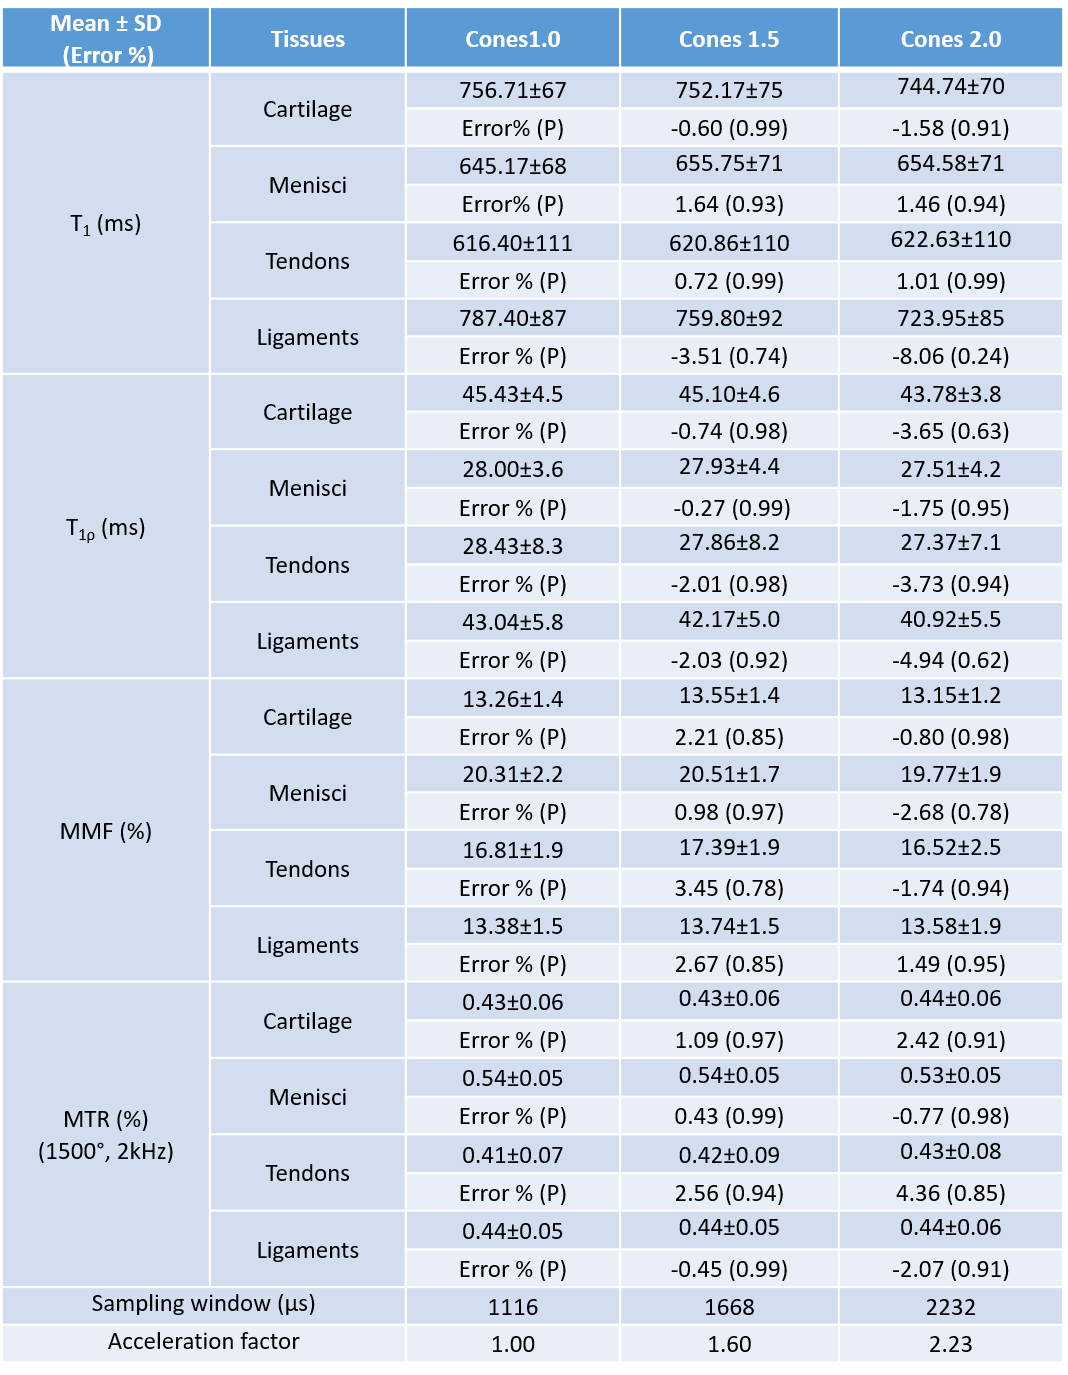
Figure 4 summarizes 3D UTE-Cones biomarker measurements and errors for cartilage, menisci, tendons and ligaments with all three sampling windows. As for T1, AdiabaticT1ρ, macromolecular fraction and MTR, non-significantly increased errors were observed with a longer sampling window. The error percentages were within 5% for all evaluated tissues except the ligaments with error larger than 5% when sampling window was 2232 µs. (p>0.05).
Discussion
Limited effects of acceleration on quantitative UTE-based biomarkers were observed for all evaluated tissues. One possible explanation might be that the quantitative methods rely mostly on central k-space data and be less sensitive to short T2 blurring than morphological imaging. Moreover, the Cones_1.0 spiral trajectory sampling window might be already long, such that extending sampling window would have less effect on quantitative results.Conclusion
This study suggests that quantitative UTE-MRI measurements of major knee joint tissues can be greatly accelerated using longer sampling windows without significant quantification errors.Acknowledgements
The authors acknowledge grant support from NIH (R01AR062581) and VA Clinical Science and Rehabilitation R&D Awards (I01CX001388 and I01RX002604).References
1. Brandt KD, Radin EL, Dieppe PA, van de Putte L. Yet more evidence that osteoarthritis is not a cartilage disease. Annals of the rheumatic diseases 2006;65(10):1261-1264.
2. Hunter DJ, Zhang YQ, Niu JB, Tu X, Amin S, Clancy M, Guermazi A, Grigorian M, Gale D, Felson DT. The association of meniscal pathologic changes with cartilage loss in symptomatic knee osteoarthritis. Arthritis and rheumatism 2006;54(3):795-801.
3. Tan AL, Toumi H, Benjamin M, Grainger AJ, Tanner SF, Emery P, McGonagle D. Combined high-resolution magnetic resonance imaging and histological examination to explore the role of ligaments and tendons in the phenotypic expression of early hand osteoarthritis. Annals of the rheumatic diseases 2006;65(10):1267-1272.
4. Ma YJ, Carl M, Searleman A, Lu X, Chang EY, Du J. 3D adiabatic T1rho prepared ultrashort echo time cones sequence for whole knee imaging. Magnetic resonance in medicine 2018;80(4):1429-1439. 5. Ma YJ, Carl M, Shao H, Tadros AS, Chang EY, Du J. Three-dimensional ultrashort echo time cones T1rho (3D UTE-cones-T1rho ) imaging. 2017;30(6).
6. Ma YJ, Chang EY, Carl M, Du J. Quantitative magnetization transfer ultrashort echo time imaging using a time-efficient 3D multispoke Cones sequence. Magnetic resonance in medicine 2018;79(2):692-700.
7. Ma YJ, Chang EY, Carl M, Du J. Quantitative magnetization transfer ultrashort echo time imaging using a time-efficient 3D multispoke Cones sequence. Magnetic resonance in medicine 2017.
8. Ma YJ, Lu X, Carl M, Zhu Y, Szeverenyi NM, Bydder GM, Chang EY, Du J. Accurate T1 mapping of short T2 tissues using a three-dimensional ultrashort echo time cones actual flip angle imaging-variable repetition time (3D UTE-Cones AFI-VTR) method. Magnetic resonance in medicine 2018;80(2):598-608.
Figures