1399
The comparison of two ultra-short echo time methods for T2* mapping in Achilles tendon and enthesis1High Field MR Centre, Department of Biomedical Imaging and Image-Guided Therapy, Medical University of Vienna, Vienna, Austria, 2Institute of Measurement Science, Slovak Academy of Sciences, Bratislava 4, Slovakia, 3Central European Institute of Technology, Masaryk University, Brno, Czech Republic, 4Institute of Scientific Instruments, Czech Academy of Sciences, Brno, Czech Republic, 5Division of Radiological Physics, Department of Radiology, University of Basel Hospital, Basel, Switzerland
Synopsis
We compared the performance of two MR techniques, ultra-short TE (UTE) and variable-echo time (vTE), to estimate mono- and bi-exponential T2* in Achilles tendon and enthesis at 3T. In axial slice orientation, the mean T2* values for UTE were (mono, short, long) 4.1 ± 1.1 ms, 0.9 ± 0.3 ms and 19.6 ± 7 ms, for vTE we found the values 10.5 ± 3.9 ms, 1.4 ± 0.4 ms and 25 ± 3 ms. In sagittal slice orientation, the mean T2* values for UTE were (mono, short, long) 2.8 ± 0.5 ms, 0.4 ± 0.1 ms and 10.5 ± 1.7 ms, for vTE we found the values 5.3 ± 1.5 ms, 1.6 ± 0.3 ms and 22.3 ± 5.6 ms. T2* values calculated with vTE are overestimated in comparison to UTE, however, the clinical value of vTE might be higher, since it provides more slices with reduced blurring and lower scan times.
Introduction
Bi-exponential fitting of T2* in Achilles tendon and Achilles tendon enthesis by separating different T2* components may improve the diagnostic reliability in these tissues [1]. Unlike mono-exponential T2* calculation, the bi-exponential calculation is more computationally demanding and, more importantly, technologically more difficult [2]. Sufficient number of TEs and short TE are necessary to perform a reliable analysis. This study provides a comparison of customized 2D-UTE [3] and a 2D variable-echo time pulse sequence [4] describing the pros and cons of both methods of bi-exponential T2* Achilles tendon and enthesis imaging.Materials and Methods
Four volunteers (mean age 31 ± 6 years) with healthy Achilles tendons with no history of injury were involved in the study. The measurements were performed at 3T MRI scanner (Siemens Healthineers, Erlangen, Germany) using 4-channel special purpose flexible coil (Siemens Healthineers, Erlangen, Germany ) positioned with a custom holder. Two MR sequences were used, each in sagittal and axial plane. We used a custom made 2D-UTE with 12 echo times ranging from 0.06 to 20ms (FOV 120x120mm, FA 17°, matrix 256x256, using a VERSE pulse, slice thickness of 1.25mm, TA=4:05min) and vTE sequence with 10 echo times ranging from 0.95 to 20.95 ms (FOV 140x140mm, FA 6°, matrix 192x192, slice thickness 3mm, 32 slices, TA=9.07min, and with asymmetrical first echo). Bi-exponential T2* mapping was performed using Levenberg-Marquardt least-squares fit using mpcurvefit library[5]. Short and long T2* components were calculated as well as mono-exponential T2* for comparison. In sagittal orientation, tendon was divided into four regions (INS-insertion, MID-mid portion, MTJ-musculo-tendon junction and ENT - enthesis), in sagittal orientation, whole tendon only was evaluated.Results
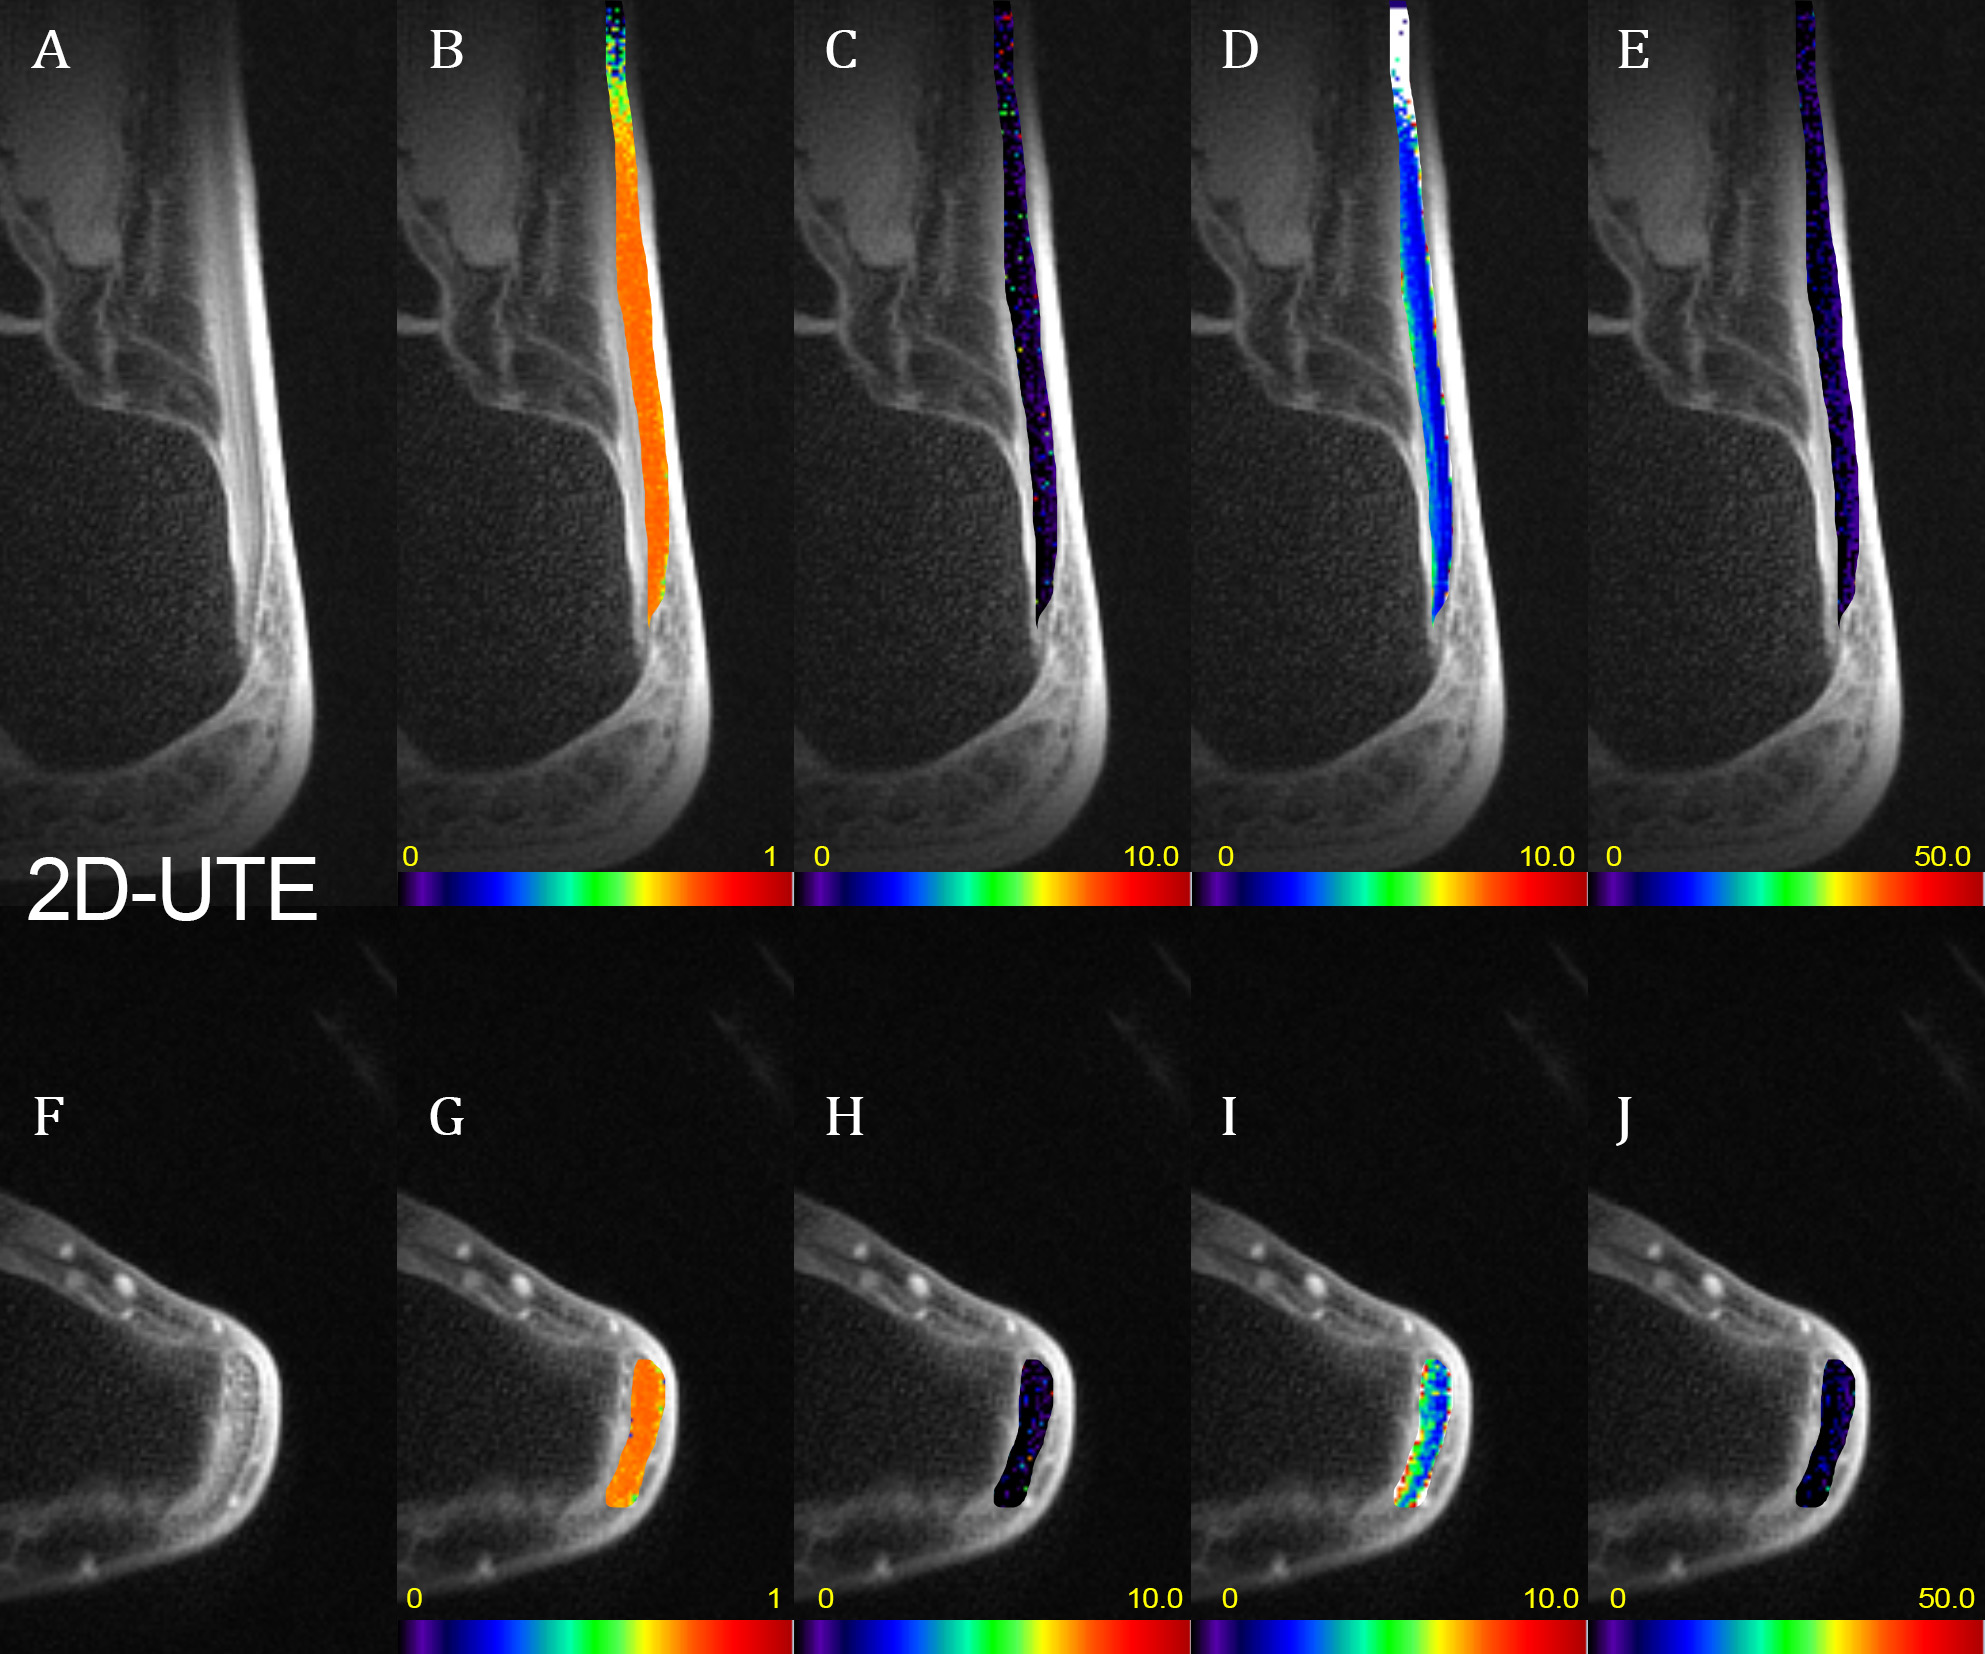
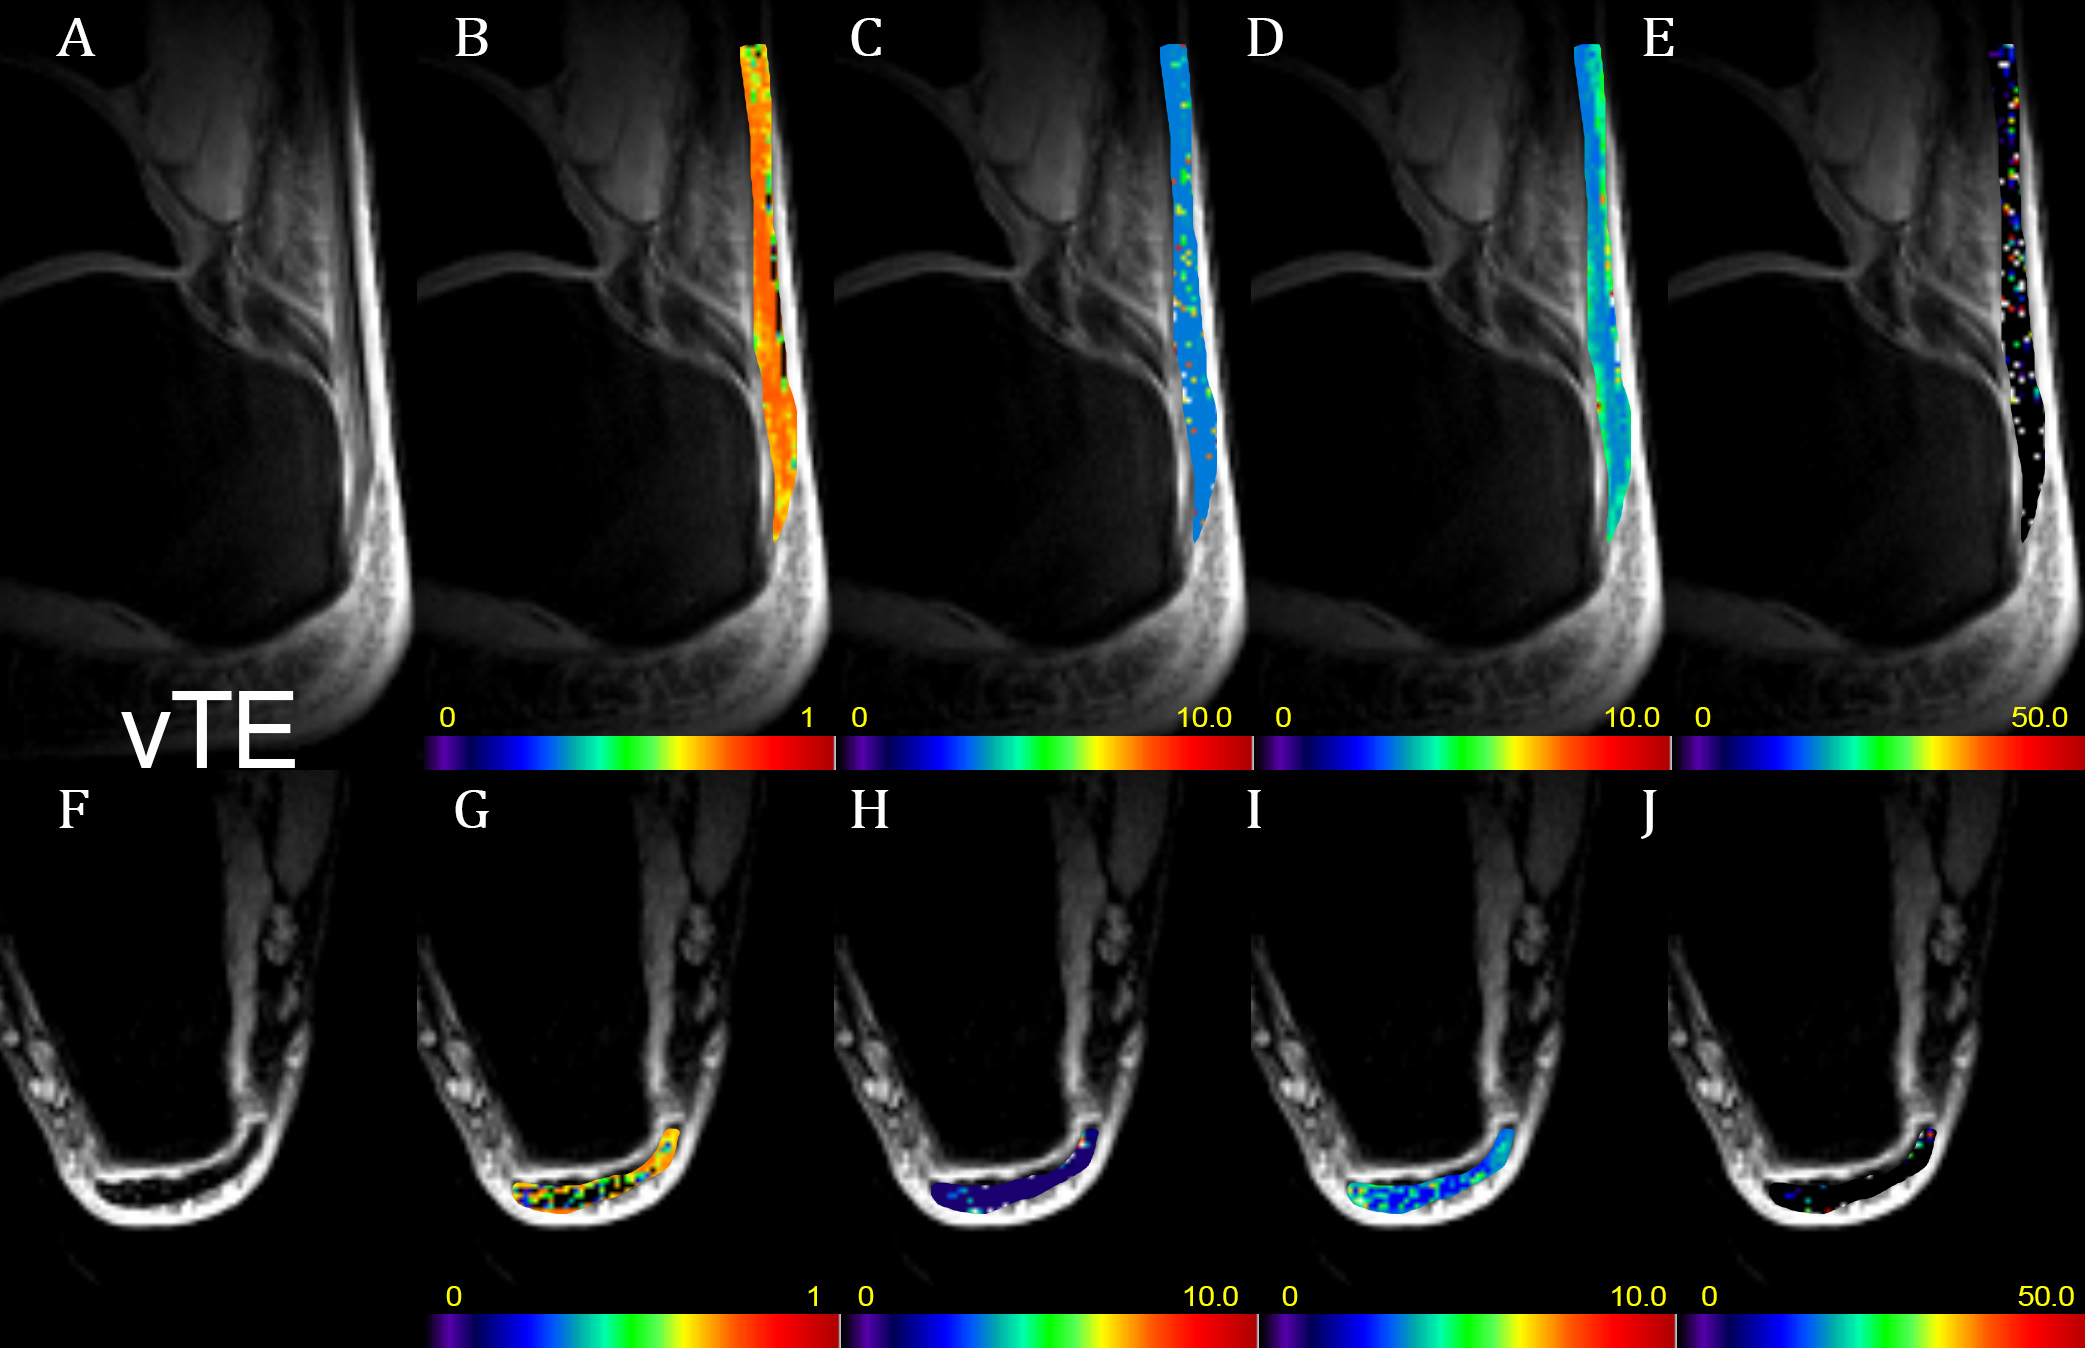
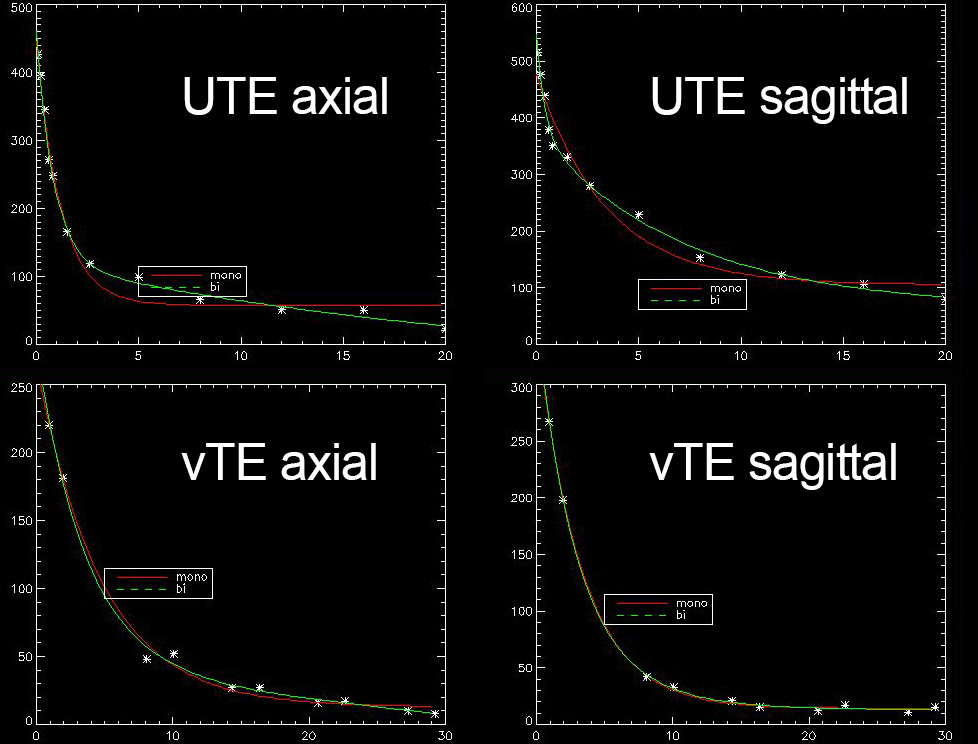
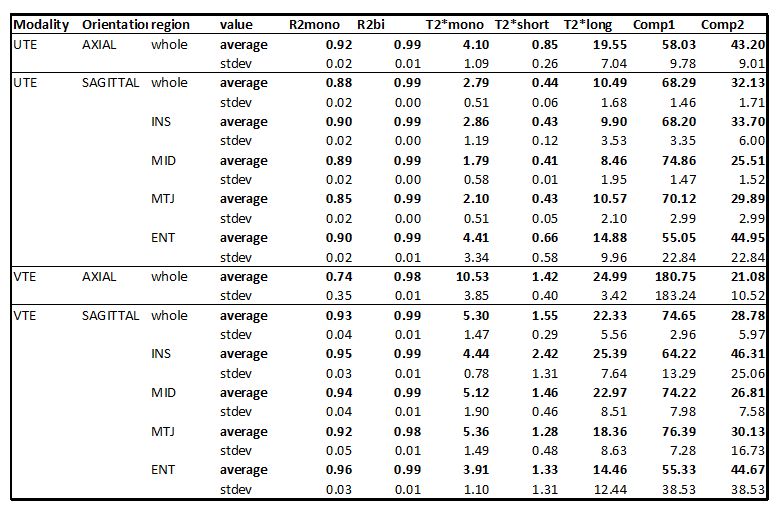
In case of axial orientation, the mean T2* values for UTE were (mono, short, long) 4.1±1.1ms, 0.9±0.3ms and 19.6±7ms, for vTE we found the values 10.5±3.9ms, 1.4±0.4ms and 25±3.4ms. In sagittal orientation, the mean T2* values for UTE were (mono, short, long) 2.8±0.5 ms, 0.4±0.1ms and 10.5±1.7ms, for vTE we found the values 5.3±1.5ms, 1.5±0.3ms and 22.3±5.6ms (Table 1). We found statistically significant differences between UTE and vTE for mono-exponential T2* (p=0.03), short T2* component (p<0.01) and long T2* component (p=0.01). Example UTE and vTE T2* maps are depicted in Fig. 1 and 2. The fits are visualized in Fig. 3.Discussion
In this study, we analysed the performance of T2* mapping performance of 2D-UTE and vTE. For 2D-UTE the following measures were applied to ensure fidelity of the images [6]: a) to minimize possible in-plane intensity variation and blurring artefacts the readout gradients were calibrated and k‑space sampling trajectories were corrected during reconstruction , b) the selected slice was kept close to the isocenter to minimize possible eddy current distortion. A fat saturation pulses were applied in both 2D-UTE and vTE. As vTE is capable of the shortest TE slightly below 1ms, there was an overestimation of T2*. UTE with the shortest TE of 0.06ms was able to precisely detect the short T2* component which depicts the ‘bound’ water. On the other hand, vTE sequence is in general more time efficient and avoids possible out of slice signal contamination contrary to 2D-UTE which results in much lower blurring artefacts in the imagesConclusion
T2* values calculated with UTE tend to be more realistic and avoid possible overestimations, however vTE appears to be more suitable for daily routine use due more robustness, better resolution in slice direction and faster acquisition in general.Acknowledgements
This work was supported by the Austrian Science Fund (FWF) KLI541-B30 and Slovak Grant Agency APVV-15-0029. We acknowledge the core facility MAFIL of CEITEC supported by the Czech‑BioImaging large RI project (LM2015062 funded by MEYS CR) and MEYS CZ.02.1.01/0.0/0.0/16_013/0001775 for their support.References
[1] Juras V, et al. Regional variations of T2* in healthy and
pathologic Achilles tendon in vivo at 7 Tesla: Preliminary results, Magnetic
Resonance in Medicine, 68(5), pp. 1607-1613, 2013
[2] Du J et al. Ultrashort echo time imaging
with bicomponent analysis, Magnetic Resonance in Medicine, 67(3), pp 645-649, 2012
[3] Latta P. et al, K-space trajectory mapping
and its application for ultrashort Echo time imaging, Magnetic Resonance
Imaging, 36, pp. 68-76, 2017
[4] Deligianni X et al, High‐resolution
Fourier‐encoded sub‐millisecond echo time musculoskeletal imaging at 3 Tesla
and 7 Tesla, Magnetic Resonance in Medicine, 70(5), pp. 1434-1439, 2013
[5] Craig B. Markwardt, NASA/GSFC Code 662,
Greenbelt, MD 20770, http://cow.physics.wisc.edu/~craigm/idl/idl.html
[6] Latta
P. et al Influence of k-space trajectory corrections on proton density mapping
with
ultrashort
echo time imaging: Application for imaging of short T2 components in white
matter. Magnetic Resonance Imaging, 51, pp. 87-95, 2018
Figures